- Submissions

Full Text
Progress in Petrochemical Science
Oxygen Interference in Methane Generation from Biodégradation of Solid Waste from Tanneries
Caroline Borges Agustini1*, Wolmir Lourenço Neto1, Marisa Costa2 and Mariliz Gutterres1
1Chemical Engineering Department, Federal University of Rio Grande do Sul, Brasil
2Institute of Basic Health Sciences (ICBS), Microbiology Department, Federal University of Rio Grande do Sul, Brasil
*Corresponding author: Caroline Borges Agustini, Chemical Engineering Department, Leather and Environment Laboratory, Federal University of Rio Grande do Sul, Brazil
Submission: February 05, 2018; Published: February 23, 2018

ISSN 2637-8035Volume1 Issue1
Summary
The main solid wastes from tanneries are wet-blue shavings (chrome tanned leather) and sludge emitted mainly from waste-water treatment plants (WWTP). The main degradation process that occurs on solid media is anaerobic digestion. In this process the main products are methane (CH4), which has a high calorific value, and carbon dioxide (CO2); together these gases compose the emitted biogas. Methanogens, which are strict anaerobes, are responsible for the last step of anaerobic digestion and it is through their metabolism that methane is generated. The aim of this study was to evaluate the interference of oxygen on methane yield in the biogas produced in the controlled biodegradation of leather industry solid waste where in oxygenation occurred through a momentary exposure to atmospheric oxygen. Biodegradation of the solid waste residue was carried out in bench bioreactors and each bioreactor was momentarily exposed to atmospheric oxygen by opening the top cover for 10min at different degradation times. To determine the composition of the gases produced during the biodegradation, a gas chromatograph was used. The results showed that methane production started before the oxygen was completely consumed in all assays. Each bioreactor showed a different behavior after its momentary exposure to atmospheric oxygen and the behavior was strongly linked to the availability of nutrients. When the oxygen exposure occurred at a stage when there were still adequate nutrients, methanogenesis could recover but when the oxygen exposure was made after the nutrients were depleted, methane formation did not recover.
Keywords: Anaerobes; Biogas; Methane; Oxygen; Tannery
Introduction
Although the leather industry utilizes animal hide, a byproduct of the meat packing industry, as raw material, the industry is challenged with environmental issues related to the waste generated in the tanning process as liquid effluents and solid waste [1]. The implementation of cleaner technologies in leather processing greatly reduces the pollution generated in tanneries; however, these technologies are more focused on the effluents generated and solid waste is typically disposed of in landfills [2]. The main solid wastes from tanneries are sawdust, wet-blue shavings (from chrome tanned leather), finished and semi-finished leather cuts, as well as sludge. Wet-blue leather shavings are generated in the adjustment of leather thickness and consist mainly of protein organic matter. Even though the shavings were treated with chrome tanning salts, they are typically capable of being biodegraded [3].
The main degradation process that occurs on solid waste is anaerobic digestion, which consists in biochemical growth of microorganisms through the degradation of organic and inorganic compounds in the absence of molecular oxygen [4]. In this process, the main final products are methane (CH4), which has a high calorific value, and carbon dioxide (CO2); together these gases compose biogas [5]. The most important factors that influence anaerobic digestion are the availability and the complexity of the substrate, the temperature range in which the reactions occur, the moisture (which influences the dissolution of organic matter), pH (which influences the enzyme activity) and the presence of inhibitors. It is uncommon that a biological treatment be carried out by a single microbial species; generally, a microbial consortium is responsible for the process [6]. Each microorganism may have specific metabolic and nutritional requirements to carry out each step in the biochemical degradation of solid waste during anaerobic digestion. Typically, anaerobic digestion occurs in four interrelated phases: hydrolysis, acidogenesis, acetogenesis and methanogenesis. The phases are connected by the products generated from the different microbial activities in a given step, which then serve as a substrate for the next step [7-9]. In general, microorganisms are classified according to their oxygen requirements. Strictly, aerobic microorganisms need oxygen as it participates in the metabolism as a final electron acceptor. While oxygen is generally toxic for anaerobes, facultative anaerobic micro organisms survive in the presence or absence of oxygen. Aerotolerant anaerobes can develop in the presence of oxygen without using it. Microaerophilic microorganisms require lower pressures of oxygen (10-15%) to develop [10].
The methanogens are responsible for the last step of anaerobic digestion and it is through their metabolism that methane is generated. Methanogens belong to the Archaea domain, which is characterized by prokaryotic microorganisms that are evolutionarily distinct from the Bacteria and Eukaryote domain microorganisms in their genomic organization, gene expression, cellular composition and phylogeny. The methanogens are strict anaerobes and are important in the anaerobic degradation of organic matter in nature; in fact, most of the methane found on Earth results from methanogen metabolism [11,12].
The tolerance of diverse methanogenic strains to long-term exposure to air/ nitrogen and drying has been investigated. Although methanogens are well known as the strictest anaerobes, specific methanogenic strains such as Methanobacterium bryantii, Methanobacterium thermoautotrophicum, Methanobrevibacter arboriphilicus, Methanosarcina barkeri, and others equipped detoxification enzymes (superoxide dismutase, catalase) can survive in the presence of oxygen [13]. The effects of combinations of desiccation and exposure to O2 on pure cultures of Methanosarcina barkeri (strains fusaro and Methanosarcina), and Methanobacterium, which were both isolated from dry oxic paddy soil, were studied. Drying and exposure to O2 had an additive detrimental effect on the viability of methanogenic bacteria and on the potential of the treated cells to produce CH4. The effect of drying was more severe than O2 exposure and was apparently due to the removal of water rather than to the increase of osmolarity. A significant percentage (0.5-10%) of a methanogenic population survived desiccation under oxic conditions. This is an interesting result, since methanogens are strictly anaerobic bacteria that do not form latent stages [14]. Aeration stress of different durations was applied to cellulose-fermenting methanogenic enrichment cultures during both stages of cellulose degradation. The longer the aeration stress, the stronger was the inhibition of CH4 production at 30 °C and 15 °C. The aeration stress was especially suppressive during the second stage of fermentation, when consumption of acetate (and to a lesser extent propionate) was also increasingly inhibited as the duration of the stress increased [15].
Since oxygen tolerance is of the utmost importance for high performance and robust methane production processes [16], the aim of this study was to evaluate the interference of the presence of oxygen on methane yields in the biogas produced in controlled biodegradation tests of a mixture of the main solid waste concerning the leather industry: wet-blue leather shaving and sludge from WWTP.
Materials and Methods
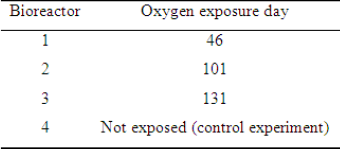
To evaluate the interference of oxygen presence on methane yield in biogas produced by leather solid waste digestion, the cultivation of the residues was carried out in four bench bioreactors (Figure 1). To each bioreactor was added: 1g of wet-blue leather shaving, 25ml of activated sludge collected from a waste water aerobic bioreactor from a tannery that uses chromium salts as tanning agents (Table 1), and 250ml of a nutrient solution (2g L-1 of yeast extract, 1g L-1 of peptone, 7g L-1 of K2HPO4 and 3g L-1 of KH2PO4) to ensure favorable conditions for the initial growth of microorganisms. Each bioreactor was momentarily exposed to atmospheric oxygen by opening its top cover for 10min at different degradation times (Table 2). The internal pressure produced in the bioreactor due to the biogas production was relieved daily through the superior valve (Figure 1). The gravimetric method was used to determine volatile matter, ash content, total suspended solids and volatile suspended solids using an analytical balance. Chromium (III) oxide concentrations were determined with ABNT NBR13341. Method ASTM D2868-10 was used to determine nitrogen TKN and protein content.
Table 1: Characterization of the wet-blue leather shavings and the activated sludge.
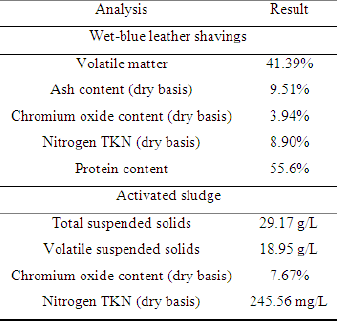
Table 2: Bioreactors exposure day to atmospheric oxygen.
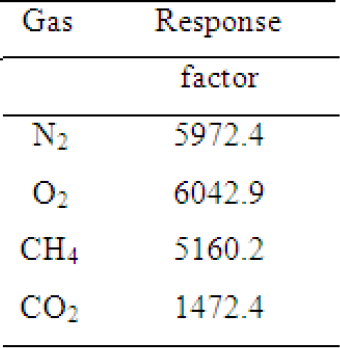
To determine the composition of the gases during the biodegradation, gaseous samples were collected from the bioreactors through the lateral valve weekly and analyzed in a gas chromatograph fitted with a thermal conductivity detector (TCD) and one of two packed columns: Porapak Q (80-100mesh) and Molecular Sieve 13X (80-100mesh). Porapak Q was used to determine the fraction of air (N2+O2), methane and carbon dioxide. Molecular Sieve 13X was used to determine the ratio between nitrogen and oxygen in the air. Helium was used as carrier gas in both columns. The equipment used was a gas chromatograph Auto System XL/GC, Perkin-Elmer, with interface command via Turbochrom 6.0 software. The conditions of each column are shown in Table 3. From the peak area values obtained from the chromatograms, the amount of methane and oxygen were estimated. Firstly, all areas obtained were divided by response factors (Table 4) [17] required to get the real response of the gas concentrations. With the corrected areas, only the relative concentrations were considered. The peak time was not considered due to its great sensitivity to sample introduction in the equipment.
Figure 1: Bench bioreactor design.
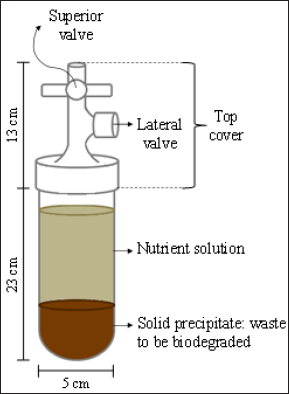
Table 3: Conditions of chromatographic analysis in the two packed columns used.
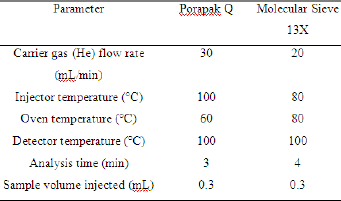
Table 4: Response factors for each gas for the columns used in chromatographic analyzes.
To calculate the percentage of methane in biogas, only the areas obtained through the Porapak Q column analysis were considered because the peaks related to methane in the Molecular Sieve 13X column cannot efficiently separate carbon dioxide from methane and would lead to gross overestimations of the methane content. The results obtained from Molecular Sieve 13X analysis were used to monitor the amount of oxygen in the bioreactors. The O2:N2 ratio obtained with the Molecular Sieve 13X column was applied to the percentage of air obtained with Porapak Q, allowing the oxygen percentage to be determined.
Results
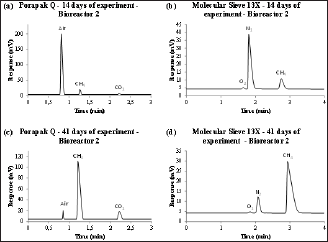
Example chromatograms generated at different stages of biodegradation are shown in Figure 2, where the corresponding gas is indicated in each chromatographic peak. Figures 2a & 2c show the chromatograms generated with the Porapak Q column, which separates air, methane and carbon dioxide. The percentage of each gas was obtained from these areas. Figure 2b & 2d show the chromatograms generated with the Molecular Sieve 13X column, which separates oxygen and nitrogen components of air. Since percentage of air was previously obtained in the Porapak Q column, combined results from the two columns allows complete separation and quantization of the major gases. The peak related to methane was not considered from the data obtained with the Molecular Sieve 13X column as the column retains carbon dioxide and would amplify the methane percentages. The difference in the proportions of each gas throughout the experiment is apparent. Figures 2a & 2b are from the beginning of the experiment and they show large amounts of air and small amounts of methane and carbon dioxide. Figure 2c & 2d are from the high degradation rate phase and show large amounts of methane and carbon dioxide and little remaining amount of air.
Figure 2: Examples of chromatograms generated in mV x s with samples from the bioreactor 2 collected (a) in the second week of the experiment analyzed in Porapak Q column, (b) in the second week of the experiment analyzed in Molecular Sieve 13X column, (c) in the sixth week of the experiment analyzed in Porapak Q column and (d) in the sixth week of the experiment analyzed in Molecular Sieve 13X column.
The percentages of methane and oxygen over time in each bioreactor are shown in Figures 3-6. The moment when each bioreactor was exposed for 10minutes to atmospheric oxygen is indicated. In all assays, it is possible to observe that by 20days of biodegradation, the presence of oxygen was already very low, between 1 and 2%, and coincides with the beginning of the rise in methane production. Methane production started before the oxygen was completely consumed in all assays. This is probably due to the low diffusion coefficient of oxygen in dense media, so that even though still present in the bioreactor, the oxygen did not prevent the formation of anaerobic zones where methanogenic activity was established.
Figure 3: Percentage of methane and oxygen over biodegradation time in bioreactor 1 and indication of the time of momentary exposure to atmospheric oxygen at day 46.
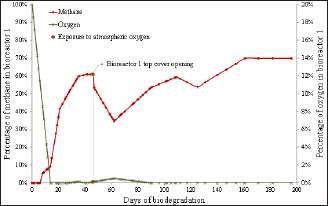
Figure 4: Percentage of methane and oxygen over biodegradation time in bioreactor 2 and indication of the time of momentary exposure to atmospheric oxygen at day 101.
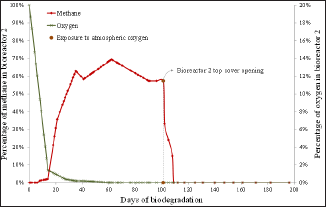
Figure 5: Percentage of methane and oxygen over biodegradation time in bioreactor 3 and indication of the time of momentary exposure to atmospheric oxygen at day 131.
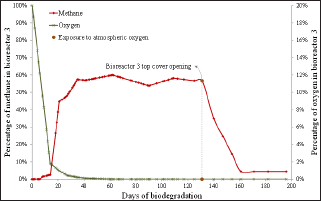
Figure 6: Percentage of methane and oxygen over biodegradation time in bioreactor 4, which was not exposed to atmospheric oxygen (control experiment).
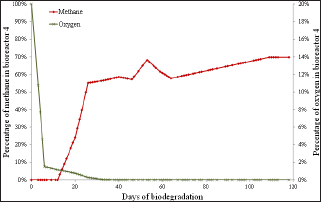
The oxygen behavior in all assays suggests two distinct kinetics of oxygen consumption in biodegradation tests. The first stage suggests zero-order kinetics, which is expected because there are a lot of nutrients in the beginning of the experiment from the waste and nutrient solution. The second stage suggests a first order kinetics, where the consumption rate is proportional to the amount of nutrients; this is expected since the amount of nutrients begins to be depleted and becomes a limiting factor. The oxygen consumption within the bioreactors (Figures 3-6) also showed two different phases. The first phase was observed until approximately day 10 and presents a large decrease in the oxygen percentage- approximately 90%. The second phase of behavior was observed from day 10 until the end of the test and presented a slower decrease in oxygen percentage.
The methane percentage also presented different behaviors as biodegradation occurred (Figures 3-6) and was distinctly similar to the behavior of the number of viable cells in a culture medium enclosed. The methane percentage presented three stages. The first stage was observed until approximately day 10 and was characterized by the absence of methane production. This behavior was probably due to the initial adaptation of the microorganisms and also because methanogenesis is the last stage of biodegradation, it only occurs after the adaptation time of all other groups of microorganisms. The first phase is thus analogous to a "lag phase". The second behavior was observed from day 10 to day 30 and presented an exponential growth in methane percentage, which was expected due to the large amount of nutrients. Thus, the second stage is analogous to a "log phase" due to the exponential growth. The third phase was observed from day 30 until the day of exposure to atmospheric oxygen in each bioreactor. It presented a constant percentage of methane ranging from 60 to 70%; thus, this phase was analogous to a stationary phase.
Each bioreactor showed a different behavior in its momentary exposure to atmospheric oxygen. In bioreactor 1 (Figure 3) there was an increase in the percentage of oxygen from day on which the momentary exposure to atmospheric oxygen occurred (day 46) and then the oxygen percentage later returned to zero. There was also a large drop in methane percentage, but due to the large amount of nutrients still present, it managed to restore. In bioreactors 2 (Figure 4) and 3 (Figure 5), where the momentary exposure to atmospheric oxygen was made when the methane percentage was already in stationary phase, the methane percentage had a great fall but failed to restore, reaching zero in bioreactor 2 and less than 10% in bioreactor 3. The lack of recovery was probably due to the small amount of remaining nutrients, which were assumed to be low because it was a closed system. Bioreactor 4 (Figure 6), which was not open to atmospheric oxygen, presented the expected behavior. The last phase, in which death of the microbes occur due to lack of nutrients, was not observed in this assay, probably because the biodegradation was not observed until the complete depletion of nutrients.
The momentary atmospheric oxygen exposure results show that the oxygen exposure influence depends on the phase in which the mixture under biodegradation in a closed medium was exposed. This dependence may be strongly linked with the availability of nutrients [18]; thus, when the exposure is made at a stage that there are still plenty of nutrients, methanogenesis can recover but when the exposure is made when the nutrients are depleted, oxygen is detrimental. Industrial bioreactors operate continuously in the exponential phase [19], because the supply of organic material to be biodegraded is constant. Thus, the results presented herein suggest that oxygen entries in an industrial operation do not likely interrupt the methane production.
Conclusion
The influence of oxygen exposure on methanogenic archaea proved to be dependent on the phase of biodegradation that the mixture is in. In the beginning ofthe biodegradation assays, methane production rose before the remaining oxygen was consumed. This is probably due to the low diffusion coefficient of oxygen in dense media, so that even when present in the bioreactor, the oxygen did not prevent the formation of anaerobic zones where methanogenic activity was established. The rapid exposure to oxygen did cause the methane percentage to decline in all assays; however, each bioreactor showed a different behavior in its recovery to the momentary exposure to atmospheric oxygen that was strongly linked with the availability of remaining nutrients. When there were plenty nutrients available during the period of exposure to oxygen, methane percentages fully recovered. However, when the oxygen exposure occurred with a small amount of nutrients available, recovery was not complete or did not occur. In relation to industrial production, these results are positive because they suggest any oxygen entries in an industrial bioreactor may likely not permanently diminish the methane production.
Acknowledgement
This study was supported by CNPq (Edital Universal - MCTI/ CNPq N° 14/2013), Fapergs (Edital Fapergs/Capes 17/2012) and Finep (Edital MCTI/Finep CT-HIDRO 01/2013).
References
- Piccin JS, Gomes CS, Feris LA, Gutterres M (2012) Kinetics and isotherms of leather dye adsorption by tannery solid waste. Chemical Engineering Journal 183: 30-38.
- Dhayalan K, Fathima NN, Gnanamani A, Rao JR, Nair BU, et al. (2007) Biodegradability of leathers through anaerobic pathway. Waste Manag 27(6), 760-767.
- Kipper E (2013) Tratamento enzimàtico e produfào de biogás por residuos sólidos de curtumes. Federal University of Rio Grande do Sul, Brazil: p.109.
- Lastella G, Testa C, Cornacchia G, Notornicola M, Voltasio F, et al. (2002) Anaerobic digestion of semi-solid organic waste: biogas production and its purification. Energy Conversion and Management 43(1): 63-75.
- Wiszniowski J, Robert D, Surmaez Gorska J, Miksch, K, Webwe, JV (2006) Landfill leachate treatment methods: a review. Environmental Chemistry Letters 4(1): 51-61.
- Khalid A, Arshad M, Anjum M, Mahmood T, Dawson L (2011) The anaerobic digestion of solid organic waste. Waste Manag 31(8): 17371744.
- Donoso Bravo A, Mailier J, Martin C, Rodriguez J, Aceves Lara CA, eta al. (2011) Model selection, identification and validation in anaerobic digestion: a review. Water Res 45(17): 5347-5364.
- Dang Y, Ye J, Mu Y, Qiu B, Sun D (2013) Effective anaerobic treatment of fresh leachate from MSW incineration plant and dynamic characteristics of microbial community in granular sludge. Appl Microbiol Biotechnol 97(24): 10563-10574.
- Adu Gyamfi N, Ravella SR, Hobbs PJ (2012) Optimizing anaerobic digestion by selection of the immobilizing surface for enhanced methane production. Bioresour Technol 120: 248-255.
- Stephen D, Flickinger M (1999) Encyclopedia of Bioprocess Technology John Wiley.
- Pazinato JM, Paulo EN, Mendes LW, Vazoller RF, Tsai SM (2010) Molecular characterization of the archaeal community in a amazonian wetland soil and culture-dependent isolation of methanogenic archaea. Diversity 2(7): 1026-1047.
- Brochier AC, Forterre P, Gribaldo S (2011) Phylogeny and evolution of the archaea: one hundred genomes later. Curr Opin Microbiol 14(3): 274-281.
- Liu CT, Miyaki T, Aono T, Oyaizu H (2008) Evaluation of methanogenic strains and their ability to endure aeration and water stress. Curr Microbiol 56(3): 214-218.
- Fetzer S, Bak F, Conrad R (1993) Sensitivity of methanogenic bacteria from paddy soil to oxygen and desiccation. FEMS Microbiology Ecology 12(2): 107-115.
- Wu XL, Conrad R (2001) Functional and structural response of a cellulose degrading methanogenic microbial community to multiple aeration stress at two different temperatures. Environ Microbiol 3(6): 355-362.
- Sorlini C, Cosmai ME, Ferrari A (1983) Prevalence of oxygen-intolerant methanogenic bacteria in feces and anaerobic wastes. Current Microbiology 9(6): 355-358.
- Dietz WA (1967) Response factors for gas chromatographic analyses. Journal of Chromatographic Science 5(2): 68-71.
- Bates BL, McIntosh JC, Lohse KA, Brooks PD (2011) Influence of groundwater flowpaths, residence times and nutrients on the extent of microbial methanogenesis in coal beds: Powder River Basin, USA. Chemical Geology 284(1-2): 45-61.
- Balthazor TM, Hallas LE (1986) Glyphosate-Degrading Microorganisms from Industrial Activated Sludge. Appl Environ Microbiol 51(2): 432434.
© 2018 Caroline Borges Agustini, et al. This is an open access article distributed under the terms of the Creative Commons Attribution License , which permits unrestricted use, distribution, and build upon your work non-commercially.
 a Creative Commons Attribution 4.0 International License. Based on a work at www.crimsonpublishers.com.
Best viewed in


.jpg)


 Editorial Board Registrations
 Submit your Article
 Refer a Friend
 Advertise With Us
.jpg)


.jpg)


.bmp)
.jpg)
.png)
.jpg)


.jpg)


.png)

.png)


.png)


