- Submissions

Full Text
Orthopedic Research Online Journal
Mobile Accelerometry in Postural Diagnostics in National and World-Class Athletes
Kurashvili VА1,2*, Karmazin VV1, Zholinsky АV1, Kruglova IV1, Feschenko VS 1,2, Kupeev МV1, Zavyalov VV1, Andreev DА2, Yadgarov МY1, Bazanovich SА1, Royanov DО1, Abdyukhanov RH3, Malochka АV3 and Parastaev SA1,2
1Federal Scientific and Clinical Centre for Sports Medicine and Rehabilitation, Federal Medical and Biological Agency, Moscow, Russia
2Department of Rehabilitation, Sports Medicine and Physical Culture of the Pediatric Faculty of the Federal State Autonomous Educational Institution of Higher Education “Pirogov Russian National Research Medical University” of the Ministry of Health of the Russian Federation, Russia
3OOO Intellectual Healthcare Systems, Russia
*Corresponding author:Kurashvili VА, Federal Scientific and Clinical Centre for Sports Medicine and Rehabilitation, Federal Medical and Biological Agency, Moscow, Russia
Submission: August 12, 2021;Published: September 01, 2021
ISSN: 2576-8875 Volume8 Issue5
Summary
The original method of dynamic evaluation of postural balance for the use in the training camp is proposed. The results of the study of comparative assessment of postural stereotype in national and world-class athletes using stabilometry, balance tests and the proposed methodology are presented. The described results of the study prove high diagnostic significance of mobile accelerometry in detection of postural disorders in highly skilled athletes.
Keywords: Postural balance; Stabilometry; Balance tests; Mobile wireless devices; Projection of global center of mass; Sensors of body position change (Gyroscope; Accelerometer; Magnetometer)
Introduction
The assessment of effectiveness of postural balance control is one of the key stages in the biomechanical examination of an athlete. It enables one to diagnose even minimal changes caused by adaptive (or compensatory) rearrangements arising from the specific influences of the type of sports activity on the function of movement [1,2].
The studies using platforms with built-in sensors that are sensitive to deviations from the vertical axis - stabilometry and balance tests rank high in the diagnostics of postural balance disorders (its asymmetries included) [3].
Stabilometry is an effective way to diagnose and monitor postural disorders, including among national and world-class athletes during rehabilitation after injuries and illnesses. The analysis of the signals of 3 or 4 pressure sensors located in a stationary platform makes it possible to assess the balance of the body in an upright position, maintaining of which is a dynamic process, manifested by the performance of oscillatory movements in various planes. The characteristics of vibrations relative to the average position in the projection onto the plane of support (their amplitude, frequency, direction) are informative parameters reflecting the state of various systems involved in maintaining balance - proprioceptive, visual, vestibular ones. Consequently, the assessment of equilibrium provides information about the functional state of the system of movement as a whole [4].
Balance tests represent assessment of vertical stability on an unstable support with an adjustable degree of mobility. A distinctive feature of this type of hardware systems is the use of a combined accelerometer-gyroscopic sensor built into the platform and making it possible to estimate both linear velocities and velocity-angular characteristics in the coordinate system [5,6]. The limited selection of Hardware-Software Systems (HSS) suitable for carrying out stabilometric and balance examinations at the training-competitive stage as well as insufficient development of methodological approaches to finding out and verification of proprioceptive disorders in athletes can be considered as a cardinal problem of modern sports biomechanics [7-9].
The goal of investigation
Development and testing during the examination of high-class athletes a tryout version of an electronic program for a mobile device (a tablet computer with built-in sensors - a gyroscope / accelerometer, which perceives and processes consistently reproducible objective information about postural function.
The materials and research methods
The study involved 56 athletes aged 15 to 40 years (average age - 22 years):
a) Tennis (8 research subjects)
b) Football (12 research subjects)
c) Curling (10 research subjects)
d) Figure skating (6 research subjects)
e) Cross-country skiing (8 research subjects)
f) Snowboard 12 (research subjects)
The prototype with a test version of the application (Figure 1A & 1B) was used as an experimental method of postural diagnostics, It includes a mobile device (tablet computer) with the operating system iOS version 13, the processor of which coordinates the information supplied by the sensors with the commands generated by the test version of the computer program - an application. The ARKit technology built into the operating system enabling one to recognize and track the images from the camera of the device, identify horizontal and vertical surfaces, as well as light and shadow sources, provided the calibration of position sensors in space. Finally, the prototype includes a specially designed fixation belt that secures the device on the back in the area of the approximate projection of the general center of mass of the subject (in the projection of 10/11 thoracic vertebrae - Th10-Th11) [9].
Figure 1(A & B): The view of the work windows of the tablet computer software: during the examination (A) and while choosing the examination options (B).

The following requirements were applied to this mobile device:
a) The presence of a system of sensors for determining the position in space, including. gyroscope and accelerometer;
b) Compact ergonomic design;
c) Convenient operation and management;
d) Modern operating system;
e) Economic feasibility;
f) Visibility of presentation of diagnostic results and report generation;
g) Long battery life of the device.
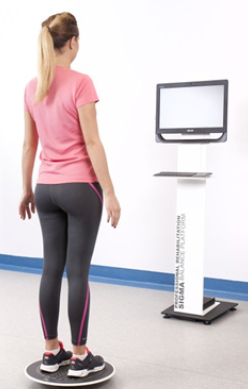
The results of the use of the prototype with a test version of the application for a mobile device - a tablet computer (hereinafter referred to as a tablet computer) were consistently compared with the data of the generally accepted methods for the evaluation of postural functions: at the first stage of the study - with classical stabilometry (HSS Tecnobody Pro-Kin - Figure 2), and at the second stage - with accelerometric balance examination (HSS Sigma - Figure 3). In both cases the simultaneous recording of the data obtained by the compared methods was carried out - Tablet PC + Stabilometric HSS, or Tablet PC + Balance examination HSS. The balance testing at the second stage of the study was carried out in two positions of the subject - sitting and standing on a force plate.
Figure 2: The simultaneous use of stabilometry and the tablet PC examination.
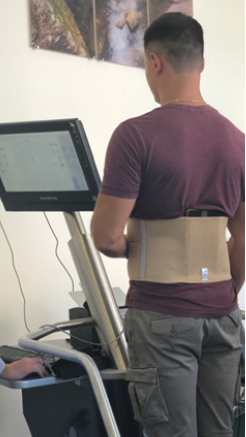
Figure 3: Balance examination HSS Sigma.
Sitting position
The patient sat on the most unstable force plate placed on a firm and level horizontal surface; the legs are knee-bent (at an angle close to 90°), the feet are freely located on the floor (the distance between them is 20-25cm). The patient was asked to maintain balance with a straightened back, fix the position of the head and control the position of an arbitrarily chosen orientation target (at the distance of 1.0-2.0 meters). Voluntary movements were excluded during the study, except for moves to prevent falls. The testing time is 30 seconds.
Standing position
The platform of the balance examination HSS was placed on the floor and the maximally possible degree of instability was set. The patient was asked to stand on the platform and maintain a free vertical position with the same conditions described above for controlling a randomly selected orientation target. The testing was carried out in a European stance (heels in, toes out at the angle of 30°). To prevent possible falls, the support was allowed in case of loss of balance; for this purpose, the platform was installed near a wall or in proximity to massive furniture. The eyes of the subjects were both open and closed during the study. The testing time was also 60 seconds (30 seconds with visual control and 30 seconds without visual control).
The following data processing methods were applied:
a) calculation of the average values of abscissas and ordinates of the statokinesiogram (x,y);
b) calculation of the length and area of the statokinesiogram containing 90% of discrete positions, as well as the Romberg ratio coefficient.
The MS EXCEL 2017 program was used for the accumulation of data as well as for preliminary calculations. The statistical processing of the obtained data was carried out using the Microsoft IBM SPSS Statistics 21 program.
The results of the investigation
The comparative analysis of the results of using the prototype with the test version of the application and stabilometry.
Taking into consideration the location of the sensors of the recording devices in different positions relative to the projection of the Centre of Mass (CM) we did not have sufficient grounds to analyze the numerical values of the parameters of deviations along the X and Y axes and, respectively, we preferred to take into account their directionality - the coincidence was 80-85 %, which suggests the relevance of the study. The graphic data of the force plate and tablet computer confirm the above-mentioned suggestion (Figure 4, 5A & 5B).
Figure 4: The graphical analysis of the statokinesiogram in the tablet computer:
A) open eyes during the study
B) closed eyes during the study
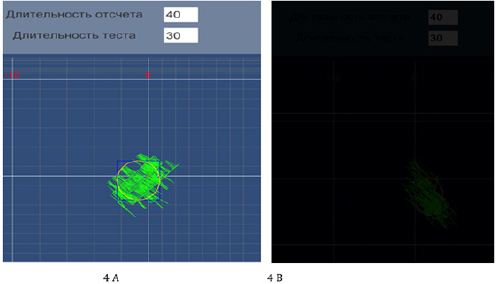
Figure 5: The graphical analysis of the statokinesiogram of the force plate Green curve - closed eyes during the study Red curve – open eyes during the study.
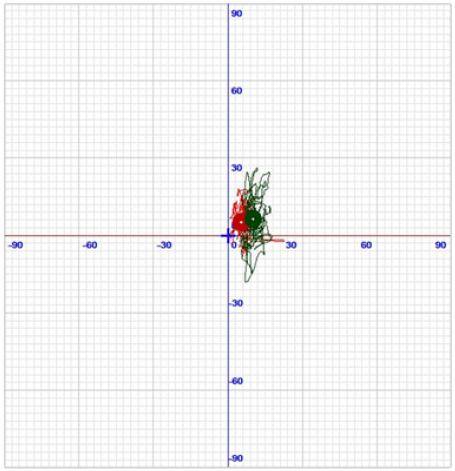
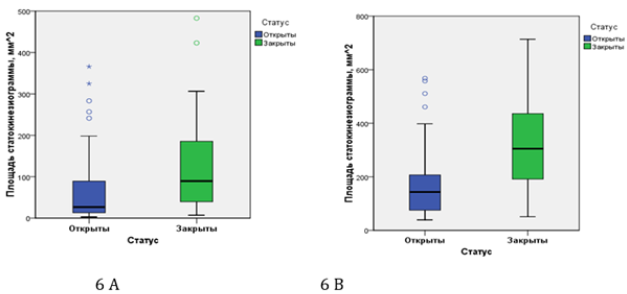
While comparing the data on the area of the statokinesiogram, we are guided by the following issues: the estimation is carried out as the calculation of the area of the confidence ellipse containing 90%-95 % of discrete positions; at the same time the force plate takes into account 95% of the values, and the tablet computer - 90% of them. Therefore, the level of error when comparing the data obtained by the different methods can reach 10-15% (Figure 6A & 6B).
Figure 6: Diagram of the distribution of the area of the statokinesiogram during examination using a tablet computer (A) and stabilometric HSS (B).
(A) (B) вертикальные надписи - Statokinesiogram area, mm2, горизонтальные надписи - Оpen Status Closed
The results of the correlation analysis revealed the presence of a high positive relationship in the values of the parameter “Statokinesiogram area” between the “Tablet computer” group and “Stabilometric HSS” group (Table 1; Figure 7). An exponential regression model is optimal for describing this relationship; the value of the corrected coefficient of determination was 0.317.
According to the output of Shapiro-Wilk test the discrepancy between the data and the normal distribution law was found out, which resulted in the use of nonparametric criteria of analysis. For example, the structure of data analysis of each method under consideration reveals statistically significant differences in the median values of the parameter “Statokinesiogram area” obtained whilst performing tasks with open or closed eyes (Table 2). The differences in the median values of this indicator were also shown when comparing the results of the methods, probably because the devices are based on various principles of recording postural vibrations. In relative terms (Romberg coefficient) the degree of increase in the area of the statokinesiogram with the exclusion of visual control for the “Tablet computer” group was 336.4, and for the “Force plate” group - 212.5 (Table 2).
Figure 7: The curve of exponential regression of the parameter “Statokinesiogram area”. на рисунке вертикально: Statokinesiogram area, Ipad на рисунке горизонтально: Statokinesiogram area, force plate стабилометрик платформ
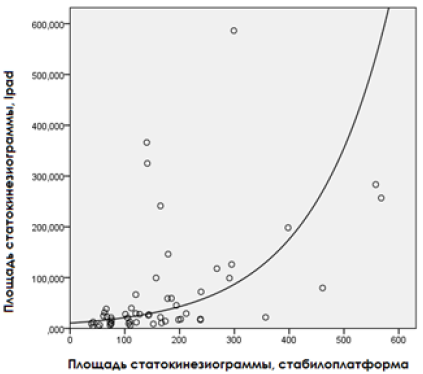
Table 1: The values of the corrected coefficient of determination.

Table 2: The correlation analysis of the parameter “Statokinesiogram area”.

*The calculation of Mann-Whitney U test, statistical difference is present when p < 0,05.
ROC Curve evaluation showed the similarity of the models for the hardware assessment of postural stability, tested by the stabilometry method and by using a tablet computer according to the proposed method under the conditions for performing functional tests modified according to the standard algorithm (Figure 8; Table 3).
Figure 8: Sensitivity / Specificity of the parameter “Statokinesiogram area” of the force plate and tablet computer during establishing the status “open/closed eyes” .
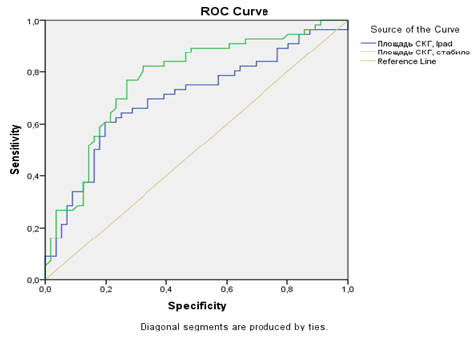
Table 3: The comparison of the SKG areas.

Our correlation analysis of the length of the statokinesiogram revealed a high positive relationship of values between the groups under study - the value of the adjusted coefficient of determination in the created exponential regression model was 0.593 (Figure 9; Table 4).
Figure 9: The curve of the exponential regression of the parameter “Statokinesiogram area”. вертикальная подпись на рисунке - Path, ipad, горизонтальная - Path, force plate
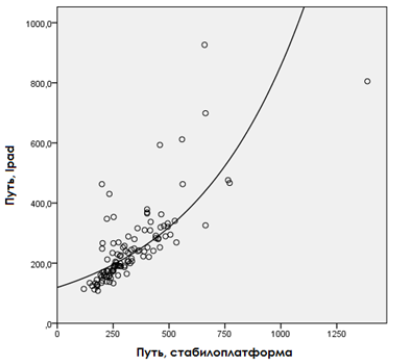
Table 4: The comparison of the length of the SKG under ROC-curve: a tablet computer and stabilometric HSS.

While comparing the parameter of the length of the statokinesiogram assessed both by the stabilometric method and by using a tablet computer under visual control conditions or without it as well as the parameter of the area, the presence of statistically significant differences in the medians was noted (Figure10A & 10B; Table 5). The differences in the absolute values estimated by applying each method were reidentified; in respect of the relative values the differences in changes in the length of the statokinesiogram between the groups (Tablet computer / Stabilometric HSS) were insignificant.
Figure 10: Diagram of the distribution of the length of the statokinesiogram during examination using a tablet computer (A) and stabilometric HSS (B).
вертикальные подписи к рис. А и Б - Path, mm, горизонтальные - Status, open, closed
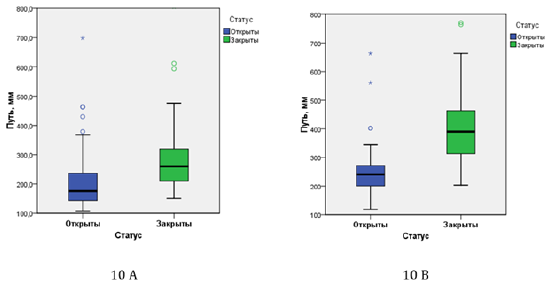
Table 5: The comparison of the data of the parameter “the length of the statokinesiogram”.

Consequently, both methods showed a statistically significant
unidirectional change in the values of the area and length of the
statokinesiogram if tested under conditions modified according to
the standard algorithm - under visual control and without it.
Statistically significant differences were found in the absolute
values of the parameters under study resulting from the use of
different types of detecting devices, and the pronouncement of
relative changes (closed / open eyes) of the indicators in the
examined groups was determined by the proportion of 3: 2 for the
area of the statokinesiogram and by that of 1: 1 for its length, which
appears to be due to fundamental differences in the methodology
for recording postural characteristics.
However, the comparative postural examination using a tablet
computer and a stabilometric complex revealed the similarity of the
models of postural stability in the area of the statokinesiogram and
a high correlation of the length values of the statokinesiogram in the
studied groups (in methods), which indicates the comparability of
the results obtained for clinical assessment despite the constructive
and methodological differences between the techniques in
comparison.
The comparative analysis of the results of using the prototype with the tryout version of the application and balance tests
The algorithm for the synchronized registration of the test data (balance HSS + tablet computer) in patients’ sitting and standing positions selected for the second stage of the study is justified by the following reasons:
1. According to the results of the studies carried out by us in the earlier period a high sensitivity of balance examination in the sitting position of the patient was revealed - due to the approximation of the projection of the GCM to its real localization.
2. The sensor of the platform of the balancometric complex and that of the tablet computer is a combined accelerometric / gyroscopic sensor with similar technical characteristics and sensitivity to the angular oscillations of the platform.
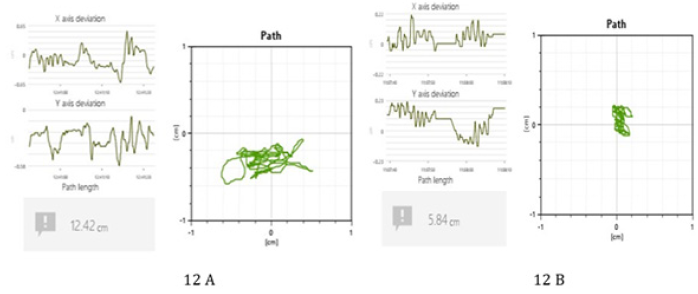
Considering all the issues mentioned above the task of this stage of the study is to compare the direction and the degree of changes assessed by various devices equipped with the same type of sensors bearing in mind different localization of the latter in relation to the GCM. Below are examples of graphical analysis of a survey using a balancometric HSS and a tablet computer (Figure 11A, 11B & 12A, 12B).
Figure 11: Graphical analysis of the statokinesiogram of a tablet computer in the following positions: A) Sitting B) Standing.
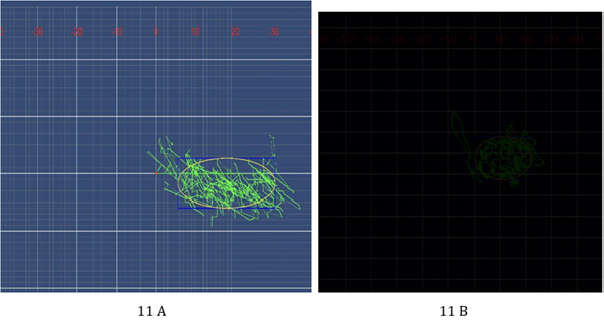
Figure 12: Graphical analysis of the statokinesiogram of a balancometric examination in the following positions: A) Sitting B) Standing.
While analyzing the test data in sitting and standing positions, statistically significant differences in the area of the statokinesiogram in the “Tablet computer” group and “Balancometric HSS” group were revealed (Figure 13). The results of the correlation analysis reveal no correlation in the values of the statokinesiogramm area in the groups under study (Table 6).
Figure 13: Diagram of the distribution of the area of the statokinesiogramm during the examination using a tablet computer (A) and a balancometric (B).
Вертикальные надписи - Path (рис. А), The area of the statokinesiogramm (рис. Б). Горизонтальные надписи - Status. iPad, Balance platform (sigma) (A, B).
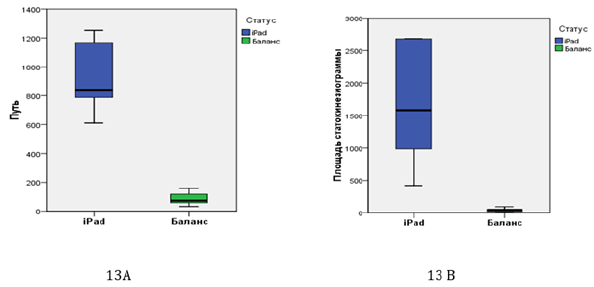
Table 6: Correlation analysis of the values of the length of the statokinesiogram.

In respect of the parameter of the length of the statokinesiogram statistically significant differences in the features determined both in the sitting position and in the standing position were revealed (Figure 14A & 14B; Table 7). However, the results of the correlation analysis revealed a high relationship in the values of the length of the statokinesiogram in the groups “Tablet computer” and “Balancometric HSS” in the standing position. A linear regression model is optimal for describing this relationship, the value of the adjusted coefficient of determination was 0.848 (Figure 15).
Figure 14: Diagram of the distribution of the length of the statokinesiogram during the examination using a tablet computer (A) and balancometric HSS (B).
Вертикальные надписи - Path, mm (рис. А, B), the area of the statokinesiogram (рис. Б). Горизонтальные надписи - Status, Sitting, Standing (A, B).
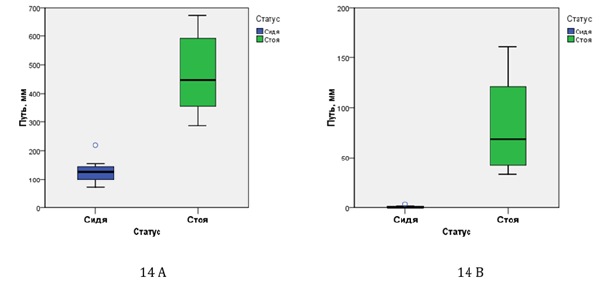
Figure 15: The curve of exponential regression of the parameter “The length of the statokinesiogram (perimeter)”. Вертикальная надпись - Path, ipad. Горизонтальная - Path, force plate
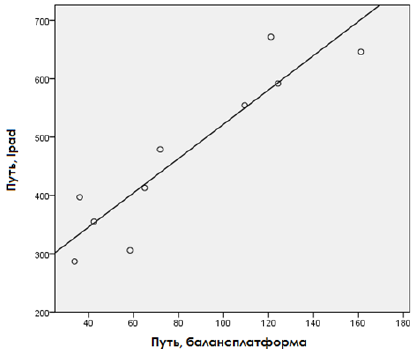
Table 7: The analysis of the features of the length of the statokinesiogram in the groups “Tablet computer” and “Balancometric HSS”

*The calculation of Mann-Whitney U test, statistical difference is present when p < 0,05
Our ROC-analysis revealed that both models of the assessment of postural stability are characterized of absolute (100 per cent) sensitivity and specifity in determining the status “sitting/ standing” (Table 8). The differences in the results of the use of the balancometric HSS and that of a tablet computer can be explained by a different location of the accelerometer-gyroscope, since the sensor of the tablet computer was in close proximity to the localization of an athlete’s GCM, i.e. in the lumbar region, and the data of a balancometric examination reflect an athlete’s vibrations projected onto the support platform. At the same time, while comparing the results obtained with the use of a tablet computer and the balancometric complex Sigma, the general tendency is that the results depend on the position (standing and sitting).
Table 8: ROC analysis of the length of the statokinesiogram in the groups “Tablet computer” and “Balancometric HSS” in a standing position.

Conclusion
The results of the comparative analysis lead to the conclusion that the method for studying postural balance proposed in the experiment is valid and can be used as an alternative to standard stabilometric techniques being suitable for the training camp, where there is no stationary biomechanical equipment. In this case, it is necessary to take into account the location of the device - to be more accurate, as close as possible to the centre of mass, which is an advantage of the examination using a tablet computer because of the higher susceptiveness of the sensor to postural vibrations revealed in our study.
Our comparisons of methodological approaches (classical stabilometry / proposed technique, balance tests / proposed technique) have demonstrated high sensitivity and reproducibility of test results using a tryout version of the application for a tablet computer with built-in sensors and cameras. The foregoing makes it possible to recommend the entrance of the created mobile application into the list of software elements of a remote working place of a sports team doctor in the training camp, i.e. under the conditions of real training activities.
References
- Feshchenko VS. Postural disorders in highly qualified athletes. principles of diagnostics and correction. Author’s extended abstract of dissertation for a Candidate Degree in Medical Sciences / Pirogov Russian National Research Medical University. Moscow, Russia.
- Popogrebsky MA, Anisimov EA, Karmazin VV, Feshchenko VS (2017) Algorithm of clinical and biomechanical examination of highly qualified athletes. Medicine of Extreme Situations 61(3): 128-131.
- Miroshnikova YuV, Pushkina TA, Feschenko VS, Tarasov BA, Samoilov AS, et al. (2017) Development and research of methods for urgent mobile diagnostics of brain injuries in highly qualified athletes. Exercise Therapy and Sports Medicine 5(143): 18-28.
- Maksimova AA, Davydov PV, Lobov AN, Feschenko VS (2013) Computer stabilometry as a method for assessing the effectiveness of rehabilitation measures after a mild closed craniocerebral injury in highly qualified female boxers. Sports Medicine: Science and Practice (3): 50-59.
- Larsson P (2003) Global positioning system and sport-specific testing. Sports Med 33(15): 1093-1101.
- Boyd LJ, Ball K, Aughey RJ (2011) The reliability of MinimaxX accelerometers for measuring physical activity in Australian football. Int J Sports Physiol Perform 6(3): 311-321.
- Wu F, Zhang K, Zhu M, Mackintosh C, Rice T, et al. (2007) An investigation of an integrated low-cost GPS, INS and magnetometer system for sport applications. In proceedings of the 20th international technical meeting of the satellite division of the institute of navigation (ION GNSS 2007), Fort Worth, TX, USA, pp. 113-120.
- Milosevic M, Gagnon DH, Gourdou P, Nakazawa K (2017) Postural regulatory strategies during quiet sitting are affected in individuals with thoracic spinal cord injury. Gait & Posture 58 : 446-452.
- Zavyalov VV, Feschenko VS (2019) A mobile application for assessing postural balance in sports medicine. In: Collection of abstracts of the XIV International scientific conference on the present and prospects for development of medicine in world-class sports “Sportmed -2019”, pp. 184-185.
© 2021 Kurashvili VА. This is an open access article distributed under the terms of the Creative Commons Attribution License , which permits unrestricted use, distribution, and build upon your work non-commercially.
 a Creative Commons Attribution 4.0 International License. Based on a work at www.crimsonpublishers.com.
Best viewed in


.jpg)


 Editorial Board Registrations
 Submit your Article
 Refer a Friend
 Advertise With Us
.jpg)


.jpg)


.bmp)
.jpg)
.png)
.jpg)


.png)

.png)


.png)


