- Submissions

Full Text
Orthopedic Research Online Journal
Can Foot Exercises and Barefoot Weight Bearing Improve Foot Function in Participants with Flat Feet?
Marcey Keefer Hutchison* and Jeff Houck
Department of Physical Therapy, USA
*Corresponding author:Marcey Keefer Hutchison, 414 N Meridian #V123, Newberg, Oregon, USA
Submission: April 06, 2018;Published: July 03, 2018
ISSN: 2576-8875 Volume3 Issue4
Abstract
Background: Unexplored in individuals with flatfoot (FF) is the potential of foot specific exercise and barefoot weightbearing (BWB) to improve foot function. The purposes of this study were
A. To evaluate whether exercise and BWB alter foot muscle structure in participants with FF
B. To evaluate whether exercise and BWB alters foot and ankle function in participants with FF
C. To compare foot muscle structure and foot and ankle function between participants with FF to controls with neutral foot posture prior to exercise.
Methods: Twenty participants with FF and 12 participants with neutral foot posture participated.Participants with FF completed 8 weeks of 4 foot exercises and 2 hours of BWB.Pre and post-exercise tests included:
A. Diagnostic ultrasound to quantify abductor hallucis cross sectional area (CSA)
B. Embedded force plates to assess paper grip test (PGT) force
C. Heel rise height and repetitions
D. The Foot and Ankle Ability Measure (FAAM), and qualitative data to capture potential benefits post-exercise.Control and FF data was compared pre-exercisewith independent t-tests.
Two-way repeated measures ANOVA’s were used to compare participants with FF pre and post-exercise.The effect size index (ESI) was used to note the degree of improvement.
Results: Participants with FF significantly improved in all variables except the FAAM. Muscle CSA increased from 0.27cm2 to 0.35cm2, a 12.9- 16.7% increase (P< 0.05).The PGT showed increased force post-exercise from 13.2N to 13.7N (P< 0.05). Post-exercise heel rise repetitions increased from 7.1-7.6 repetitions (P< 0.05).Compliance was 87.7% of prescribed exercises and 111% of time targeted for BWB.
Conclusion: Foot specific exercises and BWB achieve sufficient training intensity to result in changes in foot function. The study confirms that training effects specific to the foot are achievable in participants with FF, and likely to patients with foot problems.
Keywords:
Introduction
While flatfoot (FF) is often considered a benign abnormality, data suggests that individuals with significant flatfoot posture are at mildly higher risk for a variety of musculoskeletal problems [1,2]. When activity levels increase, for example running, the risk of musculoskeletal problems may increase [3]. In addition, foot weakness has been associated with specific musculoskeletal foot problems including [1,4,5] wearing of orthotics [4], flatfoot [6- 8], foot pain [5] and falls in the elderly [9]. Therefore, providers specializing in foot and ankle problems may recommend specific treatments like shoe wear or exercise for FF to mitigate a number of potential health related problems [5,9,10]. Interestingly, studies of the effects of shoe wear during running [11,12] and walking [13] postulate that shoe wear may overly brace foot joints, resulting in foot muscle weakness [4]. Some studies demonstrate differences in joint motion and muscle activation for unshod walking [13], however, the majority of studies are focused on unshod running [14,15]. Unexplored in these studies is the potential positive effect of exercise and barefoot weightbearing (BWB) for participants who are not runners.
Studies of foot exercise tend to document recruitment but they do not document if the exercise results in a training effect (i.e. muscle hypertrophy, improved strength, or participant reported improvement in foot function) [4,6,16,17]. Studies document exercises that selectively activate foot muscles [1,18- 20]. Specifically, short foot exercises or “doming” [7,20-22], toe spreading [17], single leg standing trunk rotation [23] and tibialis posterior exercises [24,25] have demonstrated muscle recruitment specific to foot muscles. However, because foot intrinsic (i.e. abductor hallucis) and extrinsic muscles (i.e. tibialis posterior) are difficult to record from during exercise, studies document recruitment but not if recruitment is sufficient to achieve a training effect [13,26]. Training effects are typically observed when exercise intensity is sufficiently high, often 80% of one repetition maximum [27,28]. One study suggested that higher muscle intensity is achieved in individuals with FF when shod, raising the possibility that participants with FF may not respond similarly to controls when barefoot [25]. Therefore, data documenting a training effect in response to exercise in participants with FF are beneficial to understand
A. The potential effects on foot muscles
B. Whether FF posture influences these effects Current studies note
A. Greater foot muscle support in people with FF
B. Interdependence of foot and ankle function [6,16]
McPoil et al. [16] demonstrated greater flexibility of the foot in participants with FF. Angin et al. [6] suggested hypertrophy of foot muscles was associated with FF, theoretically to control the increased motion within the foot. Biomechanic studies using 3-D motion analysis support this explanation [29-34]. Threedimensional motion analysis studies during basic activities such as walking [29,34], heel rises [30,32], and step-ups [35], show that foot movement is important to heel rise height and ankle plantar flexion power. Specifically, two studies of heel rise performance [30,32] showed that first metatarsal plantar flexion accounted for approximately 40% of heel rise height and was decreased in participants with FF. Other biomechanic studies associate increased power within the foot with muscle control [35], supporting the study by Angin et al. [6] which emphasized the importance of foot muscle hypertrophy as a positive adaptation in participants with FF. Although unexplored in previous studies, there is support for improvement in heel rise performance (height and repetition) as a result of foot specific exercises.
Purpose
The purposes of this study were
A. To evaluate whether exercise and BWB activities lead to a training effect in foot muscle structure in participants with FF
B. To evaluate whether exercise and BWB activities improves foot and ankle function in participants with FF
C. To compare foot muscle structure and foot and ankle function between participants with FF to control participants with neutral foot posture prior to exercise.
The hypothesis for purpose #1 was that foot specific exercise and BWB would significantly increase:
A. Foot intrinsic muscle size and
B. Foot strength (paper grip test).
The hypothesis for purpose #2 was that foot specific exercise and BWB would significantly increase heel rise height and repetitions. The hypothesis for purpose #3 was that participants with FF and participants with neutral foot posture would be similar prior to exercise on measures of foot muscle structure and foot and ankle function. A secondary purpose was to assess if participants perceived a benefit of the foot specific exercise and BWB intervention using
A. Foot and Ankle Ability Measure (FAAM)
B. Qualitative data gathered in a subset of participants at the end of the exercise period.
Methods
Sample
A convenience sample of participants with FF and participants without FF were recruited via flyers and word of mouth. The general inclusion criteria were
18 to 60 years old,
1. No recent foot or lower extremity pain in the last 6 months,
2. No history of foot or ankle surgery,
3. Able to complete an exercise program 5 times a week.
Exclusion criteria:
1. Participants screened by the physical therapist for current foot disorders including problems such as hallux rigidis, bunions, and plantar fasciitis
2. Participants with musculoskeletal or nervous system injuries of either limb in the last 6 months;
3. Participants stating they have diabetes with neuropathy
4. Participants with a body mass index (BMI) greater than 40. Participants were screened for FF or neutral foot posture using the Foot Posture Index (FPI)[36,37].
The validated FPI categorizes participants into either a FF, neutral or supinated foot based on a 12-point scale. Scores from 7 to 12 indicate a FF (10 to 12 indicate extreme FF). The FPI is validated in large samples of participants against walking plantar pressure and clinical data [36,37]. All procedures were approved by the internal review board and informed consent was obtained from all participants.
Intervention
Participants with FF were instructed in a home exercise program and asked to weightbear without shoes for the 8-week study period (Appendix). The home exercise program included: short foot (foot doming), toe spreading, foot doming in standing with trunk rotation (progressed with resistance band applied to trunk rotation), and seated tibialis posterior exercise (progressed with heavier resistance band). Each exercise was shown to be effective at recruiting specific foot muscles in previous studies [17,21,23,24,38]. Participants received written (Appendix) and verbal instruction and demonstrated competency in performing the exercises at their initial session. Exercises were performed bilaterally with dosage set at 3 sets of 10 repetitions, 5 days per week for 8 weeks. Participants were also asked to spend 2 hours per day, 5 days a week in BWB. The 2 hour time frame was selected in an attempt to maximize the effect of weight bearing without compromising compliance. Barefoot weight bearing activities were considered any activity that required them to be full weight bearing barefoot, wearing socks or light-weight, indoor slippers that provided no arch support.
AppendixFoot exercises: Do 3 groups of 10 repetitions for each exercise.
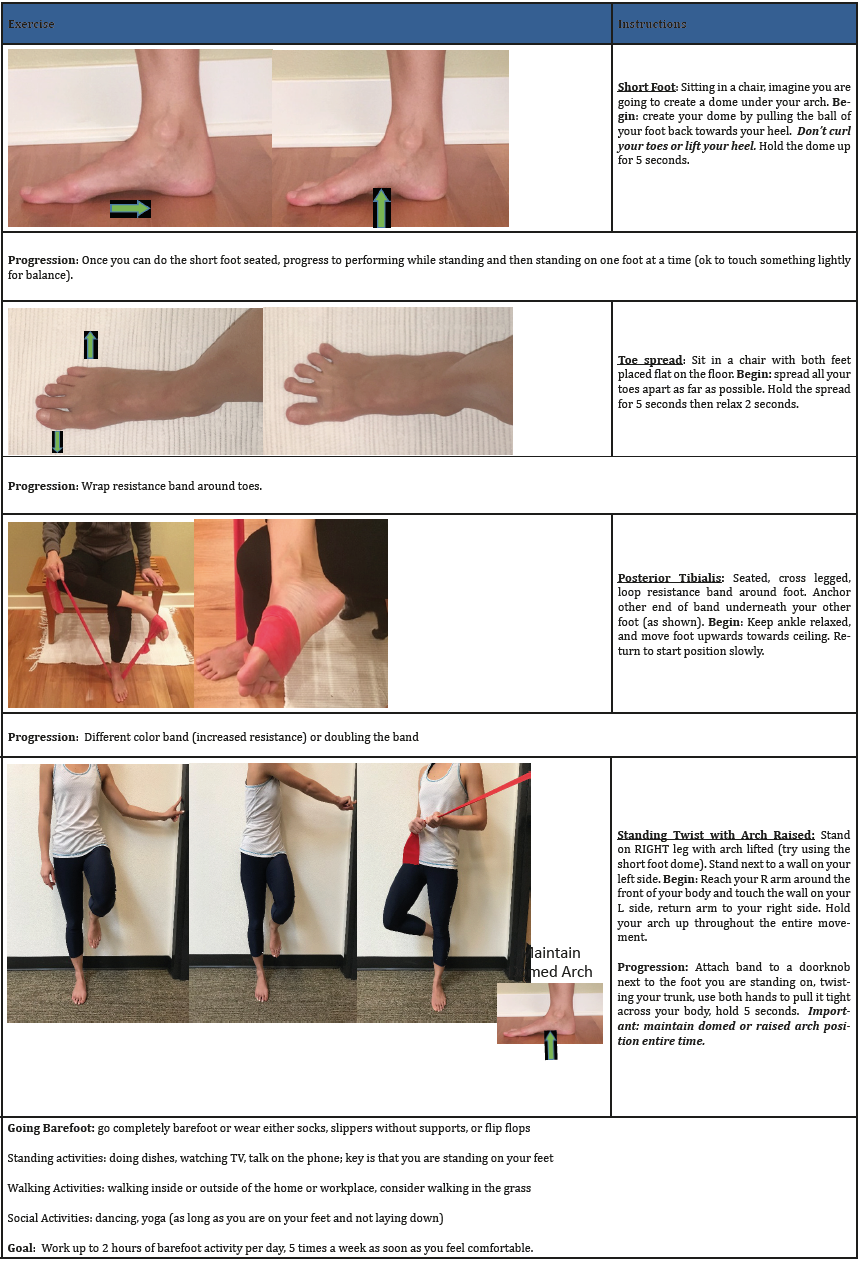
Weekly phone calls to participants monitored compliance and encouraged progression. If the participant reported that the exercises were becoming easier to perform then they were instructed to progress the intensity. The intensity was progressed by performing the exercises in standing (i.e. foot doming standing) or providing a band with greater stiffness. Participants were seen at 4 weeks (approximately a 15 to 30 minute session) to provide feedback on technique and to give advice for progression to a higher exercise intensity. On compliance logs, participants recorded the number of exercises performed and time spent in BWB activities on a daily basis. Compliance logs were reviewed at the week 4 progress visit and were then collected at completion of the study.
Outcomes
The participants with FF were tested twice (pre- and postexercise) and the control group once. All testing sessions included diagnostic ultrasound, paper grip test (PGT), heel rise ability (repetition and height), and FAAM. Qualitative data was collected in 13 participants at the post-exercise session. For all post-exercise tests, assessors were blind to pre-exercise data.
Diagnostic ultrasound
Diagnostic ultrasound is a validated approach to documenting changes in foot muscle CSA [6,39,40]. A diagnostic ultrasound unit (Philips Affinity model 50G, Phillips, Inc. N.V) with a 50 millimeter linear array probe was used to collect abductor hallucis CSA. Consistent with published data [6,39,40] the cross section of the abductor hallucis muscle was taken perpendicular to the anterior/ posterior axis of the foot just anterior to the medial malleolus. Studies note this is the thickest part of the abductor hallucis muscle and therefore may best relate to changes in muscle hypertrophy [6,39,40]. Images were imported into ImageJ (NIH ImageJ), the scale was calibrated for magnification, and the circumference of the muscle manually traced. Studies document high repeatability (Intraclass correlation>0.9) of abductor hallucis cross sections using this approach [39,40]. The estimated standard error of the measurement is reportedly 0.1cm2. Repeat testing, blinding assessors evaluating images (6 image pairs=2 images each side, n=3) in our lab resulted in errors of less than 0.08cm2. Anticipated increases in muscle CSA over an 8-week period is approximately 10% [27,28]. If the exercise intensity is sufficient, this corresponds to an expected increase of 0.21 to 0.24cm2, larger than twice the potential error.
Paper grip test
This study utilized the PGT that assesses first metatarsophalangeal joint (MTP) flexion strength. Although techniques to assess foot muscle strength [4,22] are evolving, this study used force during an established clinical test, the PGT [4,9]. The paper grip test asks participants to hold a piece of paper placed between the big toe and the floor while the examiner attempts to pull the paper out. Participants were seated in a chair with their backs touching the back of the chair, arms crossed over their chest, feet resting on the floor, and were required to keep their feet on the floor during the test. Participants sat with the pad of their big toe on an embedded force plate (AMTI, Watertown, MA). The sensitivity of the force plate was adjusted so that the range was 0 to 350N. The root mean square error was less than 2N at this setting. The sampling rate was 1000Hz. All participants conducted 1 practice trial followed by 3 maximum efforts. Post processing was conducted using Visual 3D software (C-Motion Inc, Germantown, MD) to display force data and determine peak force for each trial. The 2 peak efforts were averaged and used in the data analysis. Repeatability for the PGT is high (Intraclass correlation>0.9) resulting in an expected standard error of the measurement of less than 6N [4].
Heel rises
A standardized heel rise test is widely used to assess ankle plantar flexion function. Both the number of heel rises and height of the heel are considered important [30,41,42]. Participants were positioned facing a wall and were allowed to use fingertip pressure for balance. Participants were asked to rise up on their toes as high as they could and then hold it. Once stable, heel height was measured with a ruler to the nearest half centimeter. A metronome (rate 25beats/minute) was utilized to pace participants and count repetitions The test was stopped when participants were unable to keep pace with the metronome or heel height declined to less than 75% using the ruler as a guide. Similar methods have achieved high levels of repeatability in previous studies (Intraclass correlations>0.9) resulting in an expected error of 3 repetitions between trials [41].
Foot and ankle ability measure, qualitative data, and compliance
The FAAM and qualitative data were used to assess participant perceived benefit of the exercise and BWB activities [43]. Although the FAAM is validated in foot and ankle participants, it has not been used widely in asymptomatic participants. A possible ceiling effect was anticipated using the FAAM instrument. To gain an appreciation of participants’ perspective, responses of 13/20 participants to 2 questions were recorded and transcribed: “Did you feel there was a benefit from participating in the study?” and “Was the exercise routine reasonable?” Also, compliance with exercise was calculated as the percent of prescribed exercises performed
(exercise compliance=[number recorded /number prescribed ]×100).
Similarly, compliance with BWB activities was calculated as the percent of hours prescribed
(BWB activities compliance = [hours recorded /hours prescribed ]×100).
Statistical analysis
Sample size was partly determined by a power analysis of a previous sample of 12 participants with FF after a 4-week exercise program. Significant improvements in heel rise repetition (average increase 7±15 repetitions) demonstrated in this pilot sample were used to estimate sample size to detect changes in heel rise repetitions. To achieve 80 % power (alpha=0.05) with the observed standard deviation, a sample size of 17 participants was sufficient to find significance of 7 repetitions increase pre- to post-exercise. To detect differences in foot muscle, the length of the exercise period was 8 weeks. To detect a minimum increase of 10% (0.25±0.5cm2) in muscle CSA a sample size of 15 participants was needed. To account for drop-outs and unanticipated variation, a minimum recruitment goal of 20 participants completing the pre and postexercise testing was set.
Two analysis were performed: the first testing the difference at baseline between control participants (CP) and FF participants, and a second analysis comparing the pre-exercise to post-exercise values in FF participants. Independent t-tests were used for the first analysis comparing CP to FF participants. Two way repeated measures ANOVA models including side (right and left) and time (pre- and post-exercise) were used to evaluate differences before and after exercise. Pairwise comparisons are reported for all pre to post-exercise variables. For the PGT and muscle CSA, correlations with age, weight, height, and BMI were explored as normalizing variables. Consistent with a previous study [44], none showed a significant correlation (r>0.4) so there was no advantage to normalizing these variables. To judge the size of the effects due to exercise and BWB activities, Cohen’s effects size index (ESI) was calculated (mean change/post-exercise standard deviation). A 0.5 is equated to a medium effect and 0.8 or higher a large effect. Statistical software was used for all analysis (SPSS, version 25, Armonk, NY: IBM Corporation).
Qualitative analysis included analyzing the text recorded from the 2 questions for consistent themes. A table (Table 1) was constructed of the themes with quotes from participants coded according to theme.
Table 1:Comparison demographics, foot posture, and clinical measures prior to exercise between flatfoot participants and control participants.
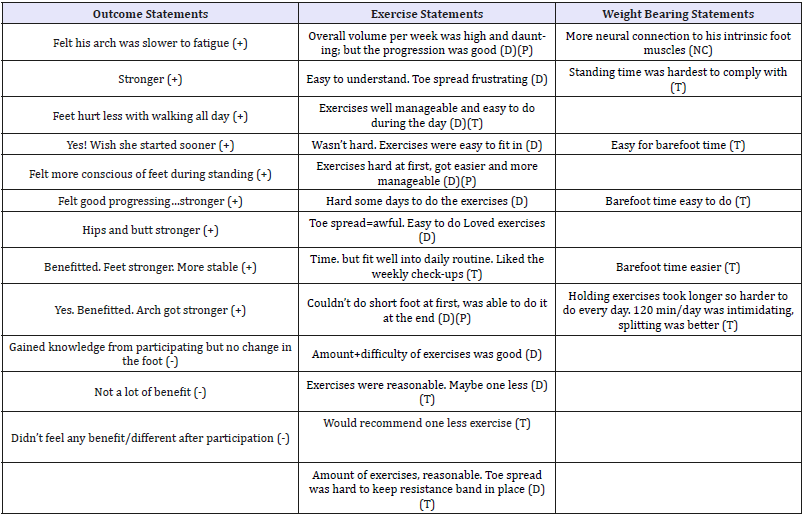
Outcome Statements: (+)=Positive, (-)=Neutral (grey cells)
Exercise Statements/Weightbearing Statements: (D)=Comments about difficulty, (P)=Noted progression, (T)=Noted time, (NC)=Not classified
Results
Pre-exercise comparison of flatfoot to control participants
A convenience sample of thirty-three participants, 23 with FF measured by the FPI (average=9.4±1.5, age=28.9±11.0) and 10 CPs with a normal foot (FPI average=4.6±1.5, age=29.8±7.8) participated. Three participants (13%) dropped out for unknown reasons leaving 20 participants who completed all testing. With the current sample size pre-exercise FF and CP were statistically similar on all variables except FPI and heel rise repetition (Table 2).
Table 2:Means and differences from pre- to post-exercise in participants with flatfoot.
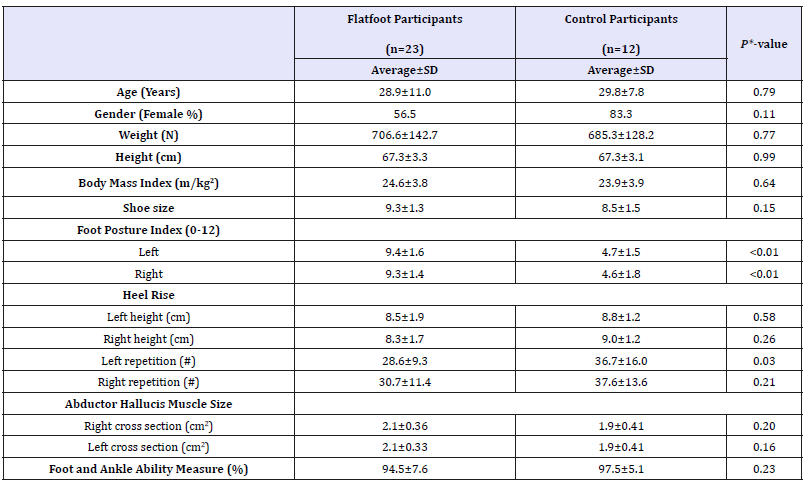
*Independent t-tests for parametric variables
Chi-square tests for non-parametric variables
SD: Standard Deviation
Improvements post-exercise in participants with flatfoot
Post-exercise FF participants significantly improved in all variables except the FAAM as compared to pre-exercise (Table 3). Heel rise height and repetition improved an average of 1.7 (P< 0.001) to 1.8cm (P< 0.001) (ESI=1.06-1.13) and 7.1 (P=0.002) to 7.6 repetitions (P=0.009) (ESI=0.40-61), respectively (Figure 1). The PGT indicated increased first MTP force post-exercise bilaterally by an average of 13.2 (P=0.007) to 13.7N (P=0.046) (ESI=0.62-0.68). Similarly, abductor hallucis muscle CSA significantly increased bilaterally. The average increases in CSA were 0.27 (P< 0.001) to 0.35cm2 ( P< 0.001) (ESI=0.87-1.13) constituting a 12.9 to 16.7% increase.
Figure 1:The average and standard deviation of heel rise repetition pre and post exercise and barefoot weight bearing in the flat foot and control participants.
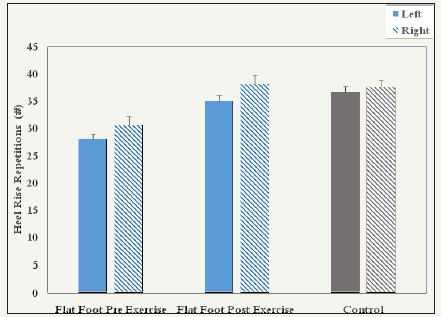
Table 3:Qualitative comments in participants with flatfoot.
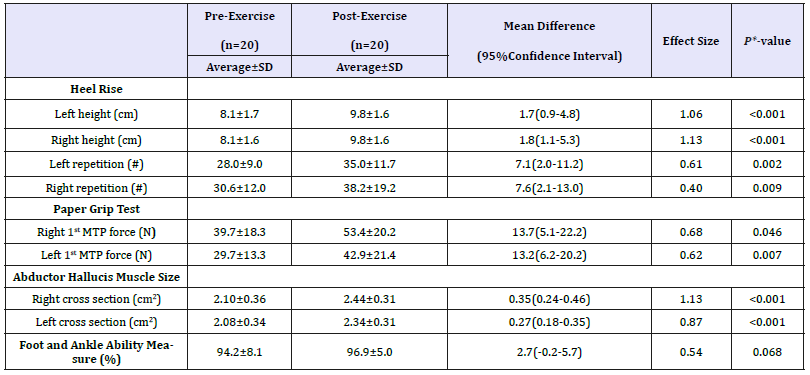
*P-values from pairwise comparisons of two-way ANOVA model SD: Standard Deviation
Foot and ankle ability measure, compliance, and qualitative data
The FAAM indicated a non-significant improvement (Table 3). Compliance logs indicated high participation: 87.7% completion of prescribed exercises and time BWB exceeded the prescribed time (111%). A total of 13 participants offered responses that were put into outcome, exercise, and weight bearing qualitative themes (Table 3). A total of 9/13 responses noted a positive outcome, 3/13 neutral outcome, and 1 didn’t respond. The positive benefits included “strength”, “balance”, “hurt less”, “[less] fatigue”, and awareness (i.e. “conscious of feet”). A total of 11/13 participants commented on difficulty (easy/hard) of exercises, 5/13 commented on exercise time, and 3/13 exercise progression (hard to easy). Only 5/13 participants commented on BWB activities and all comments were associated with time (easy to comply with time or hard to comply with time).
Discussion
This data supports the primary hypotheses that the exercise intensity is sufficient to induce a training effect in foot muscles in participants with FF. This improvement occurred despite the presence of FF posture. This is the first study of our knowledge to show that foot specific exercises have a significant influence on ankle plantar flexion function (i.e. increased heel rise repetition and height). However, as anticipated the FAAM showed a ceiling effect. Enthusiasm for the potential use of the exercises and BWB activities was supported by high compliance (88 to 111%) and positive qualitative data from a subset of participants (Table 1).
The sample is representative of participants with significant FF, that are young and of low BMI (Table 2). The average age was 29 years old with a range of 20 to 60 in the FF group. The average BMI of 23 to 25 suggests both groups are normal weight. However, the FPI (average=9.3/12) documents significant FF deformity in the FF group. A FPI score of 6-9 is associated with foot pronation and 10-12 is considered highly pronated [36,37]. A total of 12/20 (60%) participants were scored as highly pronated on the FPI. Large population based studies of the FPI in equivalent FF groups suggest that 7.4% have a similar highly pronated classification [37]. This level of FF deformity is associated with abnormal plantar pressure patterns [36,37] and injury [3]. At the pre-exercise testing, the FF group showed lower average heel rise height and repetition, however, only left side heel rise repetition was significant.
The significant increase of foot specific variables (abductor hallucis CSA and PGT force) validate that the dosage of exercises and BWB was sufficient to induce hypertrophy of foot muscles (Table 3). The 12.9% to 16.7% increase in abductor halluces muscle CSA and 34.5% to 44.4% increase in PGT force is consistent with muscle hypertrophy of multiple foot muscles (i.e. flexor halluces longus, flexor halluces brevis and abductor halluces) [27,28]. The gains occurred in spite of 60% of the participants having severe pronation and all intervention activities were performed without arch support [25]. This result suggests the increased loading due to exercise or regular intervals of BWB activities was above a training threshold (60 to 80% 1 repetition maximum) [4]. This finding is significant because it is difficult clinically to identify when patients are at a sufficient training intensity when customizing foot exercises and BWB activities. Specific for participants with FF, the benefits of abductor hallucis hypertrophy and increase in first MTP force may be increased support of the medial longitudinal arch in FF [6].
The significant increase in ankle planter flexion height and repetition may be a result of increased muscular support of the medial longitudinal arch (Table 3) [6,19]. Confidence in heel rise height and repetition measures derive from the fact that assessors were blind and the magnitude of the improvement is nearly doubles the expected repeatability errors [41]. In fact, the ESI reflect moderate to large effects (up to 1.1). Also, this interpretation is consistent with current 3-D motion analysis data supporting a link between foot and ankle biomechanic variables [30-33]. For example heel rise height is associated with arch raising [30]. And, power generation within the foot is associated with the increased arch height [33]. Both increased arch angle and power generation within the foot may occur as a result of improved foot muscle strength [29-33]. Future studies should consider examining whether exercise improves foot motion and power generation to confirm the effects of foot muscle hypertrophy on foot and ankle function and in patients with various foot conditions that may benefit from strengthening exercises (i.e. plantar fasciitis).
Data on the participants’ view of the exercise program show a majority of participants identify important benefits and that the exercise/BWB program is feasible. Despite a 2.7 point improvement, the FAAM demonstrated a ceiling effect given its pre-test score of 94.5%. However, in the qualitative analysis, participants perceived benefits of improved strength, balance, fatigability, less pain, and foot awareness. These benefits match identified problems experienced by participants with flatfoot deformity in other studies [5,9]. The qualitative comments also suggest that exercise should be tailored to a participants’ ability and time constraints (Table 1). The compliance data suggests (87.7 % exercises, 111% BWB activities) participants were successful in striking a balance between meeting their time constraints and performing the exercise and BWB activities. Overall, the compliance and qualitative data support that the exercise and BWB activities are likely to lead to a number of benefits, given the time and motivation to participate.
There are several significant limitations. This level 3, case control, study shows proof of concept. Future, higher level studies are needed to evaluate the effect of placebo and influence of symptoms on participant responses. This data is valuable as a confirmation of possible effect sizes and variables that might be explored in higher level studies. A follow-up time point would also be valuable to determine if there is retention of any of the observed benefits. Although the sample included participants with a wide range of ages, the average age is younger. In addition, the sample size was not powered to detect subtle differences at baseline between participants with neutral foot posture as compared to participants with FF postures. Variables such as heel rise repetition may be significant in a larger sample. For example, a power analysis suggests a sample of 25 per group (n=50) would be sufficient to define differences in heel rise repetition using the observed means and variance.
Conclusion
This study confirms that foot specific exercises achieve sufficient training intensity to strengthen foot muscles. The study also confirms that these training effects specific to the foot are achievable in participants with significant FF deformity. Qualitative data supports several possible benefits of the exercise program and noted high compliance over an 8-week period. An interesting finding is that ankle function improved without training of the calf muscle. Future studies should consider replicating this finding using additional measures of ankle function and a placebo control.
Acknowledgement
Shanna Howland, Tyler Whited, Brenden Thompson, Angela Foster, Alison Modafferi, Jean Phillipe Jarbath.
References
- Rabbito M, Pohl MB, Humble N, Ferber R (2011) Biomechanical and clinical factors related to stage I posterior tibial tendon dysfunction. J Orthop Sports Phys Ther 41(10): 776-784.
- Tong JWK, Kong PW (2013) Association between foot type and lower extremity injuries: systematic literature review with meta-analysis. J Orthop Sports Phys Ther 43(10): 700-714.
- Williams DS, McClay IS, Hamill J (2001) Arch structure and injury patterns in runners. Clin Biomech 16(4): 341-347.
- McClinton S, Collazo C, Vincent E, Vardaxis V (2016) Impaired foot plantar flexor muscle performance in individuals with plantar heel pain and association with foot orthosis use. J Orthop Sports Phys Ther 46(8): 681-688.
- Menz HB, Dufour AB, Riskowski JL, Hillstrom HJ, Hannan MT (2013) Association of planus foot posture and pronated foot function with foot pain: The Framingham foot study. Arthritis Care Res 65(12): 1991-1999.
- Angin S, Crofts G, Mickle KJ, Nester CJ (2016) Ultrasound evaluation of foot muscles and plantar fascia in pes planus. Gait Posture 40(1): 48-52.
- Mulligan EP, Cook PG (2013) Effect of plantar intrinsic muscle training on medial longitudinal arch morphology and dynamic function. Man Ther 18(5): 425-430.
- Neville C, Flemister AS, Houck JR (2010) Deep posterior compartment strength and foot kinematics in subjects with stage II posterior tibial tendon dysfunction. Foot Ankle Int 31(4): 320-328.
- Menz HB, Morris ME, Lord SR (2006) Foot and ankle risk factors for falls in older people: a prospective study. J Gerontol A Bio Sci Med Sci 61(8): 866-870.
- Rice HM, Jamison ST, Davis IS (2016) Footwear matters: influence of footwear and foot strike on load rates during running. Med Sci Sports Exerc 48(12): 2462-24681.
- Davis IS, Bowser BJ, Mullineaux DR (2016) Greater vertical impact loading in female runners with medically diagnosed injuries: a prospective investigation. Br J Sports Med 50(14): 887-892.
- Lieberman DE, Venkadesan M, Werbel WA, Daoud AI, D’Andrea S, et al. (2010) Foot strike patterns and collision forces in habitually barefoot versus shod runners. Nature 463(7280): 531-535.
- Franklin S, Grey MJ, Heneghan N, Bowen L, Li FX (2015) Barefoot vs common footwear: A systematic review of the kinematic, kinetic and muscle activity differences during walking. Gait Posture 42(3): 230-239.
- Almeida MO, Davis IS, Lopes AD (2015) Biomechanical differences of foot strike patterns during running: a systematic review with metaanalysis. J Orthop Sports Phys Ther 45(10): 738-755.
- Altman AR, Davis IS (2016) Prospective comparison of running injuries between shod and barefoot runners. Br J Sports Med 50(8): 476-480.
- McPoil TG, Vicenzino B, Cornwall MW, Collins N, Warren M (2009) Reliability and normative values for the foot mobility magnitude: a composite measure of vertical and medial-lateral mobility of the midfoot. J Foot Ankle Res 2: 6.
- Gooding TM, Feger MA, Hart JM, Hertel J (2016) Intrinsic foot muscle activation during specific exercises: A T2 time magnetic resonance imaging study. J Athl Train 51(8): 644-650.
- Fiolkowski P, Brunt D, Bishop M, Woo R, Horodyski M (2003) Intrinsic pedal musculature support of the medial longitudinal arch: an electromyography study. Journal Foot Ankle Surg 42(6): 327-333.
- Headlee DL, Leonard JL, Hart JM, Ingersoll CD, Hertel J (2008) Fatigue of the plantar intrinsic foot muscles increases navicular drop. J Electromyogr Kinesiol 18(3): 420-425.
- McKeon PO, Hertel J, Bramble D, Davis I (2015) The foot core system: a new paradigm for understanding intrinsic foot muscle function. Br J Sports Med 49(5): 290.
- Jung DY, Kim MH, Koh EK, Kwon OY, Cynn HS, et al. (2011) A comparison in the muscle activity of the abductor hallucis and the medial longitudinal arch angle during toe curl and short foot exercises. Phys Ther Sport 12(1): 30-35.
- Ridge ST, Myrer JW, Olsen MT, Jurgensmeier K, Johnson AW (2017) Reliability of doming and toe flexion testing to quantify foot muscle strength. J Foot Ankle Res 10(55): 1-7.
- Kelly LA, Kuitunen S, Racinais S, Cresswell AG (2012) Recruitment of the plantar intrinsic foot muscles with increasing postural demand. Clin Biomech 27(1): 46-51.
- Houck J, Neville C, Tome J, Flemister A (2015) Randomized controlled trial comparing orthosis augmented by either stretching or stretching and strengthening for stage II tibialis posterior tendon dysfunction. Foot Ankle Int 36(9): 1006-1016.
- Kulig K, Burnfield JM, Requejo SM, Sperry M, Terk M (2004) Selective activation of tibialis posterior: evaluation by magnetic Resonance Imaging. Med Science in Sports Exerc 36(5): 862-867.
- Soysa A, Hiller C, Refshauge K, Burns J (2012) Importance and challenges of measuring intrinsic foot muscle strength. J Foot Ankle Res 5(1): 29.
- Stevens JE, Pathare NC, Tillman SM,Scarborough MT, Gibbs CP, et al. (2006) Relative contributions of muscle activation and muscle size to plantarflexor torque during rehabilitation after immobilization. J Orthop Res 24(8): 1729-1736.
- Stevens JE, Walter GA, Okereke E, Scarborough MT, Esterhai JL, et al. (2004) Muscle adaptations with immobilization and rehabilitation after ankle fracture. Med Science Sports Exerc 36(10): 1695-1701.
- Barske H, Chimenti R, Tome J, Martin E, Flemister AS, et al. (2013) Clinical outcomes and static and dynamic assessment of foot posture after lateral column lengthening procedure. Foot Ankle Int 34(5): 673- 683.
- Chimenti RL, Tome J, Hillin CD, Flemister AS, Houck J (2014) Adultacquired flatfoot deformity and age-related differences in foot and ankle kinematics during the single-limb heel-rise test. J Orthop Sports Phys Ther 44(4): 283-290.
- Diliberto FE, Tome J, Baumhauer JF, Quinn JR, Houck J, et al. (2015) Multi-joint foot kinetics during walking in people with Diabetes Mellitus and peripheral neuropathy. J Biomech 48(13): 3679-3684.
- Houck J, Neville CG, Tome J, Flemister A (2009) Foot kinematics during a bilateral heel rise test in participants with stage II posterior tibial tendon dysfunction. J Orthop Sports Phys Ther 39(8): 593-603.
- Nawoczenski DA, Diliberto FE, Cantor MS, Tome JM, DiGiovanni BF (2016) Ankle power and endurance outcomes following isolated gastrocnemius recession for Achilles tendinopathy. Foot Ankle Int 37(7): 766-775.
- Tome J, Nawoczenski DA, Flemister A, Houck J (2006) Comparison of foot kinematics between subjects with posterior tibialis tendon dysfunction and healthy controls. J Orthop Sports Phys Ther 36(9): 635-644.
- DeLiberto F, Nawoczenski D, Houck J (2018) Ankle and midfoot power during walking and stair ascent in healthy adults. J Appl Biomech 27: 1-28.
- Redmond AC, Crane YZ, Menz HB (2008) Normative values for the foot posture index. J Foot Ankle Res 1(1): 6.
- Teyhen DS, Stoltenberg BE, Eckard TG, Doyle PM, Boland DM, et al. (2011) Static foot posture associated with dynamic plantar pressure parameters. J Orthop Sports Phys Ther 41(2): 100-107.
- Newsham KR (2010) Strengthening the intrinsic foot muscles. Human Kinetics J 15(1): 32-35.
- Crofts G, Angin S, Mickle KJ, Hill S, Nester CJ (2014) Reliability of ultrasound for measurement of selected foot structures. Gait Posture 39(1): 35-39.
- Mickle KJ, Nester CJ, Crofts G, Steele JR (2013) Reliability of ultrasound to measure morphology of the toe flexor muscles. J Foot Ankle Res 6(1): 12.
- Silbernagel KG, Helander NK, Thomeé R, Eriksson BI, Karlsson J (2010) A new measurement of heel-rise endurance with the ability to detect functional deficits in patients with achilles tendon rupture. Knee Surg Sports Traumatol Arthrosc 18(2):258-264.
- Silbernagel KG, Steele R, Manal K (2012) Deficits in heel-rise height and achilles tendon elongation occur in patients recovering from an achilles tendon rupture. Am J Sports Med 40(7): 1564-1571.
- Martin RLR, Irrgang JJJ, Burdett RG, Conti SF, Van Swearingen JM (2005) Evidence of validity for the foot and ankle ability measure (FAAM). Foot Ankle Int 26(11): 968-983.
- Mickle KJ, Angin S, Crofts G, Nester CJ (2016) Effects of age on strength and morphology of toe flexor muscles. J Orthop Sports Phys Ther 46(12): 1065-1070.
© 2018 Marcey Keefer Hutchison. This is an open access article distributed under the terms of the Creative Commons Attribution License , which permits unrestricted use, distribution, and build upon your work non-commercially.
 a Creative Commons Attribution 4.0 International License. Based on a work at www.crimsonpublishers.com.
Best viewed in


.jpg)


 Editorial Board Registrations
 Submit your Article
 Refer a Friend
 Advertise With Us
.jpg)


.jpg)


.bmp)
.jpg)
.png)
.jpg)


.jpg)


.png)

.png)


.png)


