- Submissions

Full Text
Orthopedic Research Online Journal
Frequency of Osteoporotic Fractures, Parameters of Bone Mineral Density and Trabecular Bone Score in Postmenopausal Women
Povoroznyuk V, Grygorieva N*, Orlyk T
SI Institute of Gerontology named after DF Chebotarev NAMS of Ukraine, Ukraine
*Corresponding author:Grygorieva N, SI Institute of Gerontology named after DF Chebotarev NAMS of Ukraine, Kiev, Ukraine
Submission: October 01, 2017:Published: November 13, 2017

ISSN: 2576-8875 Volume1 Issue3
Abstract
Osteoporosis is an important metabolic disease, which often manifests with low-trauma fractures and leads to reduced quality of life, an increase of morbidity, disability and mortality. Nowadays, dual energy X-ray absorptiometry (DXA) is a gold standard in diagnosis of osteoporosis. According to DXA, main quantitative characteristic of bone is bone mineral density (BMD), main qualitative parameter is trabecular bone score (TBS). The aim was to study frequency of osteoporotic fractures (OPF) in postmenopausal women depending on the age, BMD and TBS parameters. 1369 women ages between 45-89 years (mean age-62.5 years, the average duration of postmenopausal period 14.5±9.5 years) were examined.
Patients were divided into groups depending on BMD in accordance with the WHO criteria: normal bone (T- score >-1.0 SD; n=563), osteopenia≤-1.0 SD T- score ˃-2.5 SD; n=498), osteoporosis (T-score ≤ -2.5 SD; n=308), and depending on TBS (TBS L1-L4) into quartiles (groups): Q-I - lowest quartile (TBS = 0.362-1.077; n=152); Q-II - the lower quartile (TBS = 1.078-1.203; n = 156); Q-III the higher quartile (TBS=1.204-1.321; n=148); Q-IV - the highest quartile (TBS=1.322-1.793; n=133). BMD and TBS at lumbar spine (L1-L4) were measured using densitometer “Prodigy” (GE Medical systems, Lunar, model 8743, 2005). TBS was determined using the software “TBS Insight” (“Med-Imaps”, Bordeaux, France, 2006).
It was found that the OPF are present in all groups of women with different BMD parameters: osteoporosis -45.5%, osteopenia -26.9% and normal bone -18.1%. The highest frequency of OPF was observed in patients with osteoporosis (46.5%), and, predominantly, in persons with vertebral and combined fractures. Only 25.5% of patients with non-vertebral fractures have osteoporosis. Low TBS indices were observed in 50.8% patients with vertebral, 43.7% non-vertebral and 32.8% combined OPF (vertebral and non-vertebral). In conclusion, the presence of osteoporotic fractures is partly associated with age, BMD and TBS, however there are other significant factors, which have influence on fracture risk, and their combination requires further study.
Keywords: Osteoporosis; Osteoporotic fractures; Bone mineral density; Trabecular bone score; postmenopausal women
Abbreviations: DXA: Dual Energy X-Ray Absorptiometry; BMD: Bone Mineral Density; OPF: Osteoporotic Fractures; TBS : Trabecular Bone Score
Introduction
Osteoporosis is a tremendous medico-social problem in almost all industrialized countries [1, 2, 4]. Every year, up to 9 million new fractures caused by osteoporosis are expected [4]. The rate of mortality associated with fractures of the hip and spine can exceed 20% [4]. In the United States, osteoporosis affects 4 to 6 million postmenopausal women [12], about 2 million new fractures are registered each year. Approximately 10% of 50 year old women already have at least one osteoporotic fracture [1,17]. In Canada, osteoporosis develops in more than one of four women over 50 years [12]. Given the steady increase in life expectancy these figures projected to be doubled in the next 40 to 50 years [11].
Nowadays, dual-energy X-ray absorptiometry (DXA) is the gold standard for diagnosing osteoporosis and its indices (BMD and TBS) are the important parameters of bone density and micro architecture, although their connection with the fractures of different locations (vertebral or non-vertebral) continues to be studied. The aim of this study was to evaluate the frequency of osteoporotic fractures in postmenopausal women depending on BMD and TBS parameters.
Participants
1369 postmenopausal women aged 45-89 years (mean age -62.5 (55.0; 73.0) years, mean body mass index -28.6±6.5kg/m2, the average duration of postmenopausal period -14.5±9.5 years) were examined. We excluded the patients with severe concomitant diseases, high-energy fractures or trauma history, high levels of physical activity, secondary osteoporosis or conditions that could affect the bone, some significant disorders (connective tissue disease, neoplasms in history, taking corticosteroids, alcohol abuse and others), clinically manifested vertebral fractures with a duration of after-fracture period at least 6 months.
Patients were divided into groups according BMD and TBS indices. At first, they were divided depending on BMD parameters according to WHO criteria: normal bone (T-score>-1.0 SD), osteopenia (≤-1.0-T-score˃-2.5 SD) SD and osteoporosis (T-score≤-2.5 SD) [3,17]; examined women were divided into groups: First one (NB) -563 patients with BMD parameters within normal limits, second group (OPEN) -498 patients with osteopenia, third group (OP) -308 patients with osteoporosis, Subsequently, patients were divided depending on TBS. Nowadays, TBS has no standard indicators and in various countries, including Ukraine, studies to determine its reference indices are only in process [18]. Standard TBS, as well as for BMD, should be specific to definite geographic areas and ethnic groups. Therefore, this section describes a statistical approach that is used in cases of irregular quantitative values, namely Quartile distribution groups. Examined women were divided into groups (quartiles) in terms of TBS (TBS L1-L4): Q-I-the lowest quartile (TBS= 0.362-1.077; n= 152); Q-IIlower quartile (TBS= 1.078-1,203; n= 156); Q-III-upper quartile (TBS= 1,204-1,321; n= 148); Q-IV-the highest quartile (TBS= 1.322- 1.793; n= 133).
Methods
Presence, location, mechanism and timing of fracture were determined using specialized questionnaire about them, which was developed in Ukrainian Center of osteoporosis. In this study, we evaluated the frequency of vertebral, non-vertebral fractures (nonspine non-hip fractures: humerus, forearm, clavicle, ribs, pelvis, upper and lower extremity fractures) and combine fractures. Bone mineral density and TBS were measured at the lumbar spine (L1- L4) using dual energy X-ray “Prodigy” densitometer (GE Medical systems, Lunar, model 8743, 2005). Trabecular bone score was determined using “TBS Insight” software (“Med-Imaps”, Bordeaux, France; 2006). Statistical analysis was performed using “Statistisa 6.0” software packages, Copyright© StatSoft, Inc. 1984-2001, Serial number 31415926535897. The relative and absolute frequencies were studied by kinship tables. To evaluate the correlation between variables we used Spearman correlation analysis (R). The critical level of significance was p<0.05.
Results
Table 1:Risk (odd ratio) of fractures in postmenopausal women depending on age.

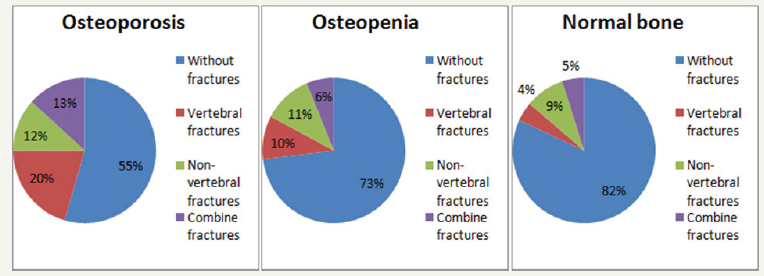
Figure 1:Proportion of different fractures in women of older age groups depending on the bone mineral density.

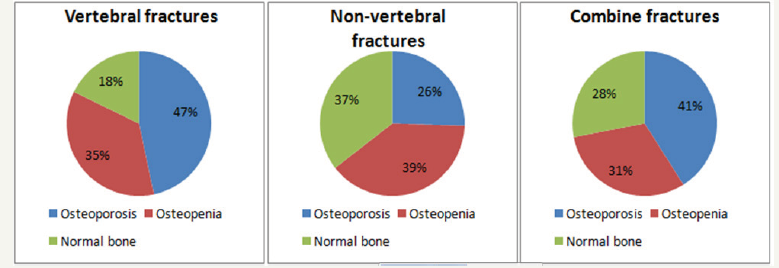
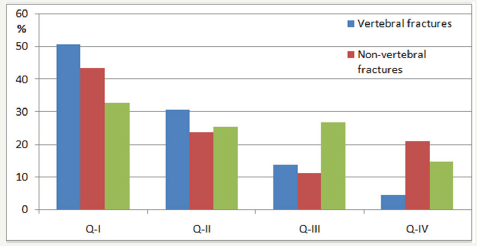
According to our results, the age is the significant risk factor for all osteoporotic fractures. The odd ratio to have fractures in women depending on age significant increased for all types of fractures. Thus, the risk of having vertebral fractures with age increased 1.97- 4.26 times, non-vertebral fractures -1.96-5.45 times, combined fractures -1.54-3.14 times (Table 1). Moreover, it was found the osteoporotic fractures in all groups of women with different BMD data: osteoporosis -45.5% (140), osteopenia -26.9% (134) and normal -18.1% (102 women). Moreover, the frequency of nonvertebral fractures was not significantly different in women with osteoporosis (11.7%), osteopenia (11.0%) and normal BMD (9.8%). Significant differences (χ2 = 95.66, p < 0.0001) were observed due to vertebral fractures (OP-group -20.5%, OPEN-group -9.6% and NB-group -4.3% had fractures) and combine fractures (OP-group -13.3%, OPEN-group -6.% and NB-group -5.0% had fractures). The frequency of combine fractures (vertebral and non-vertebral) in OPEN-group and NB-group did not significantly differ (Figure 1). Among 135 patients with vertebral fractures, proportion of patients with osteoporosis (46.6%) was significantly higher compared to those with normal BMD (p = 0.02). Additionally, 53.4% of women who had vertebral fractures had normal BMD parameters (17.8%) or osteopenic syndrome (35.6%). Patients with osteoporosis amounted approximately a quarter (25.5%) among 141 women who had non-vertebral fractures (OPEN-group -39.0%, NB-group -35.5%). The proportion of patients with osteoporosis who had combine (vertebral and non-vertabral) fractures was 41.0% and was not significantly different from rates of patients with osteopenia (31.0%) and normal BMD (28.0%) (Figure 2). The next step was to study the characteristics of fractures in women depending on the other parameter of bone TBS. When the frequency of various types of fractures was analyzed (vertebral, non-vertebral or combine) it was found that despite the lowest TBS (Q-I) only 50.8% of vertebral fractures, 43.7% of non-vertebral fractures and 32.8% of fractures of combined fracture were developing (Figure 3). We also found the significant correlation between TBS and age (highest in NB-group: OP group -0.26 (p< 0.05); OPEN-group -0.33 (p< 0.05); NB-group -0.43 (p< 0.05)), presence of fractures (highest in OPEN-group: OP group -0.23 (p< 0.05); OPEN-group -0.32 (p< 0.05); NB-group -0.16 (p< 0.05)), and bone of mineral density (only in OPEN-group: 0.23 (p< 0.05)). Additionally, the results of correlation analysis showed the significant association between the presence of any fracture and age (R= 0.21), BMD (R= -0.28) and TBS (R= -0.26).
Figure 2:Proportion of patients with different bone mineral density according the fracture localization.

Figure 3:The frequency of different fractures in postmenopausal women according trabecular bone score. We also found the significant correlation between TBS and age (highest in NB-group: OP group – -0.26 (p< 0.05); OPEN-group – -0.33 (p< 0.05); NBgroup – -0.43 (p< 0.05)), presence of fractures (highest in OPEN-group: OP group – -0.23 (p< 0.05); OPEN-group – -0.32 (p< 0.05); NB-group – -0.16 (p< 0.05)), and bone of mineral density (only in OPEN-group: 0.23 (p< 0.05)). Additionally, the results of correlation analysis showed the significant association between the presence of any fracture and age (R=0.21), BMD (R=-0.28) and TBS (R=-0.26).

Discussion
Osteoporosis is an important skeletal disease characterized by low bone mass and micro architectural deterioration of bone with increased bone fragility and risk of fractures [1-3,17]. Vertebral and non-vertebral fractures (hip, vertebral body, proximal humerus, and distal forearm etc.) are the clinical consequence of osteoporosis and are major cause of morbidity and mortality especially in older patients.
Nowadays, the DXA with measurement of BMD is the standard method of diagnosis of osteoporosis in the absence of established osteoporotic fractures [4]. BMD is one of the main factors that determine bone strength and fracture risk [10], but there is a significant overlap of BMD indices among people with and without fractures [7].
There are many other factors that have influence on bone strength and fracture risk, such macro- and micro architecture of bone, micro damages presence, mineralization of bone matrix and remodeling speed [13-20]. In recent years, numbers of new methods to assess bone micro architecture were developed. Among non-invasive methods, which significantly improve imaging, technologies are quantitative (peripheral) computed tomography (pQCT, QCT) and magnetic resonance imaging (MRI), which allow the direct measurement of bone micro architecture [17]. However, both methods are impractical for routine screening and monitoring of treatment [6].
According to DXA, the main quantitative characteristic of bone is BMD, the main qualitative parameter trabecular bone score (TBS). It is known that both indices are decreasing with age, worsening the state of bone. The trabecular bone score is a new parameter that is determined from gray-level analysis of DXA images [7-9,14-16]. It relies on the mean thickness and volume fraction of trabecular bone micro architecture. Significant correlations between TBS and 3D-parameters of bone micro architecture in corpses were found early. The largest correlation was between TBS and the density of connections that explained 67.2% variance. Higher TBS values reflected better bone strength characteristics, while lower values showed “weakness” of bone and susceptibility to fractures [7,16]. TBS may be determined retrospectively based on the DXA images made in advance without the need for any additional studies. Moreover, the rate can be compared to BMD as it determines bone state in the same region. A number of informative studies on simultaneous use of TBS and BMD were conducted [13-20]. It was proved that in postmenopausal women who had a history of fractures, the value of index is less than in individuals of appropriate age without fractures [14-19].
The aim of this study was to evaluate the frequency of osteoporotic fractures in postmenopausal women depending BMD and TBS parameters. Our results show that age is the significant risk factor for all osteoporotic fractures. The risk to have a fracture in women significant increases for all types of fractures (for vertebral fractures in 1.97-4.26 times, non-vertebral fractures -1.96-5.45 times, combined fractures -1.54-3.14 times).
In addition, it was found, that the osteoporotic fractures are present in all examined groups of women with different BMD indices: osteoporosis -45.5%, osteopenia -26.9% and normal bone -18.1%. Moreover, the frequency of non-vertebral fractures was not significantly different in women with osteoporosis (11.7%), osteopenia (11.0%) and normal BMD (9.8%). Significant differences (χ2 = 95.66, p < 0.0001) were observed due to vertebral fractures (OP-group -20.5%, OPEN-group -9.6% and NB-group -4.3% had fractures) and combine fractures (OP-group -13.3%, OPEN-group -6.2% and NB-group -5.0% had fractures).
Among patients with vertebral fractures, proportion of patients with osteoporosis (46.6%) was significantly higher compared to those with normal BMD (p= 0.02). Additionally, 53.4% of women who had vertebral fractures had normal BMD parameters (17.8%) or osteopenic syndrome (35.6%). It was found that patients with osteoporosis amounted approximately a quarter (25.5%) among women who had non-vertebral fractures (OPEN-group -39.0%, NB-group -35.5%). Moreover, the proportion of patients with osteoporosis who had combine (vertebral and non-vertebral) fractures was 41.0% and was not significantly different from rates of patients with osteopenia (31.0%) and normal BMD (28.0%).
Assessment of fracture types (vertebral, non-vertebral or combine) in women depending on TBS showed that despite the lowest TBS (Q-I) only 50.8% of vertebral fractures, 43.7% of nonvertebral fractures and 32.8% of fractures of combined fracture were developing. We also found the significant correlation between TBS and age (highest in NB-group), presence of fractures (highest in OPEN-group) and bone of mineral density (only in OPEN-group). Data of Manitoba study with participation of 29407 women 50 years of age or older also assessed the incidence of non-traumatic osteoporotic fracture according BMD and TBS indices (mean follow-up 4.7 years).
Osteoporotic fractures were identified in 5.7% women, including 1.5% spine and 1.0% hip fractures. Significantly lower spine TBS and BMD were identified in women with major osteoporotic, spine, and hip fractures (all p< 0.0001). Spine TBS and BMD predicted fractures equally well, and the combination was superior to either measurement alone (p< 0.001). Spine TBS predicts osteoporotic fractures and provides information that is independent of spine and hip BMD. Combining the TBS index with BMD incrementally improved fracture prediction in postmenopausal women. Multiple linear regression and logistic regression (lowest vs highest tertile) was used to define the sensitivity of TBS to other risk factors associated with osteoporosis. Only a small component of the TBS measurement (7-11%) could be explained from BMD measurements. In multiple linear regression and logistic regression models, reduced lumbar spine TBS was associated with recent glucocorticoid use, prior major fracture, rheumatoid arthritis, chronic obstructive pulmonary disease, high alcohol intake, and higher body mass index. In contrast, recent osteoporosis therapy was associated with a significantly lower likelihood for reduced TBS [8].
Conclusion
Our study showed the highest frequency of osteoporotic fractures in patients with osteoporosis (45.5%), which includes postmenopausal women with vertebral fractures and combine fractures. The proportion of patients with osteoporosis among those with non-vertebral fractures was 25.5%. Moreover, 50.8% of vertebral, 43.7% of non-vertebral and 32.8% of combine fracture occur on a background of poor quality of trabecular bone. The presence of low-trauma fractures is partly associated with age; bone mineral density and trabecular bone score, however there are other significant factors, which have influence on fracture risk. The future studies of combine measure BMD, TBS in combination with other risk factors are needed.
References
- Burge R, Dawson HB, Solomon DH, Wong JB, King A, et al. (2007) Incidence and economic burden of osteoporosis-related fractures in the United States 2005-2025. J Bone Miner Res 22(3): 465-475.
- Curtis EM, Moon RJ, Harvey NC, Cooper C (2017) Reprint of: The impact of fragility fracture and approaches to osteoporosis risk assessment worldwide. Int J Orthop Trauma Nurs 26: 7-17.
- Czerwinski E, Badurski JE, Marcinowska SE, Osieleniac J (2007) Current understanding of osteoporosis according to the position of the World Health Organization (WHO) and International Osteoporosis Foundation. Ortop Traumatol Rehabil 9(4): 337-356
- Davies KM, Stegman MR, Heaney RP, Recker RR (2005) Prevalence and severity of vertebral fracture: the Saunders County Bone Quality Study. Osteoporos Int 6(2): 160-165.
- Fischer S, Kapinos KA, Mulcahy A, Pinto L, Hayden O, et al. (2017) Estimating the long-term functional burden of osteoporosis-related fractures. Osteoporos Int.
- Griffith JF, Engelke K, Genant HK (2010) Looking Beyond bone mineral density: imaging assessment of bone quality. Ann N Y Acad Sci 1192: 45-56.
- Hans D, Barthe N, Boutroy S, Pothuaud L, Winzenrieth R, et al. (2011) Correlations between TBS, measured using antero-posterior DXA acquisition, and 3D parameters of bone micro-architecture: an experimental study on human cadavre vertebrae. J Clin Densitom 14(3): 302-312.
- Hans D, Goertzen AL, Krieg MA, Leslie WD (2011) Bone microarchitecture assessed by TBS predicts osteoporotic fractures independent of bone density: the Manitoba study. J Bone Miner Res 26(11): 2762-2769.
- Harvey NC, Glüer CC, Binkley N, McCloskey EV, Brandi ML, et al. (2015) Trabecular bone score (TBS) as a new complementary approach for osteoporosis evaluation in clinical practice. Bone 78: 216-224.
- Johnell O, Kanis JA, Oden, Johansson H, De Laet C, et al. (2005) Predictive value of BMD for hip and other fractures. J Bone Miner Res 20(7): 1185- 1194.
- Johnnell O, Kanis JA (2006) An estimate of the worldwide prevalence and disability associated with osteoporotic fractures. Osteoporos Int 17(12): 1726-1733.
- Leslie WD, Lix LM, Langsetmo L, Berger C, Goltzman D, et al. (2011) Construction of a FRAX® model for the assessment of fracture probability in Canada and implications for treatment. Osteoporos Int 22(3): 817-827.
- Leslie WD, Pahlavan PS, Tsang JF, Lix LM (2009) Prediction of hip and other osteoporotic fractures from hip geometry in a large clinical cohort. Osteoporos Int 20(10): 1767-1774.
- Hans D, Goertzen AL, Krieg MA, Leslie WD (2011) Bone microarchitecture assessed by TBS predicts osteoporotic fractures independent of bone density: the Manitoba study. J Bone Miner Res 26(11): 2762-2769.
- Mei HC, Tzyy LC, Malcolm K, Yuh FW (2017) Trabecular Bone Score Reflects Trabecular Microarchitecture Deterioration and Fragility Fracture in Female Adult Patients Receiving Glucocorticoid Therapy: A Pre-Post Controlled Study. Biomed Res Int 4210217.
- Pothuaud L, Barthe N, Krieg MA, Mehsen N, Carceller P, et al. (2009) Evaluation of the potential use of trabecular bone score to complement bone mineral density in the diagnosis of osteoporosis: a preliminary spine BMD-matched, case-control study. J Clin Densitom 12(2): 170-176.
- Povorozyuk VV, Grygorieva NV, Orlyk TV et al. (2014) Osteoporosis in the practice of an internist-doctor. Kyiv, p. 198 [Russian].
- Povoroznyuk VV, Dzerovich NI, Orlyk TV (2014) Trabecular Bone Score in Clinical Practice: Review of Literature and Results of Own Research. Problem of osteology 17 (2): 3-13.
- Rabier B, Héraud A, Grand-Lenoir C, Winzenrieth R, Hans D (2010) A multicentre, retrospective case-control study assessing the role of trabecular bone score (TBS) in menopausal Caucasian women with low areal bone mineral density (BMDa): Analysing the odds of vertebral fracture. Bone 46 (1): 176-181.
- Rubin CD (2005) Emerging concepts in osteoporosis and bone strength. Curr Med Res Opin 21(7): 1049-1056.
© 2018 Grygorieva N. This is an open access article distributed under the terms of the Creative Commons Attribution License , which permits unrestricted use, distribution, and build upon your work non-commercially.
 a Creative Commons Attribution 4.0 International License. Based on a work at www.crimsonpublishers.com.
Best viewed in


.jpg)


 Editorial Board Registrations
 Submit your Article
 Refer a Friend
 Advertise With Us
.jpg)


.jpg)


.bmp)
.jpg)
.png)
.jpg)


.jpg)


.png)

.png)


.png)


