
- About Us
- Information
-

The Author ensures that the research has been conducted responsibly and ethically with adherence to all relevant regulations. read more..
- For Authors
- For Reviewer
- Manuscript Guidelines
- Membership
- Publication Ethics
-
- Journals
- Reprints
- e-Books
- Videos
- Policies
- Contact Us
 COVID-19
- Submissions


Full Text
Open Journal of Cardiology & Heart Diseases
Optimization of Algorithms for Real-Time ECG Beats Classification
Rolando González T* and Maité Cañizares F
ICID-Digital Medical Technologies, Cuba
*Corresponding author: Rolando González Tejeda, ICID-Digital Medical Technologies, Havana, Cuba
Submission: July 10, 2018;;Published: November 26, 2018

ISSN 2578-0204Volume2 Issue5
Abstract
Beats classification is an essential step in the ECG signal analysis for cardiac arrhythmias detection. There are multiple alternatives to solve this problem, but these are considerably reduced when re-al-time restrictions are added to the analysis. The goal of this work is to expose an optimal solution based mainly on the use of voltage values of the signal in the time domain and compare it with other based on Daubechies’ Wavelets analysis. Several measures are used in both feature spaces to determine the similarity of every beat to a patient’s specific patterns and, after that, a method similar to clustering’s algorithms is used to assign a class to each. To evaluate the performance of the pro-posed algorithms, ECG signal records extracted from the MIT-BIH data-base are used. With the method used in the analysis, we obtained 93.25% of sensitivity and 91.43% on premature ventricular contractions predictivity, which allow us to conclude that it is very feasible for their application in real time systems, due to their low computational cost.
Keywords: ECG; Beat classification; Real time; Cluster
Introduction
Cardiovascular diseases are among the main causes of mortality in the world. It has been shown that 90 to 95 percent of patients with acute myocardial infarction have an associated cardiac arrhythmia [1]. Some of the most common arrhythmias, which may warn of the possible occurrence of acute myocardial infarction, are those associated with the presence of premature ventricular contractions. Therefore, the early detection of this type of beat has great importance.
From the observation of the patient’s electrocardiographic (ECG) signal, it can be determined if arrhythmias are present or not. That’s why, the use of computational tools that automate this signal monitoring, is essential for this purpose and have great boom in recent times. If, in addition, the processing is done in real time, quick assistance and decision-making to protect the patient’s life is guaranteed.
Before classifying the beats, the execution of two phases in the ECG analysis is re-quired. The first phase is the pre-processing of the signal. This consists mainly of the application of filters in order to eliminate noise from it. The second phase is the QRS complex detection, where the information necessary to compare the beat is found. Starting from the information obtained from these phases, several methods are used for the classification of beats. Some use supervised learning techniques [2]; that base their operation on the extraction of the distinctive features of a particular type of beat from the training with records of ECG signal. Other methods consist of unsupervised learning such as K means or Hierarchical clustering [3,4] which group beats with similar patterns. Algorithms based on Hidden Markov Model [5] have also been used because the order and existence of P, Q, R, S and T waves can be determinant in beat’s classification. Similarly, principal component analysis (PCA) [4] has been used to reduce the dimensions of the ECG signal feature vector, in order to find the most relevant. Recently, the use of wavelets to represent signals has become very frequent because of its good results in similar problems, and because it has implicit noise reduction.
Due to the high computational cost, many of these algorithms, like the case of PCA, are discarded. Others, such as K means or Hierarchical clusters, cannot be ap-plied in the way they were originally conceived, since they require the entire dataset for the clustering and the aim of this work is to perform the classification in real time.
Materials and Methods
Pre-processing and QRS complex detection
Pre-processing consists mainly in the reduction of the noise present in the ECG signal. The interference of the power line with a frequency of 60Hz is eliminated using a second order Notch filter. The noise coming from the movement and bad contact of the electrodes for different causes is eliminated using a third order Butterworth filter.
In this work, the article Pan & Tompkins [6] was used for the QRS complex detection. After filtering, the signal is differentiated to provide the QRS complex slope information. We use a five-point derivative (1). Later the signal is squared point by point. This make all data points positive and does nonlinear amplification of the out-put of derivative emphasizing the higher frequencies. Finally, the last N values obtained corresponding to 150ms are taken to calculate the moving-window integration (2). The QRS complex is detected when the integration waveform exceeds a threshold
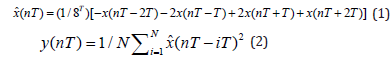
where T is the sampling period and N is the number of samples in the width of integration window.
Discrete wavelet transforms
Wavelets are considered a time-frequency representation of a function. From the projection of the signal in translations and expansions of functions called mother wavelets and scaling wavelets, a decomposition of the signal in several coefficients is obtained. These give a measure of the energy value of a frequency band in a time interval. For practical applications, the Discrete Wavelet Transform (DWT) is used, which consists in using a discrete set of wavelets depending on the values of scale and translation.
Features extraction
Detection of referents peaks within the QRS complex: The features will be extracted from the knowledge of R peak position or another peak (Q or S wave) within the QRS complex that will take as a reference if R peak is not present. One case that involves a complication is when there is an R’ wave. In this case, R’ becomes a candidate to be recognized by the algorithm implemented as R. (Figure 1) shows several cases that complicate the easy detection of the R wave. Therefore, for each QRS complex, several peaks (at most 3) are calculated, which are candidates for reference. To calculate them, the following is done:
Figure 1:Cases where reference point detection is complex.

Figure 2:a) Different waveforms. b) DWTHaar3 function response.

A. The detail coefficients of the Haar wavelets are calculated at scale level 3 [7], let’s call it DWTHaar3. In (Figure 2) it is clearly seen how the positive maximums in the DWTHaar3 correspond to the descending portion in the ECG signal and the negative minimums to the ascending one.
B. Within QRS time interval, the pair of local extrema (Max and Min) whit greatest sum of absolute values is searched in DWTHaar3. Between both extrema there will be a peak P1 in the ECG signal that must correspond to the zero crossing of the DWTHaar3. If the 1st extremum is a maximum then P1 is a local maximum, otherwise it is a local minimum.
C. If adjacent to Max there is another local minimum Min’ with an approximate value to Min then between Max and Min’ there is another candidate peak P2 to be reference. In case there is a local maximum Max’ adjacent to Min, same analysis is done to know if there is a 3rd peak P3 between Min and Max’. Features: In this work we compare the results obtained from two feature spaces. The 1st are the values of the ECG signal in the interval [Pn-N, Pn + N], where Pn is the reference point of the QRS complex. The 2nd are the coefficients of the second order Daubechies wavelets associated with the time interval [Pn-N, Pn + N]. The frequency bands corresponding to different decomposition levels of these wavelets with sampling frequency of 256Hz are [8]: D1 (37.5-75Hz); D2 (18.75-37.5Hz); D3 (9.375-18.75Hz); D4(4.6875- 9.37Hz); A4 (0-4.6875Hz). Coefficients of the levels A4, D4 and D3 are chosen because they contain the main frequency bands of QRS waves.
Clustering
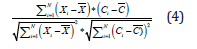
To measure the distance from a beat to the centroid of a cluster, the following measures are used [4]:
a) Cityblock

b) Correlation
The clustering stage consists of grouping the beats with similar features. When a beat is detected, it is compared to all clusters, which contain the different beat patterns of a patient. If there is no pattern similar to the beat in question, or if it is the 1st beat to be analyzed, then a new cluster is added with that beat as the only element. For this cluster, the reference point (Prc) is set as follows:
a) If there is only one candidate to reference point, it is chosen.
b) If there are 2, the one between the pair of local maxima in DWTHaar3 with greatest sum of absolute values is selected. This is because the absolute value of the DWTHaar3 reaches its maximum when the slope has a greater inclination.
c) If there are 3, the center peak is chosen.
To determine the similarity of a beat with a cluster one of the measures mentioned above is used. If its value exceeds a predefined threshold, then it is determined that the beat belongs to the cluster. The reference point of the analyzed beat is selected according to the features of cluster reference point. If it is a local minimum, the reference point in the beat will be a local minimum too, else it will be the local maximum. If there are two local minima or two local maxima like Prc, then the one with highest absolute value is chosen.
i. The clusters that have a high similarity with the current beat join in a single cluster.
ii. To calculate the centroid of this, the features vectors of all its beats are averaged.
Classification
In this work three classifications are defined for the beats: N, PVC and Q. N are the normal beats, PVC are the premature ventricular contractions, and Q are those that cannot be classified. Every cluster has associated one of this classes. Cluster containing the highest number of beats is classified as N and the rest are classified as PVC. If there are more than one cluster with the highest number of beats (e.g. when there is bigeminy, where the PVC occurs with the same frequency as normal beat), class N is given to the cluster that represents the beats with the lowest QRS width. When two or more clusters are joined, and one of them is of class N, then the resultant cluster also takes class N. A beat takes the class of the cluster to which it belongs. If it does not belong to any then it is classified as Q.
Results
The Massachusetts Institute of Technology (MIT) has available databases of ECG signals for public use. 32 records of this database were chosen. These were acquired through two channels, with a sampling frequency of 360Hz. Each record contains annotations made by specialized doctors, where they specify the classification of the beats.
To evaluate the results of the classification with this database, measures of sensitivity (5) and positive predictivity (6) were used, defined as:
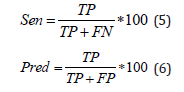
TP: True Positive. A beat is correctly classified.
FN: False Negative. A beat is classified by the algorithm as negative, however, it is positive.
FP: False Positive. A beat is classified by the algorithm as positive, however, it is negative.
Table 1 show the results obtained with the different spaces of features and measures used. As observed, the best results were obtained using Daubechies wavelets with the correlation measure (Table 1).
Table 1:Results obtained with different algorithms.

Conclusion
In this paper we present a solution to the problem of classifying ECG beats in real time. The methods that gave the best results were those using the Daubechies wave-lets with the correlation measure with 93.25% sensitivity and 91.43% positive predictivity. The algorithm described has a low computational cost. The application of the filters and the calculation of the DWTHaar3 require a constant number of steps for each voltage value of the ECG signal. The maximum and minimum of the DWTHaar3 is stored in memory, which also makes constant the number of operations for peaks’ selection. Calculate the cityblock and correlation measures is linear with respect to the 60-points time window centered in the reference point. Wavelets’ calculation is also linear. The classification, deciding which cluster is more correlated with the analyzed beat, has a constant cost. The implementation of this algorithm is being used in a patient’s monitor based on the ARM9 architecture without problems.
Conflict of Interest
The authors declare that they have no conflict of interest.
References
- Chuang CC, Tong HL, Ben YL (2005) Using correlation coefficient in ECG waveform for arrhythmia detection. Biomedical Engineering Applications, Basis & Communications 17(3): 147-152.
- Gaurav KJ, Ranbir P (2014) ECG Classification with the help of neural network. International Journal of Electrical and Electronics Research 2: 42-46.
- Ordoñez DHP (2009) Estudio comparativo de métodos de agrupamiento no supervise do de latidos de señales ECG. Master’s Thesis, National University of Colombia, Manizales, USA.
- Micó P (2005) Nuevos desarrollos y aplicaciones basados en métodos estocásticos para el agrupamiento no supervisado de latidos en señales electrocardiográficas. Doctoral Thesis, Polytechnic University of Valencia, Valencia, Spain.
- Andreao R, Dorizzi B, Boudy J (2006) ECG signal analysis through hidden Markov models. IEEE Transactions on Biomedical Engineering 53(8): 1541-1549.
- Pan J, Tompkins WJ (1985) A real time QRS detection algorithm. IEEE Transactions on Biomedical Engineering 32(3): 230-236.
- Bensegueni S, Bennia A (2015) R Peak detection using wavelet transforms technique. UPB (77): 135-148.
- Cvetkovic D, Übeyli ED, Cosic I (2008) Wavelet transform feature extraction from human PPG, ECG, and EEG signal responses to ELF PEMF exposures: A pilot study. Digital Signal Processing 18(5): 861-874.
© 2018 Rolando González T. This is an open access article distributed under the terms of the Creative Commons Attribution License , which permits unrestricted use, distribution, and build upon your work non-commercially.
Editor In Chief


.jpg)


Signup for Newsletter

Quick Links
 Editorial Board Registrations
 Submit your Article
 Refer a Friend
 Advertise With Us
Our Recent Edition

.jpg)


Top Editors


.jpg)


.bmp)
.jpg)
.png)
.jpg)


.jpg)


.png)

.png)


.png)


Financial Support

Sponsors

Latest e-Books

Latest Video

 a Creative Commons Attribution 4.0 International License. Based on a work at www.crimsonpublishers.com.
Best viewed in
a Creative Commons Attribution 4.0 International License. Based on a work at www.crimsonpublishers.com.
Best viewed in