
- About Us
- Information
-

The Author ensures that the research has been conducted responsibly and ethically with adherence to all relevant regulations. read more..
- For Authors
- For Reviewer
- Manuscript Guidelines
- Membership
- Publication Ethics
-
- Journals
- Reprints
- e-Books
- Videos
- Policies
- Contact Us
 COVID-19
- Submissions


Full Text
Open Journal of Cardiology & Heart Diseases
Analysis of Feng, Sitek and Gullberg’s model for the Surface Area of the Left Ventricle
José Sérgio Domingues1*, Vale MP2 and Martinez3
1 Department of Mathematics, Federal Institute of Minas Gerais, Brazil
2 Cardiovascular Surgery, Nossa Senhora das Dores Hospital, Brazil
3 Department of Mechanical Engineering, Federal University of Minas Gerais, Brazil
*Corresponding author: José Sérgio Domingues, Department of Mathematics, Federal Institute of Minas Gerais (IFMG), Formiga, MG, Brazil
Submission: February 02, 2018;Published: August 31, 2018

ISSN 2578-0204Volume2 Issue4
Mini Review
In 2001, a mathematical model for determining the surface area of the left ventricle (LV) and another one for its volume (VLV) was presented [1]. Both were based on the consideration that the geometry of a normal LV is similar to the one of a Truncated Prolate Spheroid (TPS) [2-6]. The ellipsoidal coordinates were considered, which are harder to obtain than linear coordinates, which are easily achievable with echocardiographic exams (Figure 1).
figure 1:Geometric representation of the LV with elliptical coordinates [1].

The goal was to verify if there was a strong linear relationship between the VLV and the surface area of the LV, and in case this relationship was proven, the VLV could be estimated based on its surface area. From this geometric model, two equations were obtained: one for the VLV, and another one for its surface area (Equations 1 and 2).
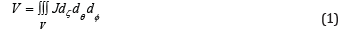

where J is the determinant of the Jacobian matrix of the variables x, y, and z. The obtained results show a near perfect linear correlation between log (Volume) and log (Area), which can be seen on Figure 2. However, only the data of 10 patients were used, and their features were not taken into account, such as gender, age, body surface, height, etc. This lack of description of the patients’ specific features precludes a more detailed analysis of this parameter.
figure 2:Correlation between VLV and the area of the LV [2].

Besides, the VLV was calculated by considering the same model that was used on determining the surface area of the LV, that is, the volume of a TPS was calculated and, later, the surface area of the same TPS. That way, mathematically, we can already expect a perfect correlation, because the calculated parameters are closely related to the model that was used, making them dependent on each other.
This dependence between the equations for area and volume was reviewed for average data of the diastolic diameter of the LV on asymptomatic Brazilian population, on the work of [7,8]. However, in this project, he used Cartesian mathematical models, because they facilitated its practical application, since the variables that are needed for determining the VLV and its surface area (Equations 3 and 4) are linear.
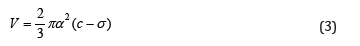
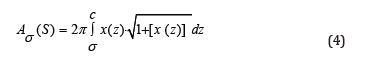
In these equations, a and c represent the smallest and biggest semi-axes of the truncated spheroid, and |𝜎| and 𝑥(𝑧) represent the truncating point, and the equation on the positive part of the truncated spheroid’s curve. By performing the simulations and determining the linear correlation between the VLV and the surface area of the LV, it is possible to notice, as in [1], the direct dependency between these two parameters, that is 𝑟=0.9999. This happens due to the fact that all the equations (Equations 1-4) are based on the same geometry for the LV (Figure 3).
figure 3:Correlation between VLV and the area of the LV for the Cartesian model.

Conclusion
Therefore, it is unrealistic to admit that there is a perfect linear correlation between the VLV and its superficial area, based on models that were built like that. And therefore, one of the options to identify a more real correlation is the comparison between the area obtained by these models and the VLV obtained by traditional medical methods, such as Teichholz and Simpon’s discs.
References
- Feng B, Sitek A, Gullberg T (2001) The prolate spheroidal transform for gated SPECT. IEEE Transactions on Nuclear Science 48(3): 872-875.
- Yeh GCK, Martinek J (1957) Comparison of surface potentials due to several singularity representations of the human heart. The Bulletin of Mathematical Biophysics 19(4): 293-308.
- Baccani B, Domenichini F, Pedrizzetti G (2003) Model and influence of mitral valve opening during the left ventricular filling. Journal of Biomechanics 36(3): 355-361.
- Nielsen PMF, Grice IJL, Smaill BH, Hunter P (1991) Mathematical model of geometry and fibrous structure of the heart. Am J Physiol 260(2): H1365-H1378.
- Katz TL, Mattos CFG, Kowatsch I, Vieira ML (2010) Critical analysis of echocardiographic measurements of left ventricular mass. Revista Brasileira de ecocardiografia e Imagem Cardiovascular 23(4): 95-100.
- Filho PRPF (2012) Padrões de hipertrofia egeometria do ventrículo esquerdo pela ecocardiografia transtorácica. Revista Brasileira de ecocardiografia e Imagem Cardiovascular 25(2): 103-115.
- Domingues JS, Vale MP, Martinez CB (2017) New mathematical model for the surface area of the left ventricle by the truncated prolate spheroid. The Scientific World Journal, pp. 1-9.
- Domingues JS (2017) Modelagem Matemática da ventriculectomia parcial esquerda e determinação de um parâmetro cardíaco do ventrículo esquerdo, PhD thesis, Universidade Federal de Minas Gerais, Brazil.
© 2018 José Sérgio Domingues. This is an open access article distributed under the terms of the Creative Commons Attribution License , which permits unrestricted use, distribution, and build upon your work non-commercially.
Editor In Chief


.jpg)


Signup for Newsletter

Quick Links
 Editorial Board Registrations
 Submit your Article
 Refer a Friend
 Advertise With Us
Our Recent Edition

.jpg)


Top Editors


.jpg)


.bmp)
.jpg)
.png)
.jpg)


.jpg)


.png)

.png)


.png)


Financial Support

Sponsors

Latest e-Books

Latest Video

 a Creative Commons Attribution 4.0 International License. Based on a work at www.crimsonpublishers.com.
Best viewed in
a Creative Commons Attribution 4.0 International License. Based on a work at www.crimsonpublishers.com.
Best viewed in