
- About Us
- Information
-

The Author ensures that the research has been conducted responsibly and ethically with adherence to all relevant regulations. read more..
- For Authors
- For Reviewer
- Manuscript Guidelines
- Membership
- Publication Ethics
-
- Journals
- Reprints
- e-Books
- Videos
- Policies
- Contact Us
 COVID-19
- Submissions


Full Text
Open Access Biostatistics & Bioinformatics
The First Experience of Tomographic Representation of an ECG-Signal
Yu Belousov*, N Elkin and I Yavelov
Terra Quantum AG, Switzerland
*Corresponding author:Yu Belousov, Terra Quantum AG, Kornhausstrasse 25, 9000 St. Gallen, Switzerland
Submission: February 02, 2024;Published: February 23, 2024

ISSN: 2578-0247 Volume3 Issue4
Abstract
The experience for tomographic representation of ECG-signal is considered. Tomogram representation of the signal is identical to the Radon transform for processing various signals. It is shown that the tomographic representation for small parameters of transformation is identical for different leads, may reveal instability of isoelectric line and distinguish some forms of arrhythmias. This makes it possible to use only one lead for express analysis.
Keywords:Tomographic representation; ECG-signal; Heart diseases; Arrhythmias
Introduction
At present, spectacular progress is achieved in the development of probabilistic approach to the basic principles of quantum mechanics (for instance, see [1]). This approach is based on tomographic representation of density matrix and the Wigner function [2,3], yielded by the Radon transform [4]. The probabilistic approach made it possible to apply the methods of quantum mechanics in description of various signals. The most comprehensive description of this method is given in [5]. Especially interesting are the attempts to use the tomographic approach to transform and analyze the medical signals [6,7]. When processing such signals, the Fourier transform is widely used, representing the signal as a function of the frequency ω. This transform is currently a common tool in the analysis of Electrocardiograms (ECGs). The tomographic transformation makes it possible to represent the signal as a positively defined function that simultaneously depends on both time and frequency. Recently, the tomographic representation was applied for processing some biological signals [8,9]. These studies were carried out to evaluate new perspectives that open up when analyzing a human ECG using tomographic representation.
Tomographic Representation
The tomographic representation can be introduced as a generalization of the Wigner function to a positive definite distribution [10]. A rigorous description of this mathematical transformation is given in [5], and a detailed description of its application to the analysis of some biological signals is given in [8,9]. Here we will give a brief description of the essence of the tomographic representation.
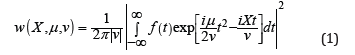
If we define some time-varying t signal as f(t), then its tomographic representation w is given by the following relation:
Here X is an eigen value of a Hermitian operator
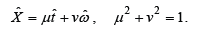
The variables t and ω are taken in dimensionless units. It is convenient to define the parameters μ and ν as follows

The eigen value of ˆX is located at the straight line of the first quadrant in the plane of variables (t,ω).
The tomographic representation (1) is strictly connected with the so-called Fractional Fourier Transformation (FRFT) (see, e g. [11,12]), which is widely used for example in quantum optics. From the other side it is the same as the Radon transformation [13]. As usual FRFT is written in a form
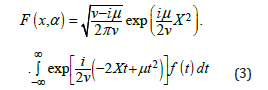
Dimensionless variable α changes in the interval 0≤α≤1 and is called the transformation order. The transformation order is related to the previously entered parameters by the ratio α=2θ/π, and we can write them as μ=cos(πα/2), ν=sin(πα/2).
Easy to see that the tomographic representation is equal to the squared of FRFT modulus

Result and Discussion
We received about 500 recordings for both sick and healthy patients using a standard ECG device, but with only two leads. One lead was oriented vertically, and the other was oriented horizontally. First of all, we have shown that for express diagnostics we can use only one lead. Indeed, Figure 1 shows a typical ECG signal from two leads and its tomographic transformation. It is easy to see that the Fourier spectrum is identical for the two leads, but the amplitude distribution differs, and only the tomogram for α<1 reveals small differences in the spectrum. The differences in amplitude distribution are different in different patients.
Figure 1:The ECG signal, their square of the Fourier transforms module and the tomographic transformation for α= 0.99 from two leads: (a) vertical lead, (b) horizontal lead.

The tomogram transform is sensitive for instabilities of ECG signal. To illustrate this result, we give an example for a healthy person when one lead shows instability and the second shows a stable signal. As shown in Figure 2 instability in the first lead leads to the appearance of additional peaks near the zero point, even for the square of the Fourier transform. This effect is observed more clearly with tomographic transform. We observed this effect in most patients for ECG signals from both leads.
Figure 2:The ECG signal for a stable and unstable isoelectric line and their square of the Fourier transform module: (a) stable, (b) unstable.

Finally, it is useful to give the following characteristic example related to the phenomena of arrhythmia. In the following, we will show the ECG with sinus arrhythmia Figure 3(a) and supraventricular extrasystoles Figure 3(b). We can see that the Fourier transform already shows a slight splitting of the characteristic frequencies of the spectrum into doublets, as can be seen in Figure 3. The tomogram transformation makes this splitting deeper with broken symmetry. We do not give it for reasons of brevity. In patients with supraventricular extrasystoles, the effect does not manifest itself as splitting, but as the appearance of additional frequencies. This is shown in Figure 3(b).
Figure 3:The ECG signal, their square of the Fourier transforms module and the tomographic transformation for α=0.99 from one lead: (a) with sinus arrhythmia, (b) with supraventricular extrasystoles.

Conclusion
The first experience of using tomographic representation for processing ECG signals has shown a very high potential of this method for analyzing various signals of living systems. In particular, we have confirmed the validity of using only one lead for rapid diagnosis, which in some cases can be very important. We have shown that the appearance of instability can be easily detected by additional peaks in the vicinity of the zero point of the tomogram. We hope that this new method can be useful for the rapid diagnosis of ECG abnormalities and possibly some cardiovascular diseases. We also showed that the tomographic representation can provide almost all the important information obtained from short recordings of the ECG signal.
References
- Ibort A, Manko VI, Marmo G, Simoni A, Ventriglia F (2011) A pedagogical presentation of a C⋆-algebraic approach to quantum tomography. Phys Scr 84(6): 065066.
- Wigner E (1932) On the quantum correction for thermodynamic equilibrium. Phys Rev 40(5): 749.
- Ville J (1948) Cables and transmission 2A: 62.
- Radon J (1917) Reports from the Saxon Academy of Sciences 29: 262.
- Manko MA, Manko VI, Mendes RV (2001) Tomograms and other transforms: a unified view. J Phys A Math Gen 34(40): 8321.
- Aguirre C, Pascual P, Campos D, Serrano E (2011) Single neuron transient activity detection by means of tomography. BMC Neuroscience 12(Suppl 1): 297
- Aguirre C, Pascual P, Serrano E (2013) Detection of neuronal signatures by means of data-driven tomography. BMC Neuroscience 14(Suppl 1): P309.
- Belousov YM, Elkin NN, Manko VI, Popov EG, Revenko SV (2018) Tomographic representation of electrocardiogram signals. J Rus Laser Research 39(3): 302-313.
- Belousov YM, Elkin NN, Manko VI, Revenko SV, Tarakanov IA, et al. (2022) Time reversal and tomographic representation for signal processing in living systems. J Rus Laser Research. 43(4): 428-438.
- Manchini S, Manko VI, Tombesi P (1996) Symplectic tomography as classical approach to quantum systems. Physics Letters A 213(1-2): 1-6.
- Ozaktas HM, Arikan O, Kutay MA, Bozdagt G (1996) Digital computation of the fractional Fourier transform. IEEE transactions on signal processing 44(9): 2141-2150.
- Namias V (1980) The fractional order fourier transform and its application to quantum mechanics. J Inst Maths Applications 25(3): 241-265.
- Ozaktas HM, Kutay MA, Mendlovic D (1999) Introduction to the Fractional fourier transform and its applications. Hawkes PW (Ed.), Advances in Imaging and Electron Physics. Academic Press, San Diego London Boston New York, Sydney Tokio Toronto, 106: 239.
© 2024 Yu Belousov. This is an open access article distributed under the terms of the Creative Commons Attribution License , which permits unrestricted use, distribution, and build upon your work non-commercially.
Editor In Chief


.jpg)


Signup for Newsletter

Quick Links
 Editorial Board Registrations
 Submit your Article
 Refer a Friend
 Advertise With Us
Our Recent Edition

.jpg)


Top Editors


.jpg)


.bmp)
.jpg)
.png)
.jpg)


.jpg)


.png)

.png)


.png)


Financial Support

Sponsors

Latest e-Books

Latest Video

 a Creative Commons Attribution 4.0 International License. Based on a work at www.crimsonpublishers.com.
Best viewed in
a Creative Commons Attribution 4.0 International License. Based on a work at www.crimsonpublishers.com.
Best viewed in