- Submissions

Full Text
Open Access Biostatistics & Bioinformatics
Resolving Issues at Host Level Using Variable Reduction Methods: Case of Cornudiscoides Spp. (Platyhelminthes: Monogenoidea)
Nirupama A1, Jyoti V1, Girdhar GA2 and Ashok KSingh3*
1Department of Zoology, India
2Department of Statistics, India
3RGG Department, University of Nevada, USA
*Corresponding author: Ashok K Singh, RGG Department, William F Harrah College of Hospitality, Las Vegas, USA
Submission: October 3, 2020;Published: November 11, 2020

ISSN: 2578-0247 Volume3 Issue2
Abstract
Taxonomy deals with delineating and classifying organisms, and traditionally relies on morphological characters only. We have used morphological characters, and molecular biology to distinguish monogenoids at generic and specific levels. Principal Component Analysis provided a magnifying glass to resolve the taxonomic issues as well as their host levels.
Introduction
Taxonomy is the branch of science which deals with delineating and classifying organisms [1]. It plays an important role in conserving biodiversity [2]. Traditionally, the approaches of taxonomy are based on morphological characters only. According to Dayrat [1] morphospecies (species established on the basis of morphology) are hypotheses, that can be proven by different kinds of approaches and researchers develop several new techniques and tools for testing species hypothesis [3-5]. However, the morphological study has its own limits resulting in misidentification and incorrect placement of several dactylogyrid genera and species [6]. In recent era, molecular taxonomy (nuclear DNA and Mitochondrial DNA) has been used successfully to complement morphologically based taxonomy. DNA molecules have also been utilized to study parasites as well their inter/intra-relationship [7-10]. Apart from molecular analysis researchers also have employed several statistical methods e.g. linear discriminant analysis (LDA), principal component analysis (PCA) and multivariate analysis of variance (MANOVA) to explain inter-specific and intra-specific relationships in monogenoideans [6,11-13]. The monogenoid genus [14] infects two members of the family bagridae Mystus Scopoli, 1777 and Sperata Holly, 1939. The species infecting the two fishes are quite similar characters. Supporting evidence from one additional discipline is also required and earlier discriminant analysis proved useful in distinguishing dactylogyrid monogenoids at generic and specific level [6].
In the present work, the PCA is used to resolve the taxonomy of a single genus at specific level and the species infecting two hosts. For comparison, species of another dactylogyrid genus Bifurcohaptor [15] was also taken into consideration.
Material and Methods
Data collection
Fish hosts (commonly available freshwater food fishes for which ethical clearance is not required) were collected from different water bodies of Lucknow (26º51ºN 80º57º E), Barabanki (26.92ºN 81.20ºE), Gorakhpur (26.7588ºN 83.3697ºE) and Basti (27º 15ºN83º00ºE) and identified with the help of Fish base (Froese and Pauly, 2018) and sacrificed. Gills were removed and transferred in glass Petri-dishes, containing water. Live worms are observed under binocular microscope. A total of 500 specimens of nine species of [13-17] Cornudiscoides viz. C. n.sp. and one species of Bifurcohaptor i.e. B. indicus [12] thus collected are identified with the help of “An Encyclopaedia of Indian Monogenoidea” [10]. Temporary slides (glycerine mount) are prepared for the study of hard parts. The morphometric data is recorded from temporary and permanent specimens. All the measurements were taken in µm. In present study ten parameters (variables); dorsal anchor inner length, dorsal anchor outer length, dorsal anchor recurved point, ventral anchor inner length, ventral anchor outer length, ventral anchor recurved point, dorsal bar length, ventral bar length, small hook length and large hook length are measured in µm (Figure 1), by Olympus BX 51 image analysis software. Needless to mention here that species under study have distinct copulatory complex, being peerless, therefore not included in the present study.
Methods
Principal component analysis (PCA) is a latent variable method that reduces the dimensionality of the data while explaining most of the variation in the data set. It accomplishes this reduction by identifying directions, called principal components, along which the variation in the data is maximal. By using a PCA, each sample can be represented by relatively few principal components instead of possibly thousands of variables. PC scores of samples can then be used in clustering or grouping the species into meaningful groups. The morphometric data of the hard parts (haptor) of 500 specimens (fifty specimens per species), belonging to nine species of the genus Cornudiscoides and one species of the genus Bifurcohaptor were prepared and statistically analyzed.
K-Means cluster analysis was used on PC-scores to form K groups of observations (1 ≤ K ≤ n), and the plot of within cluster sum of squares vs. K was used to determine the optimal number of clusters K [17]; optimal K is the smallest value of number of clusters after which the within cluster sum of squares does not improve (i.e., does not decrease) much.
Result
Descriptive statistics and visual summary
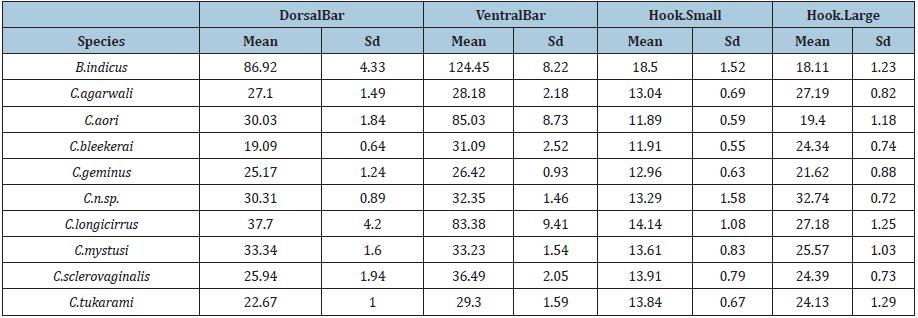
For exploratory data analysis of the dataset, the sample mean, and standard deviation (sd) were computed, and Box-plots were used to provide a five-point visual summary of all variables by species [18-23]. This gives an insight into the characteristics of variables and helps in our inferential analysis. (Table 1) shows that the sample mean and sd of the 10 variables described in (Figure 1). It can be seen from (Table 2) that the Species B. indicus has the largest mean of all measurements except for Hook Large.
Table 1:Mean and sd of Inner.Length.D, OuterLength.D, and RecurvePoint.D by Species.

Table 2:Mean and sd of InnerLength.V, OuterLength.V, and RecurvePoint.V by Species.
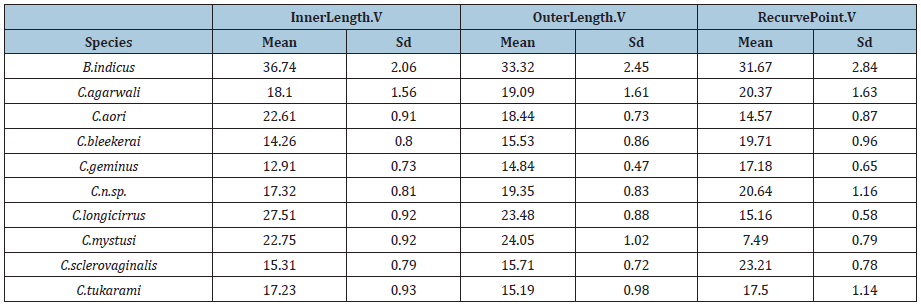
Figure 1: Schemes for nomenclature and measurement of the sclerotized structures used in study. a- dorsal anchor inner length, b- dorsal anchor outer length, c- dorsal anchor,d- ventral anchor inner length, e- ventral anchor outer length, f- ventral anchor recurved point, g- dorsal bar length, h -ventral Bar length, i- small hook length,j- large hook length.

Figure 2(a) and 2(b):Shows that all of the observations of Inner.Length.D, OuterLength.D, RecurvePoint.D Inner.Length.V, OuterLength.V, RecurvePoint.V variables in the Species B. indicus fall well above the same for all other nine species; the values of VentralBar and Hook.Small for the Species B. indicus s are generally higher than the values for the other nine species, but some overlap can be seen. The values of the variable Hook.Large, however, are relatively small compared to the other nine species. It shown the boxplots of the 10 variables by Species.
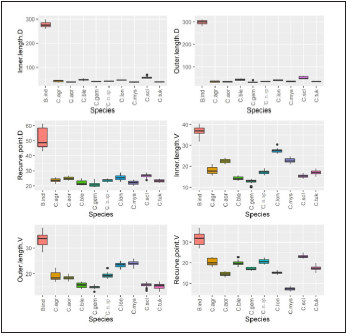
Figure 2(b): Box-plots by Species for Dorsal.Bar, Ventral.Bar, Hook.small, Hook.large, and sample means of all ten variables.
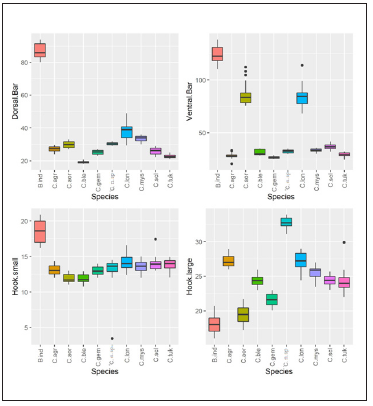
Figure 3:Scree plot showing % of variation explained vs. number of PC components.
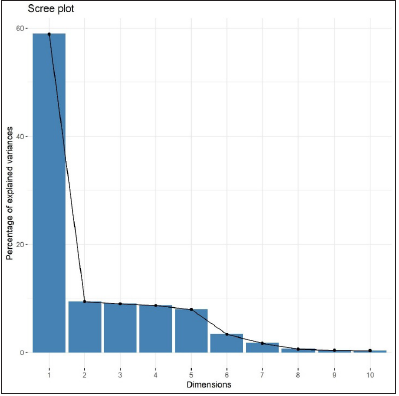
Figure 4:Plot of PCA loadings.
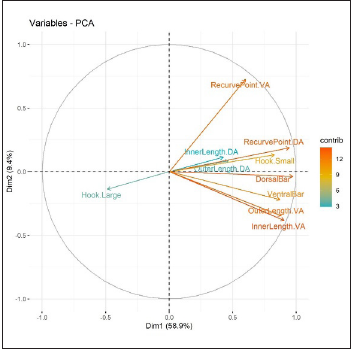
PCA was performed on the correlation matrix of original variables. The scree plot (Figure 3) suggests using the first two components (Table 3). PCA plots of the first two components allowed visualization of the data and to establish whether there were any intrinsic (part of haptor) differences in the anchors, bars and hooks. The PC loadings (Figure 4) were examined in order to determine which variables contributed most to the PC in which separation was observed and hence to indicate which variables were most dominating in separating classes. It can be seen from Figure 3 that the first PC is essentially a contrast between Dorsal Bar, Hook. Small, Ventral Bar, Recurve Point.D, Outer Length.V on the positive side and Hook. Large on the negative side. The second PC is mostly a contrast between RecurvePoint.V on the positive side and Inner Length.V, Outer Length.V Ventral Bar, and Hook. Large on the negative side. (Figure 3) also shows that the first component explains 58.9% of total variability, the second component explains 9.4% of total variability, and the first two components together explain 68.9% of total variability in the data.
Table 3:Mean and sd of DorsalBar, VentralBar, Hook.Small, Hook.Large by Species.
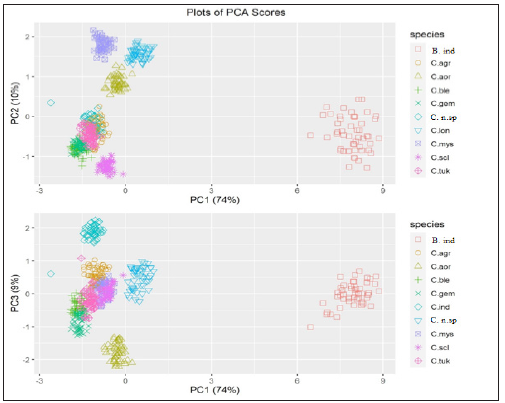
Plots of PCA scores Pl
ots of second and third PC-scores vs. the first PC-score are shown in (Figure 5); it can be seen from (Figure 5) that the PCscores are able to discriminate between the ten species.
Figure 5:Plots of PC2 and PC3 scores vs. PC1 scores
Results of K-means cluster analysis
Figure 6:Plot of within clusters sum of squares vs. K (optimum K=3).

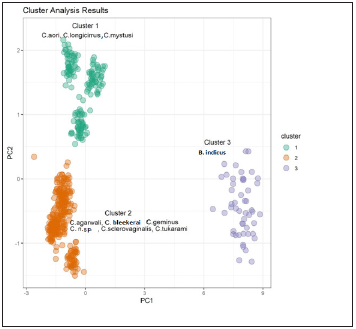
The plot of within clusters sum of squares vs. K (number of clusters) shows that K=3 is the optimum number of clusters, since any further increase in K does not improve the within clusters sum of squares (Figure 6). (Figure 7) shows a plot of PC2 vs. PC1 by Cluster Number for the cluster analysis results using 3 clusters. It can be seen from (Figure 7) that Cluster 3 consists of samples with higher PC1 values (large Dorsal Bar, Hook. Small, Ventral Bar, Recurve Point.D, Outer Length.V, and small Hook. Large). Clusters 1 and 2 are characterized by relatively lower values of PC1; the second component PC2 separates Clusters 1 and 2 quite well, with large PC2 values (large Recurve Point.V and low Inner Length.V, Outer Length.V, Ventral Bar, Hook. Large) falling in Cluster. All computations and visualizations in this article are done in the statistical software environment R (2020).
Figure 7:Plot of PC2 vs. PC1 by clusters number.
Discussion
Different species of Cornudiscoides are very similar to each other in terms of morphology of dorsal anchor, ventral anchor, bar, hooks. It is difficult to distinguish between closely related species. Because of strong morphological similarities, morphometric identification of closely related species requires use of characters with high diagnostic power, that is, characters that have minimum overlap among species. The statistical tools applied here provide alternate solution of this problem. PCA is able to separate 450 individuals of Cornudiscoides and 50 of the genus Bifurcohaptor into 3 distinct groups. Scatter plots between PC1 and PC2 revealed that all Cornudiscoides species clustered in linear fashion and showed distinct relationship with the genus Bifurcohaptor indicus. Apart from this, it is worth noticing that Cornudiscoides species clustered on the basis of their host i.e., we can observed three clusters, one, in which all species that reported from Mystus (C. geminus, C. agarwali, C. tukarami, C. sclerovaginalis, C. n. sp., C. bleekerai) is clustering together. In second cluster, species reported from Sperata (C. Mystusi, C. longicirrus, C. aori) clustered together while B. indicus reported from M. vittatus clustered separately, being a different genus.
These analyses indicate the suitability and effectiveness of using the present set of morphometric variables for species distinction at host level. This results also supports the molecular study by Verma et al. [9] in which Cornudiscoides species reported from Sperata clustered together and forming sister clade with species reported form Mystus. In the cluster of Cornudiscoides species reported from Mystus there is overlapping, except one i.e. C. sclerovaginalis the reason behind in C. sclerovaginalis shaft of dorsal anchor is comparatively large while other species have similarity in their haptor part with minute differences but. In case of species reported from Sperata, there are differences in size of shaft of dorsal anchor and ventral bar. In the present study, PCA has been successful in detecting the presence of groupings or intra-specific morphometric variants among Cornudiscoides species and the groups also showing their relationship with their host. Our statistical analyses indicate that main predictors for species discrimination are Inner. length.V, Hook. large, Ventral Bar, and Outer. length.V. Moreover, PCA of 500 individuals showed three distinct clusters, corresponding to ten species. Of these three clusters, one cluster, corresponding to the species of a genus Bifurcohaptor sp. is quite separate from the other two. It is worthwhile to mention here that Cornudiscoides species, clustered separately even on the basis of their hosts as well (from Mystus and Sperata). In conclusion, we suggest that since the taxonomy relied traditionally on morphological characters only, at least three data sets should be included: morphology, molecular biology and supporting evidence from one additional discipline. Help of molecular tools was earlier taken. In the present study statistical tool PCA was applied to distinguish monogenoids at generic and specific level. It also proved helpful to differentiate species infecting different of fish host.
Acknowledgement
This work was financially supported by Ashutosh Mukherjee fellowship of Indian Science Congress Association to N Agrawal.
References
- Dayrat B (2005) Towards integrative taxonomy. Biological Journal of the Linnean Society 85(3): 407-415.
- Sukumaran S, Gopalakrishnan A (2015) Integrative taxonomy-methods and applications. Kochi, India.
- Avise JC, Ball JR (1990) Principals of genealogical concordance in species concepts and biological taxonomy. Oxford Surveys in Evolutionary Biology 7: 45-67.
- Sites JW, Marshall JC (2003) Delimiting species: A Renaissance issue in systematic biology. Trends in Ecology & Evolution 18(9): 462-470.
- Rajvanshi S, Agrawal N (2014) Phylogenetic studies on thaparocleidus Jain, 1952, infecting Wallago attu Bloch and Schneider, 1801 inferred from 28S rDNA sequences in India. IJSR 3(5): 883-888.
- Agrawal N, Agarwal GG, Tripathi P, Pant R (2008) Discriminant analysis: A supportive tool for monogenoidean taxonomy. Biosci Trends 2(3): 128-132.
- Shrivastava RR, Agrawal N, Upadhyay MK (2013) Molecular analysis based on 28S rDNA of Dactylogyroides species parasitizing Puntius species. Bioengineering and Biosciences 1(3): 25-30.
- Rajvanshi S, Agrawal N, Upadhyay MK (2014) Thaparocleidus devrajii (Gusev, 1794) Lim.1996, infesting Ompok bimaculatus (Bloch, 1794) (Siluriformes: Siluridae) Moephological and molecular study. Advances in Zoology and Botany 2(2): 23-41.
- Verma J, Agrawal N, Verma AK (2017) The use of large and small subunits of ribosomal DNA in evaluating phylogenetic relationships between species of Cornudiscoides Kulkarni, 1969 (Monogenoidea: Dactylogyridae) from India. Journal of Helminthology 91(2): 206-214.
- Verma J, Rajvanshi S, Agrawal N (2018) Genetic characterization of three species of the genus Cornudiscoides Kulkarni, 1969 (Monogenoidea: Dactylogyridae), parasitizing long whiskered catfish Sperata Aor (Ham) using ribosomal and mitochondrial DNA. Journal of Zoological Sciences 6(1): 31-37.
- Mariniello L, Ortis M, Amelio DS, Petrarca V (2004) Morphometric variability between and within species of Ligophorus Euzet & Suriano, 1977 (Monogenea: Ancyrocephalidae) in the Mediterranean Sea. Systematic Parasitology 57: 183-190.
- Olstad K, Shinn AP, Bachmann L, Bakke TA (2007) Host-based identifi cation is not supported by morphometrics in natural populations of Gyrodactylus salaris and G. thymalli (Platyhelminthes, Monogenea). Parasitology 134(14): 2041-2052.
- Tan WB, Khang TF, Lim LHS (2010) Morphometric analysis of trianchoratus price & berry, 1966 (Monogenea: Heteronchocleidinae) from channa spp. (Osteichthyes: Channidae) of peninsular Malaysia. Raffles Bulletin of Zoology 58(1): 165-172.
- Kulkarni T (1969) Studies on the monogenetic trematodes of fishes found in Hyderabad, Andhra Pradesh (India) II. Riv di Parassitol 30(4): 73-90.
- Jain, SL (1958) Monogenea of Indian freshwater fishes. VII. Bifurcohaptor, a new genus of fresh water Tetraonchinae from the gill filaments of two fishes from Lucknow. J Parasitol 44(4 section: 1): 388-394.
- Rizvi SSH (1971) Monogenea of Pakistan fishes I. Ancylodiscoides mystusi, new species and aori, new species, from the gills of Mystus aor (Ham.). Pakistan J Zool 3: 87-92.
- Pandey KC, Agrawal N (2008) An encyclopaedia of Indian Monogenoidea. Vitasta Publishing Pvt. Ltd., New Delhi, India, pp. 1-522.
- Agrawal N, Vishwakarma P (1996) Six new species and redescription of two known species of the genus Cornudiscoides Kulkarni, 1969 (Monogenea) from Lucknow, Indian J Helminth 13: 10-31.
- Brownlee J (2020) Mastering machine learning algorithms. Packt Publishing Birmingham, UK, pp. 62-67.
- Izenman AJ (2008) Modern multivariate statistical techniques. Springer, New York, USA, pp. 260-262.
- Martinez AM, Kak AC (2001) PCA versus LDA. IEEE Transactions on Pattern Analysis and Machine Intelligence 23(2): 228-233.
- Morais CLM, Lima MGK (2018) Principal component analysis with linear and quadratic discriminant analysis for identification of cancer samples based on mass spectrometry. Journal of the Brazilian Chemical Society 29(3): 472-481.
- Novikov V, Baryshnikov A, Rysakova K, Shumskaya N, Uzbekova O (2020) Food Processing: Techniques and Technology, pp. 159-166.
© 2020 Ashok K Singh. This is an open access article distributed under the terms of the Creative Commons Attribution License , which permits unrestricted use, distribution, and build upon your work non-commercially.
 a Creative Commons Attribution 4.0 International License. Based on a work at www.crimsonpublishers.com.
Best viewed in


.jpg)


 Editorial Board Registrations
 Submit your Article
 Refer a Friend
 Advertise With Us
.jpg)


.jpg)


.bmp)
.jpg)
.png)
.jpg)


.jpg)


.png)

.png)


.png)


