- Submissions

Full Text
Novel Techniques in Nutrition and Food Science
Enhancement of the Inherent Characteristics of Cereals Using 2-6μm Mid-Infrared Rays
Umakanthan T1*, Madhu Mathi2 and Umadevi3
1Veterinary hospital, Gokulam Annadhanam Temple Complex, India
2Veterinary hospital, Vadakupudhu Palayam, Erode Dt, Tamil Nadu, India
3Assistant Professor, Department of Botany, The Standard Fireworks Rajaratnam College for Women, India
*Corresponding author:Umakanthan T, Veterinary hospital, Gokulam Annadhanam Temple Complex, India
Submission: April 04, 2024;Published: May 24, 2024

ISSN:2640-9208Volume7 Issue5
Abstract
Cereals are a major source of energy, protein, B vitamins and minerals for the world population. They are also important sources of dietary fiber and phytochemicals that can help prevent chronic diseases and cancer. However, the protein quality of cereals, especially for infants, is marginal. The process of milling removes important nutrients and nutraceuticals from cereals, but sprouting and fermentation can improve their nutritional value. The world’s most widely consumed staple food are cereals, particularly wheat and rice. Enhancement of these cereals’ inherent characteristics (such as taste, aroma and nutrition) without the use of chemicals is a scientific challenge. In this research, we invented a pocketsized Mid-IR Generating Atomizer (MIRGA). The atomizer when sprayed at a constant plunger pressure generated 2-6μm mid-IR. The spraying is done externally to the packets of wheat and rice. However, the generated mid-IR penetrated the intervening media and has acted on the inside cereals leading to changes in their molecular chemical bonds. This in turn positively affected their physico-chemical characteristics and resulted in improved inherent characteristics safely and economically. We validated the 2-6μm mid-IR induced alterations in the cereals’ chemical bonds and other parameters responsible for the characteristics and presented the results in this manuscript.
Keywords:MIRGA; 2-6μm mid-IR; Cereals; Sensory attributes; Enhancement; Safe; Economy
Introduction
Cereals are widely grown arable crops and serve as a major source of energy, protein, B vitamins and minerals for the world population. They are also important sources of dietary fiber and phytochemicals that can help prevent chronic diseases and cancer. Cereal grains contain various chemical components such as carbs, proteins, minerals, vitamins, fat and dietary fiber, as well as functional elements like inulin, beta-glucan and carotenoids. These components contribute to the health-improving properties of cereals and their potential role in disease prevention. Cereals quality is a complex phenomenon and depends on complex, intrinsic, extrinsic factors and even interactions among them which is difficult to explain. The eating and cooking qualities are vital in pricing [1]. Every region prefers different types of cereals for variety of purposes. The triats required by consumers are aroma, taste, texture, cooking time and quality, better eating and nutritional value. Now these requirements are scientifically hard tasks to be achieved.
Presently, disappearance/reduction in the sensory and nutritional characteristics of cereals is due to agrochemical application, modern agrotechnology, reduced cultivation days and genetic modification imposed during the past half century. Some methods for improving the taste of cereals are available. One method involves treating the cereal with microwave radiation, which improves palatability and prevents browning by preventing acidification of the cereals. Another method involves adding starter cultures to the cereals prior to or during malting, which improves the properties of malted cereals and can be used in the brewing, distilling and bakery industry. Additionally, a taste improver for food or beverage containing cereals can be produced by adjusting an extract of a starting material to pH 6-12 and then heating it, resulting in a product that enhances the thickness of taste and body feeling without showing any miscellaneous taste. These methods provide options for enhancing the taste of cereals [2] but they are uneconomical and the processing becomes hectic.
The aim of the research is to the extent possible; affordable, easy and rapid restoration of the sensory attributes and characteristics of cereals by using mid-IR at consumer/producer level. Food irradiation using infrared radiation is a promising technology for food preparation and safety. It can eliminate disease-causing bacteria, control parasites and insects, reduce spoilage and inhibit ripening and sprouting. The process of irradiation is endorsed by important health organizations and allowed in many countries. Infrared (IR) heating is widely used in food processing applications for various purposes such as drying, blanching, pasteurization, roasting, baking and cooking of food materials. It offers advantages such as faster heat treatment, higher heat transfer capacity, uniform heating, better process control and higher retention of bioactive components compared to traditional methods. IR technology is used in many food manufacturing processes including drying, boiling, heating, peeling, polyphenol recovery, freeze-drying, antioxidant recovery, microbiological inhibition, sterilization and cooking food. Overall, the use of infrared is an energy-efficient and high-efficiency technology with various applications in the food processing industry. In this study, we employed mid-infrared having wavelength of 2-6μm to rice and wheat-commonly used globallyand improved the said traits to an appreciable level. The mid-IR is safe from biological molecules and 66% of sun’s energy is infrared in which mid-IR is safest zone [3-5]. The effect of applied mid-IR in the chemistry of cereals, sensory taste and cooking parameters are described here.
Materials and Method
MIRGA (patent no: 401387) is a 20ml pocket sized atomizer (Supplementary File-Figure F1) containing inorganic water-based solution in which approximately two sextillion cations and three sextillion anions are contained. During spraying, depending on pressure (vary with the user) applied to plunger, every spraying generates 2-6μm mid-IR. Design of the MIRGA and emission of 2-6μm mid-IR has been presented in detail by Umakanthan et al. [6- 9]. Every time spraying emits 0.06ml which contains approximately seven quintillion cations and eleven quintillion anions. (details about MIRGA available in supplementary text T1) The inorganic compounds used in the generation of MIR are a perspective for biomedical applications [10,11]. It is also a new synthesis method for preparation of functional material (2-6μm mid-IR) [12,13]. It is well known that the combination of different compounds, which have excellent electronic properties, leads to new composite materials, which have earned great technological interest in recent years [14,15]. Retail wheat and rice were used. brands and breeds were not mixed but individually tested. For control and trials, samples were taken from the same brand/ breed of cereal packet.
Supplementary Figure 1.MIRGA spray diagram.

A packet containing 1000g wheat was purchased from cereal market in India, repackaged in 12 polyethylene packets (≥51 micron) with 80g per packet and manually sealed with cellophane tape. The first packet was marked “C” (control). 11 packets were individually numbered from 1 to 11 and MIRGA spraying was done from 0.25- 0.50m to packets. The numbering of the packet corresponded to the number of sprayings (e.g. packet 1 received one spray, packet 2 received 2 sprays and so on). The 12th non-sprayed packet served as control packet. Twenty grams of wheat were sampled from each of these 12 packets and were individually subjected to tests by a 6-member sensory expert panel. The acceptability index was a Hedonic scale with a 9-point nominal structure: 1-Dislike extremely, 2-Dislike very much, 3-Dislike moderately, 4-Dislike slightly, 5-Neither like nor dislike, 6-Like slightly, 7-Like moderately, 8-Like very much, 9-Like extremely [16,17]. A 40g boiled sample was also evaluated by the panel. The control 4-sprayed (favorable) and 11-sprayed (unfavorable) wheat samples were powdered and subjected for instrumentation analysis. The same method was followed with rice. Powdered control, 3 (favorable) and 10 sprayed (unfavorable) rice samples were analyzed. The samples were analyzed by High Resolution Liquid Chromatograph-Mass Spectrometer (HR-LCMS), gas Chromatography-Mass Spectrometry (GC-MS), Fourier-transform infrared spectroscopy (FT-IR), Powder X-Ray Diffraction (PXRD), Transmission Electron Microscopy (TEM), proton nuclear magnetic resonance spectroscopy (1H-NMR) and bomb calorimeter (instrument details in Supplementary file -Text T2).
Result and Discussion
Sensory attribute changes were perceived in 1-2 minutes after spraying.
Sensory profiling of wheat
Control sample: Nutty taste and aroma. Took 1hr 40 minutes
for cooking the cooked wheat had regular softness, taste and aroma.
sprayed sample: Sweet, soft in texture and stickiness increased
than control. Cooking time was 1 hour 10 minutes i.e., 30% time
and heat energy saved compared to control.
sprayed sample: Sweetness reduced by half, hard, gummy
in texture and stickiness increased than control. Cooking time
was 2 hours 15 minutes i.e., 35% time and heat energy increased
compared to control.
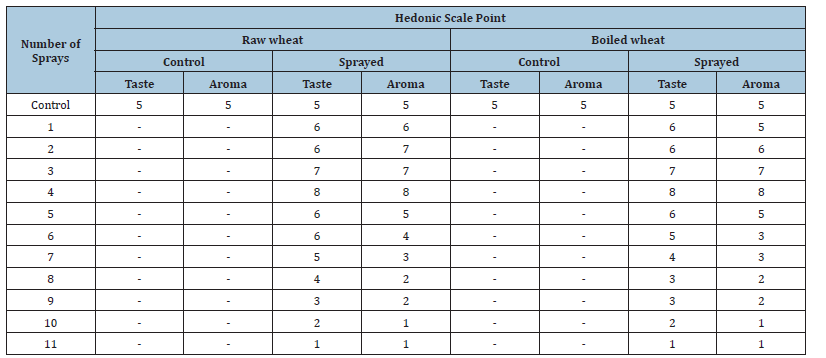
Compared to control, as the spraying number increased, the taste and aroma became enhanced and reached the peak on 4th spraying. From 5th spraying onwards, the taste and aroma was slowly found to be reducing and on 11th spraying, the taste and aroma were lost. (Table 1)
Table 1:Sensory profile of wheat.
Sensory profiling of rice
Control: Raw rice taste and aroma. Took 20 minutes to cook the
cooked rice had milder nutty taste and cooked aroma.
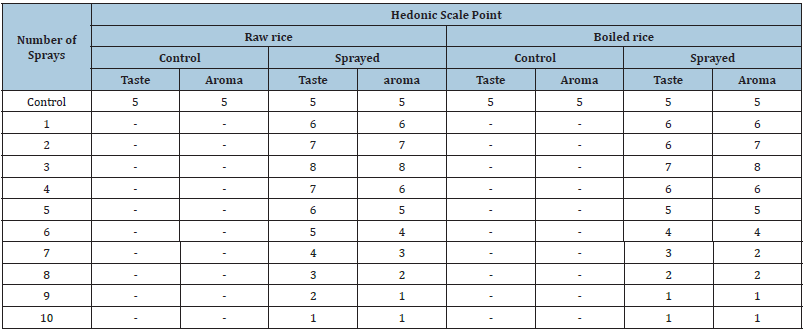
sprayed: Brittle, the taste and aroma enhanced than control.
Took 35 minutes to cook i.e., 75% time and heat energy increased.
sprayed: More brittle, tasteless and had lesser aroma. Took 15
minutes to cook i.e., 75% time and heat energy decreased.
Table 2:Sensory profile of rice.
Calorific value estimation
Bomb calorimeter estimation showed that, compared to control, 15-20% increased calorific value in 4 sprayed wheat and 3 sprayed rice samples, whereas 5-20% calorific value decreased in 11 sprayed wheat and 10 sprayed rice samples.
Instrumentation results FTIR
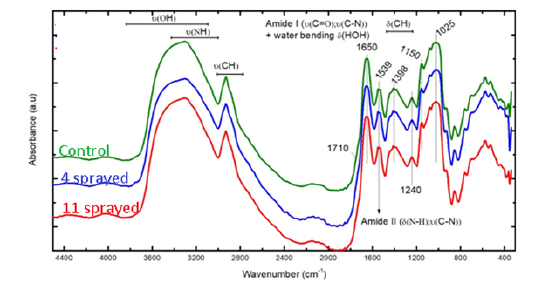
a. Wheat: In analyzing the high frequency region, board peak at 3500cm-1 and the peak at 1650cm-1 indicate the presence of water in the sample. Water has a high IR absorption and any overlapped peak from the compounds present in the wheat samples are hidden by the water peaks. In the 4 sprayed-control samples spectrum, peaks at 3600, 3090 and 2930cm-1 assigned to υ(OH), υ(NH) and υ(CH) are observed. Similar peaks are observed for the 11 sprayed-control samples, but with a smaller intensity. Increase in the υ(OH) peak indicates the incorporation of water in a molecule and break of a carbohydrate molecule (e.g. sucrose) into monomers (e.g. glucose and fructose). Increase in the peak at 3090cm-1 indicates an increase in N-H bond strength of the proteins due to H-bonds. The changes in the 11 sprayed sample spectra are smaller.
Analysis of low frequency region (2000-500cm-1) shows that the signals are similar since wheat contains mainly hydrocarbons. However, there are signals at 1660, 1535 and 1390cm-1 assigned to amide modes from the proteins. In particular, the signals at 1730-1710cm-1 assigned to COOH from side chains, 1696cm- 1 assigned to β-sheet and 1640cm-1 assigned to δ(HOH) from water correspond to the amide I mode. Amide II band represents the N-H bending contribution, while Amide III consists of complex vibrational modes. (Figure 1)
Figure 1.FTIR of Wheat.
b. Rice i. Thermo Avtar 370 FTIR spectrometer (Figure 2(a))
Control: The control sample shows a broad peak in the 3400 cm-1 range, a sharper peak at 2928 cm-1. The peak at 3400cm-1 is typical of O-H and N-H groups indicating the presence of alcohols, amines and carboxylic acid groups. The peak at 2928cm-1 is typical of C-H stretching due to an alkane moity. Additional peaks (cm-1) and the proposed functional group assignments are: 1648 (C=C), 1542 (N-O), 1378 (O-H and/or C-F and/or S=O, 1230 (C-N), 1156 (C-O), 1086 (C-N, C-O), 1023 (C-N), 855 (C-Cl), 763 (C=C), 706 (aromatic/benzene-type ring), 576 and 523 (chloro-, bromo-, or iodo-alkanes).
3 sprayed sample: The spectrum is qualitatively similar to the control with the given peak assignments as for the control sample. However, the broad peak near 3400cm-1 has a shoulder at higher and lower wave numbers. The differences in the IR spectra between the control sample i.e. symmetrical shoulders around the 3400cm-1 is an indicator of the change in taste and aroma of this sample as well as the brittleness, due to additions or changes in the composition of compounds with O-H and/or N-H groups.
10 sprayed sample: There are additional peaks at around 3800cm-1 and 3900cm-1. In addition, the broad peak near 3400cm-1 shows symmetrical splitting around the center. The peaks at 3800cm-1 and 3900cm-1 and symmetrical splitting of the 3400cm-1 due to the presence of compounds containing O-H and/or N-H groups that give rise to the change in texture and taste of this sample.
It has been reported that changes in the amylose content of rice starch affects the brittleness. The changes in the FTIR spectrum of the 3 and 10 sprayed samples relative to the control sample are consistent with changes due to the presence of amylose which contains O-H groups [18-22].
ii. IR AFFINITY I – FTIR Spectrophotometer, FTIR 7600, Shimadzu (Figure 2(b))
Peak 3386cm-1 is responsible for the presence of the O-H here we can determine it as part of water peak and OH groups from carbohydrates compared to control. In 3 sprayed sample squares of this peak is bigger by 51%. In 10 sprayed sample square of this peak is bigger by 61%. Peak 2925cm-1 is responsible for the presence of the C-H and is characteristic of carbon chain. In 3 sprayed sample square of this peak is bigger by 45%. In 10 sprayed sample square of this peak is bigger by 56%. Peak 1652cm-1 is responsible for the presence of the N-H here we can determine it as part of proteins. In 3 sprayed sample square of this peak is bigger by 39%. In 10 sprayed sample square of this peak is bigger by 47%. Peak 1157cm-1 is responsible for the presence of the C-O group here we can determine it as part of carbon hydrates. In 3 sprayed sample square of this peak is bigger by 64%. In 10 sprayed sample square of this peak is bigger by 46%. Peak 1077 cm-1 is responsible for the presence of the C-O group here we can determine it as part of carbon hydrates. In 3 sprayed sample square of this peak is bigger by 43%. In 10 sprayed sample square of this peak is bigger by 52%. Peak 1020cm-1 is responsible for the presence of the C-O group here we can determine it as part of carbon hydrates. In 3 sprayed sample square of this peak is bigger by 45%. In 10 sprayed sample square of this peak is bigger by 50%. Increase in the peak areas in 3 sprayed and 10 sprayed samples indicate the rebuilding in the composition of carbohydrates with spraying.
Figure 2.FTIR of Rice.

PXRD
a. Wheat: PXRD patterns reveal the existence of semicrystalline nature of the samples. The diffraction peaks are obtained for 2θ values at 18.38°, 23.33° for control sample, 18.21°, 23.18° for the four sprayed sample and 17.88° and 23.15° for the 11 sprayed sample. The semi-crystalline nature of the samples can be attributed to the fact that wheat gluten is a highly amorphous multipolymer system and also crystallinity occurs in starch fractions [23] (Figure 3 & Table 3).
Figure 3.PXRD spectra of wheat.
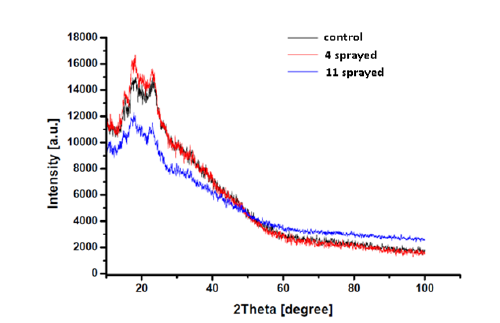
Table 3:Grain size of wheat samples.

After boiling, it is found that the four sprayed sample is softer compared to the control whereas the 11 sprayed sample is harder than the control. The lower particles size leads to greater surface area thereby causing more interactions of reactive components with gluten. This leads to adverse effects when reducing the particle size. Therefore, the four sprayed samples are softer with increased sweetness [24].
b. Rice
Control: One broad peak is observed between 14.0˚ and 21.0˚, comprised by two prominent peaks at 15.4˚ and 18.2˚, the latter being the highest peak in the diffraction pattern. Following the most prominent peak is a minor peak at 20.2˚. One strong peak is also observed at 23.4˚. Other minor peaks are observed are at 2q=11.6˚ and 26.7˚. 3 sprayed sample: One broad peak is observed between 14.0˚ and 20.0˚. Two prominent peaks within this range are observed at 15.3˚ and 18.2˚. The latter serves as the highest peak in the diffraction pattern and is split at 17.3°. Following the most prominent peak is a minor peak at 20.3˚. One strong peak is outside the broad range is seen at 23.3˚. Other minor peaks observed are at 2q=26.7˚ and 30.8˚. 10 sprayed sample: One broad peak is observed between 14.0˚ and 21.0˚. Two prominent peaks within this range are observed at 15.3˚ and 18.2˚. The latter serves as the highest peak in the diffraction pattern and is split at 17.3˚. Following the most prominent peak is a minor peak at 20.3˚. One strong peak is outside the broad range is seen at 23.3˚. Other minor peaks are observed at 2q= 11.6˚ (Figure 4).
Figure 4.PXRD graph of rice.
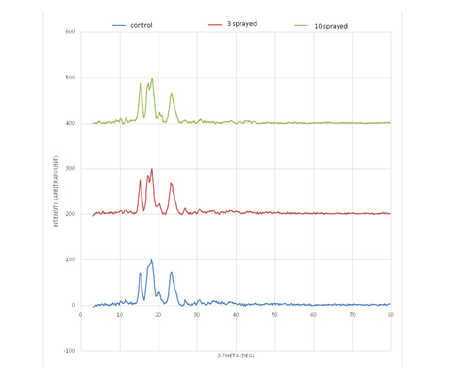
The ten sprayed sample has the greatest number of prominent peaks in its XRD profile among the three samples. One peak in the control splits in three sprayed and ten sprayed. Peak intensity around 15.3˚ increases with the increase in spraying. Peak around 26.7˚ in Control and 3 sprayed is absent in ten sprayed. This indicates change of crystalline phases present in samples with highest spraying. PXRD patterns of all the samples agree with the signature peaks of rice starch. Peaks at 15.0˚, 18.0˚ and 23.0˚ agree with the crystal pattern as observed by Ryoo et al. [25]. Mix of amorphous and crystalline phases is observed due to the semicrystalline nature of starch.
NMR
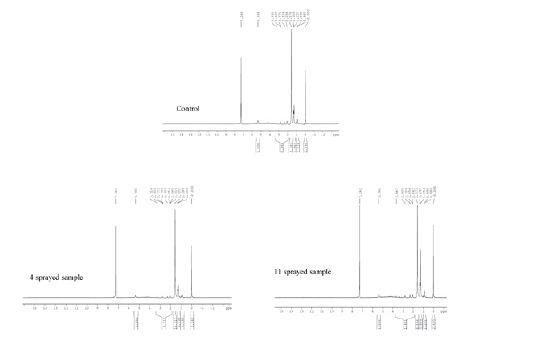
a. Wheat (1H-NMR): The 1H NMR spectra reveals the presence of a three-proton singlet at δ 2.2 for a CH3 group on an aromatic ring, two peaks each of three-proton intensity at δ0.9 for CH3. It also showsCH2 group at δ1.2. The CH3 group resonances are attributed to the different CH3 groups. The sharp peak at δ7.2 is due to the solvent (CDCl3).
In order to distinguish between the 3 subsamples, the peak integral of each sample was normalized. The number of CH3 groups is the same in all samples. However, the CH3 aromatic groups have apparently disappeared in the four sprayed samples upon spraying. The number of CH2 and CH groups slightly increased in the four sprayed sample as well. This suggests changes in the wheat sample upon spraying resulting in changes in its taste and form. The number of CH2 groups further changes upon 11 sprayings, however the CH3 aromatic groups remain the same as the control. (Figure 5) The number of CH2 groups gradually increases upon 4 and 11 sprayings compared to the control, suggesting breakage in the chemical structure.
Figure 5.1H-NMR of wheat.
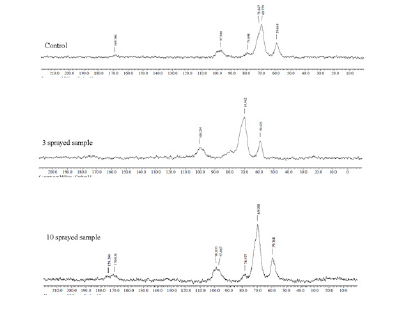
b. Rice (13C NMR): One of the main compositions of rice powder is carbohydrates and there is no significant change in the chemical shift of the ether at 59.668ppm in control, three and ten sprayed samples, we used this peak as a reference to normalize the integral values in all the three samples’ data sets. As can be seen in normalized peak integrals, with respect to the control sample, the monosaccharide (ribose) carbohydrate at 69.779ppm increases in value in the three sprayed sample. Whereas in the ten sprayed sample this integral drops again. This behavior may be interpreted as to 3 sprayed sample being more favorable than the control sample, and the ten sprayed sample being less favorable [26,27] (Figure 6).
Figure 6.1H-NMR of rice.
TEM a. Wheat
Control: Shows particles about 1 micron across that are of semi-rectangular shape with rounded edges. There are irregularly shaped particles that are about 300nm in length. 4 sprayed sample: shows particles of much smaller size (~0.25 microns) with a representative image revealing an irregularly shaped particle of about 300nm in length. 11 sprayed sample: The particles are about 0.25 microns (with some variation such as evidenced by an image showing a particle of about 500nm) compared to the control sample size of 1 micron (Figure 7).
With respect to the control both 4 and 11 sprayed samples show significant differences in the matrix structure, indicating that MIRGA spraying strongly affected the rice samples. In particular, MIRGA spraying has caused the loss of crystalline atomic arrangement (observed in the control, while both 4 and 11 sprayed samples have amorphous/microcrystalline structure) and determine an inhomogeneous and spread spatial arrangement of sample materials, with respect to the regular spatial distribution observed in control. This is confirmed also by the spatial arrangement of substrate materials (different from the nanoparticle component) to form a sort of curvy streams in the 4 sprayed sample and from the presence of aggregates in the 11 sprayed sample. Differences in the spatial arrangements of nanoparticles are also observed (clustered in the control and 4 sprayed samples, individually spread along sample surface in the 11 sprayed sample).
Figure 7.TEM Bright field images of wheat.
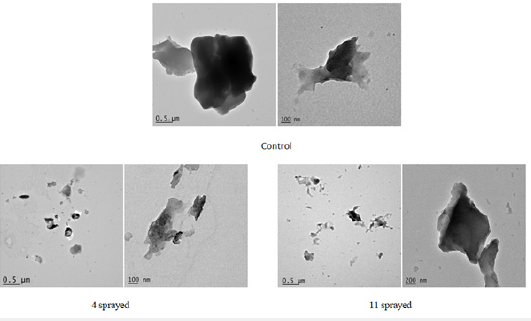
Figure 8.TEM Bright field images of rice.
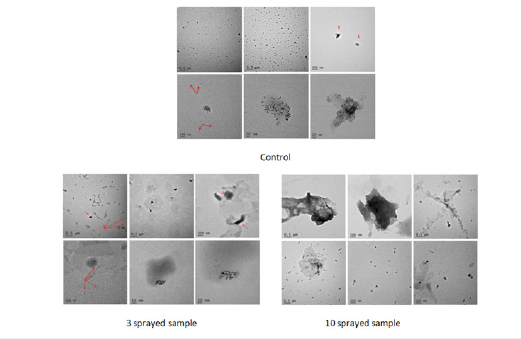
b. Rice: Compared to control, both three and ten sprayed samples show significant differences in the matrix structure, indicating that both three and ten sprayings strongly affect the rice sample. In particular, causing the loss of crystalline atomic arrangement (observed in the control, while both three and ten sprayed samples have amorphous/microcrystalline structure) and determine an inhomogeneous and spread spatial arrangement of sample materials, with respect to the regular spatial distribution observed in control. This is confirmed also by the spatial arrangement of substrate materials (different from the nanoparticle component) to form a sort of curvy stream in the three sprayed sample and from the presence of aggregates that seem to result from accumulation forcings, mainly in the ten sprayed sample. Differences in the spatial arrangements of nanoparticles are also observed (clustered in control and three sprayed samples, individually spread along sample surface in ten sprayed samples) (Figure 8).
MIRGA and its action on cereals
Invention background, definition, technique of mid-IR generation from MIRGA, toxicological study on MIRGA, safety of the MIRGA sprayed usables and primeval and future scope of MIRGA have been described by [6-9] (detailed discussion on MIRGA available in supplementary text T3).
The applied mid-IR coincides with frequencies of the target (cereals) caused chemical bond stretching and bending, structure alteration and chemical compound transformation [28-30] of wheat and rice. These changes influenced the variety of sensory traits prior/post cooking, cooking time (energy consumption) and nutritional parameters depending on the quantum of mid-IR applied (MIRGA spraying number) [31-34]. The mid-IR action is instantaneous, besides being economical, eco-friendly and easy to apply. Improvement of aroma in rice is an important requirement for which genetic manipulation is the only way. Similar desirable results in coffee, tea, cocoa, edible salts and terminalia were achieved using MIRGA spraying by [6-9].
Considering all the needed traits, constraints in science, commercial and pricing aspects, modern agriculture practices, safety, economy, user-friendly, preservation of natural germ plasm, now MIRGA is a better choice. Moreover, anybody from consumer level to kitchen to industry, MIRGA can be successfully employed. In terms of economy, the hand-held pocket sized MIRGA sprayer would be very economical and affordable even for the middleincome groups which is the major advantage than the other existing techniques of similar kinds.
Conclusion
This research revealed that 2-6μm mid-IR has altered the chemical bonds and morphology and formed chemical compounds in cereals, thereby enhancing the taste and aroma. In future research, the same testing can be conducted with millet. It is also possible to sow 2-6μm mid-IR treated seeds and cultivate types of cereals required for diseased patients and for other needs, by adapting present agricultural techniques without resorting to genetic manipulation.
Data and materials availability
All data is available in the manuscript and supplementary
materials.
Supplementary file: https://docs.google.com/document/
d/1SOmOmm4s1erh_gn87mkAlC7fE2MwAWBI/edit?usp=
sharing&ouid=111101387151809704391&rtpof=true&sd=true
References
- Pingali PL, Hossain M, Gerpacio RV (1997) Asian rice bowls: The returning crisis? CAB International, Wallinford, UK.
- Milica K, Biljana B, Dragana J (2021) Improvement of physiological performance of selected cereals by modulating pregerminative metabolic activity in seeds. Cereal Research Communications.
- Toor F, Jackson S, Shang X, Arafin S, Yang H (2018) Mid-infrared lasers for medical applications: Introduction to the feature issue. Biomed Opt Express 9(12): 6255-6257.
- Pereira MF, Oleksiy S (2011) Terahertz and mid infrared radiation generation, detection and applications, Springer Dordrecht, Berlin, Germany.
- Aboud S, Ammar A, Asaad AH, Yi-Chen L, Francesco C, et al. (2019) A comprehensive review on infrared heating applications in food processing. Molecules 24(22): 4125.
- Umakanthan, Mathi M (2022) Decaffeination and improvement of taste, flavor and health safety of coffee and tea using mid-infrared wavelength rays. Heliyon 8(11): e11338
- Umakanthan T, Mathi M (2023) Quantitative reduction of heavy metals and caffeine in cocoa using mid-infrared spectrum irradiation. Journal of the Indian Chemical Society 100(1): 100861.
- Umakanthan T, Mathi M (2023) Increasing saltiness of salts (NaCl) using mid-infrared radiation to reduce the health hazards. Food Science & Nutrition 11(6): 3535-3549.
- Umakanthan, Madhu M (2023) Potentiation of Siddha medicine using Muppu (Universal Potentiator). International Journal of Pharmaceutical Research and Applications 8(4): 2070-2084.
- Tishkevich DI, Korolkov IV, Kozlovskiy AL, Anisovich M, Vinnik DA, et al. (2019) Immobilization of boron-rich compound on Fe3O4 nanoparticles: Stability and cytotoxicity. J Alloys Compd 797: 573-581.
- Dukenbayev K, Korolkov IV, Tishkevich DI, Kozlovskiy AL, Trukhanov SV, et al. (2019) Fe3O4 nanoparticles for complex targeted delivery and boron neutron capture therapy. Nanomaterials 9(4): 494.
- Kozlovskiy AL, Alina A, Zdorovets MV (2021) Study of the effect of ion irradiation on increasing the photocatalytic activity of WO3 J Mater Sci Mater Electron 32: 3863-3877.
- El-Shater RE, Shimy HE, Saafan SA, Darwish MA, Zhou D, et al. (2022) Synthesis, characterization and magnetic properties of Mn nanoferrites. J Alloys Compd 928: 166954.
- Kozlovskiy AL, Zdorovets MV (2021) Effect of doping of Ce4+/3+ on optical, strength and shielding properties of (0.5-x) TeO2-0.25MoO-0.25Bi2O3-xCeO2 Mater Chem Phys 263: 124444.
- Almessiere MA, Algarou NA, Slimani Y, Sadaqat A, Baykal A, et al. (2022) Investigation of exchange coupling and microwave properties of hard/soft (SrNi0.02Zr01Fe11.96O19)/(CoFe2O4) x nanocomposites. Mat Today Nano 18: 100186.
- Everitt M (2009) Consumer-targeted sensory quality. Global Issues in Food Science and Technology, Chapter 8, Academic Press, Massachusetts, USA, pp.117-128.
- Wichchukit S, Mahony OM (2015) The 9-point hedonic scale and hedonic ranking in food science: Some reappraisals and alternatives. Journal of the Science of Food and Agriculture 95(11): 2167-2178.
- Singh V, Hiroshi O, Hidechika T, Seiichiro I, Kenichi O (2000) Thermal and physicochemical properties of rice grain, flour and starch. Journal of Agricultural and Food Chemistry 48(7): 2639-2647.
- Chaiwanichsiri S, Thumrongchote D, Suzuki T, Laohasongkram K (2012) Properties of non-glutinous Thai rice flour: effect of rice variety. Research Journal of Pharmaceutical Biological and Chemical Sciences pp.1-15.
- IR spectrum table by frequency range, Sigma Aldrich.
- Rice flour, Ingredients101.com, All National Grain & Feed Association, Virginia, USA.
- Jiamjariyatam R (2016) Development of ready-to-eat rice starch-based puffed products by coupling freeze-drying and microwave. International Journal of Food Science & Technology 51(2): 444-452.
- Gontard N, Ring S (1996) Edible wheat gluten film: Influence of water content on glass transition temperature. Journal of Agricultural and Food Chemistry 44(11): 3474-3478.
- Noort M, Van Haaster D, Hemery Y, Schols HA, Hamer R (2010) The effect of particle size of wheat bran fractions on bread quality-Evidence for fibre-protein interactions. Journal of Cereal Science 52(1): 59-64.
- Ryoo N, Yu C, Park CS, Baik MY, Myoung P (2007) Knockout of a starch synthase gene OsSSIIIa/Flo5 causes white-core floury endosperm in rice (Oryza sativa L.). Plant cell Reports 26: 1083-1095.
- Badertscher M, Bühlmann P, Pretsch E (2009) Structure determination of organic compounds. Springer, Berlin, Germany.
- Martino HS, Bigonha SM, Cardoso LD, Rosa CD, Costa NM (2012) Nutritional and bioactive compounds of bean: Benefits to human health. ACS Symposium Series, Chapter 15, ACS Publications, Washington DC, USA, pp. 233-258.
- Tsai SR, Hamblin MR (2017) Biological effects and medical applications of infrared radiation. J Photochem Photobiol B 170: 197-207.
- Mohan J (2004) Organic spectroscopy: Principles and applications, (2nd edn), Alpha Science International Ltd Harrow, UK, p. 19.
- Xu R, Yan Xu (2017) Modern inorganic synthetic chemistry, (2nd edn) Elsevier BV, Amsterdam, Netherlands, p. 124.
- Atkins P, Juliode P (2011) Physical chemistry for the life sciences, Oxford University Press, Oxford, UK, p. 365.
- Yi GC (2012) Semiconductor nanostructures for optoelectronic devices: Processing, characterization and applications. Berlin Heidelberg: Springer-Verlag p198.
- Datta SN, Carl OT, Francesc I (2014) Theoretical and computational aspects of magnetic organic molecules, Imperial College Press, London, p. 224.
- Esmaeili K, Viremedy (2015) Homeopathic remedies and energy healing remedies as information-including remedies, A Synopsis Google Books, p. 43.
© 2024 Umakanthan T. This is an open access article distributed under the terms of the Creative Commons Attribution License , which permits unrestricted use, distribution, and build upon your work non-commercially.
 a Creative Commons Attribution 4.0 International License. Based on a work at www.crimsonpublishers.com.
Best viewed in


.jpg)


 Editorial Board Registrations
 Submit your Article
 Refer a Friend
 Advertise With Us
.jpg)


.jpg)


.bmp)
.jpg)
.png)
.jpg)


.jpg)


.png)

.png)


.png)


