- Submissions

Full Text
Novel Techniques in Nutrition and Food Science
Predictors of Fat Mass Index and Overweight/ Obesity Among Public and Private School- Going Adolescents in Hohoe, Volta Region, Ghana: A Cross-Sectional Study
Isaac Agbemafle1*, Philip Kofie1, Sandra Owusu1 and Manju B Reddy2
1Fred N Binka School of Public Health, University of Health and Allied Sciences, Ghana
2Department of Food Science and Human Nutrition, Iowa State University, USA
*Corresponding author:Isaac Agbemafle, Fred N Binka School of Public Health, University of Health and Allied Sciences, PMB 31, Ho, Volta Region, Ghana
Submission: November 23, 2022;Published: December 16, 2022

ISSN:2640-9208Volume6 Issue5
Abstract
Childhood obesity may lead to obesity in adolescent and adulthood and has serious public health consequences. Therefore, this study sought to determine the predictors of overweight/obesity among School-Going Adolescents (SGAs) in Hohoe, Volta region, Ghana to inform health promotion and policies. This was a cross-sectional study among 400 SGAs aged 10-19 years. A pre-tested, semi-structured questionnaire was used to obtain information on background characteristics, eating patterns and Physical Activity (PA). Weight and height were measured following standard procedures and transformed into z-scores using WHO Anthro+. Percentage Body Fat (%BF) and Fat Mass Index (FMI) were determined using Omron® body composition monitor. Regression models were used to determine predictors of FMI and overweight/obesity. The mean age was 15±2 years, 56.8% were females, 52.0% attended private schools and 63% ate 3X daily but breakfast was the most skipped meal (26.0%). Overweight/obesity prevalence was 15.1%. Mean %BF and FMI were 18.61±10.83 and 3.81±2.30. Sex, school type, weight and fat-free mass were significant predictors of FMI. Daily moderate PA>30 minutes and vigorous PA>60 minutes decreased adolescents’ odds of being overweight/obesity by 67% and 63% respectively compared to PA time≤30 minutes (p=0.01). Playing at school is protective against adolescent overweight/ obesity (AOR=0.34; 95%CI=0.12-.94; p=0.04). Playing at school attenuated the possible effect of school type on adolescents’ odds of being overweight/obese. Increasing PA at or outside the school should be encouraged to curtail the upsurge of overweight/obesity among adolescents.
Keywords: Overweight/Obesity; Percent body fat; Fat-free mass index; Fat mass index; Waist-to-hip ratio; School-going adolescents; Ghana
Abbreviations: FFMI: Fat-Free Mass Index; FMI: Fat Mass Index; SES: Socio-Economic Status; VPA: Vigorous-Intensity Physical Activity; MPA: Moderate Physical Activity; TPAL: Total Physical Activity Level
Introduction
Childhood obesity is likely to generate into the adolescent years of a child and is a serious public health challenge of the twenty-first century affecting both developing and developed countries alike. Obesity which could be described as adiposity above normal levels is not exclusive to adults. In children and adolescents, a Body Mass Index (BMI) for age z-score (BAZ) between ≥85th and <95th percentile for age and gender is classified as overweight and ≥95th percentile is obesity [1]. Globally, an estimated 33.3 million (5.7%) children under five years were overweight in 2020 and half of these rising trends in childhood overweight are becoming prominent in developing countries [2,3]. Available data shows that up to 80% of children affected by obesity will continue to be affected by obesity in adulthood [4]. A 34-country comparison showed that rates of childhood and adolescent obesity is increasing in nearly every country with developing countries having a greater share of the burden [5]. An analysis of 160 nationally representative surveys from 94 developing countries showed an increasing prevalence of overweight and obesity from childhood to adulthood [6]. Among School- Going Adolescents (SGAs) in seven African countries, overweight prevalence ranged from 8.7% in Ghana to 31.4% in Egypt [7]. According to a 2022 nationally representative demographic and health survey data from 33 sub-Saharan African countries, the prevalence of overweight/obesity among children under 5 years was estimated at 5.1% [8]. Although there is no nationally representative data on overweight/obesity among SGAs in Ghana, adult overweight and obesity prevalence increased from 25% in 2003 to 40% in 2014 [9]. A 2016 meta-analysis also indicated 43% of Ghanaian adults are overweight/obese [10]. As more overweight/obese children and adolescents grow into adulthood, the burden of overweight/obesity will increase with numerous noncommunicable diseases. The combined medical costs associated with treatment of these obesity-related co-morbidities are estimated to increase by $48-66 billion/year in the US and by £1·9- 2 billion/year in the UK by 2030 [11]. Although current estimates of the healthcare cost of obesity-related co-morbidities is not available for developing countries, it can be projected that this will have a significant toll on these developing economies and further worsen the flight of its populace. Indeed, this increasing healthcare morbidity and cost will potentially shorten disability-adjusted life years in the current generation of children and adolescents in later life particularly for developing countries. Today, children and adolescents in developed and developing countries are less physically active and more exposed to unhealthy food choices and poor eating practices than were previous generations. Available statistics from the US indicates that between 1969 and 2001, the number of adolescents walking to school decreased from 41.6% to 15.2% [12]. Displacing physical activity with sedentary lifestyles such as watching television and computer gaming has increased over the years among children and adolescents and it has been documented that an additional hour of television per day increases the prevalence of obesity by 2% in US children [13] and 22-28% in Spanish children [14]. Interestingly, the number of hours children and adolescents spend watching television correlates with their consumption of the most advertised foods, including sweetened cereals, sweets, sweetened beverages, fatty foods, and salty snacks [15]. Identifying locally specific causes and reinforcement of healthy diets, physical activity, and other healthful behaviours that tackles the root causes of overweight/obesity are paramount during the childhood and adolescent years. The home and school are a critical part of the social environment that shape children’s eating and physical activity patterns and therefore can play an integral role in a long-lasting positive change in attitude. In Ghana, a child spends between 25-45% of the 24 hours in a day in school. Hence, this study sought to determine the factors in the home and school which predisposes SGAs to overweight/obesity in Hohoe, a peri-urban settlement in the Volta region, Ghana. Identifying the predictors of adolescent overweight/obesity is relevant for health promotion and education in Ghanaian schools. To the best of our knowledge, we have attempted to describe for the first time the use of Fat-Free Mass Index (FFMI) and Fat Mass Index (FMI) in a Ghanaian sample of SGAs. This is because BMI which is widely used in most epidemiological studies does not account for the actual composition of body weight, hence several researchers have called for the reappraisal of the concept of FFMI and FMI [16-18].
Methods
Design and setting
This was a cross-sectional study conducted among SGAs aged 10-19 years in Hohoe, the capital of the Hohoe Municipality in the Volta region, Ghana. Hohoe Municipality has previously been described [19] and has received considerable attention in the scientific literature in the last ten years due to the establishment of the Fred N. Binka School of Public Health of the University of Health and Allied Sciences in the municipality. There are 76 Junior High Schools (JHS) in Hohoe municipality, 55 are government-owned (public) and 21 are individually owned (private) schools. Public JHS have a population of about 6024 and the private is about 1512 students. There are about 3303 males and 2721 females in public JHS whereas about 754 males and 758 females are in private JHS. In Hohoe township there are 16 public and 16 private JHS. The public JHS in Hohoe township has a population of 2944 students composed of 1575 males and 1369 females. The private JHS in Hohoe township have a total student population of about 1189 composed of about 583 males and 606 females.
Sample size and sampling
Assuming a z-statistics of 1.96 at 95% confidence level and 5% margin of error, a sample size of 384 was calculated using the sample size calculation formular by Moore & McCabe [20]. The sample size was increased to 400 to annul the possible effect of non-response rate. A multi-stage sampling method was used in the selection of the participating schools in which the sampling strata was public and private JHS. A simple random sampling method was used in selection of six schools with equal number of schools selected in each stratum. Furthermore, a simple balloting method was used to select approximately 25 students per class (JHS form 1, 2 and 3) in the participating schools. The JHS in Hohoe admit adolescents from every part of the municipality and country. The characteristics of participants is comparable to students in other JHS within the Hohoe Municipality and outside the municipality. Consenting students, aged 10-19 years as per the definition of World Health Organization (WHO) for adolescents were recruited as study participants. Pregnant and sick adolescents or those >19 years or <10 years old were excluded from the study. Informed consent was obtained from adolescents and their parent or class teacher.
Ethical approval
Ethical approval for the study was sought from the Ghana Health Service (GHS) Ethics Review Committee (GHS-ERC: 34/02/16). Permission was also sought from the Hohoe Municipal education directorate and the headmasters of the participating schools. Participation was voluntary and adolescents were assured confidentiality and anonymity that under no circumstance will their names and other details be linked to the data analysis and dissemination of study findings. Data management, storage, analysis, and reporting were done in formats that did not expose the details of participants by using randomly generated codes.
Data collection
Information on the socio-demographic characteristics, eating behaviour and physical activity were obtained through a face-to-face interview using a pretested, semi-structured questionnaire. Information on ownership of household items was used to determine Socio-Economic Status (SES) of household of the adolescent. Questionnaire was administered using trained research assistants and all equipment used for anthropometric measurements were calibrated before use. Anthropometric data on waist and hip circumference, weight and height were measured twice following WHO standard procedures [21] and the average recorded to the nearest 1 decimal place. To measure percentage body fat (%BF), the body composition monitor (Omron, Hoffman Estates, IL) was mounted on a level ground, and height, age and gender of the participant was keyed in. The participant wearing minimal clothing mounted the equipment with cleaned and dried feet. The weight, BMI and %BF were measured in duplicate and the average recoded to the least count of the equipment. The measurement was repeated a third time if the two measurements differed by 0.10. Information on Physical Activity (PA) was obtained using the Global Physical Activity Questionnaire (GPAQ) [22] with slight modifications. Briefly, the type of PA was coded as: 1=walking; 2=Moderate-Intensity Physical Activity (MPA) and 3=Vigorous- Intensity Physical Activity (VPA). The number of days and time for which PA was performed was categorized based to the GPAQ recoding guidelines. Days of the week for which PA was performed was categorized as: 1= once per week; 2=2-4 days per week; and 3=5-7 days per week. Time spent on activity for a continuous duration was rated as: 1=≤30 minutes, 2=31-60 minutes; 3=>60 minutes. The type of activity, duration and days of PA were multiplied to obtain the Total Physical Activity Level (TPAL).
Statistical analysis
Body mass index for age (BAZ) were generated using WHO Anthro+. There were no flag records for BAZ. Overweight/obesity was defined as BAZ >+2SD [21]. Waist-To-Hip Ratio (WHR) was calculated by dividing waist circumference by hip circumference. Fat Mass (FM) was calculated by multiplying the %BF by weight. Fat-Free Mass (FFM) was calculated by [Weight (kg)x(1.0-(Body fat %/100))]. Fat Mass Index (FMI) and Fat-Free Mass Index (FFMI) was calculated as stated by Schutz et al. [18] and classified as reported by McManus and Mellecker [23]. Permutations of the type of PA, duration and days of PA yielded the following products for TPAL: 1, 2, 3, 4, 6, 8, 9, 12, 18 and 27, which were categorized based on American Heart Association (AHA) recommendations [24]. Data was coded and entered in SPSS version 20.0 (Armonk, New York, USA) for analysis. Descriptive statistics was performed for the background characteristics. Differences between groups were determined using cross tabulation generating chi-square test for categorical variables which are reported using frequencies and proportions. Independent sample T-test was used to determine differences between continuous variables and dichotomous variables such as age, sex, and school type. A multiple linear regression model was run to predict FMI. A binary logistic regression was used to determine the predictors of overweight/obesity. The dependent variable was overweight/obesity which was classified as either present or absent. The independent variables were the background characteristics, dietary habits, and physical activity. Significance was set at p<0.05.
Results
General characteristics and associations between variables
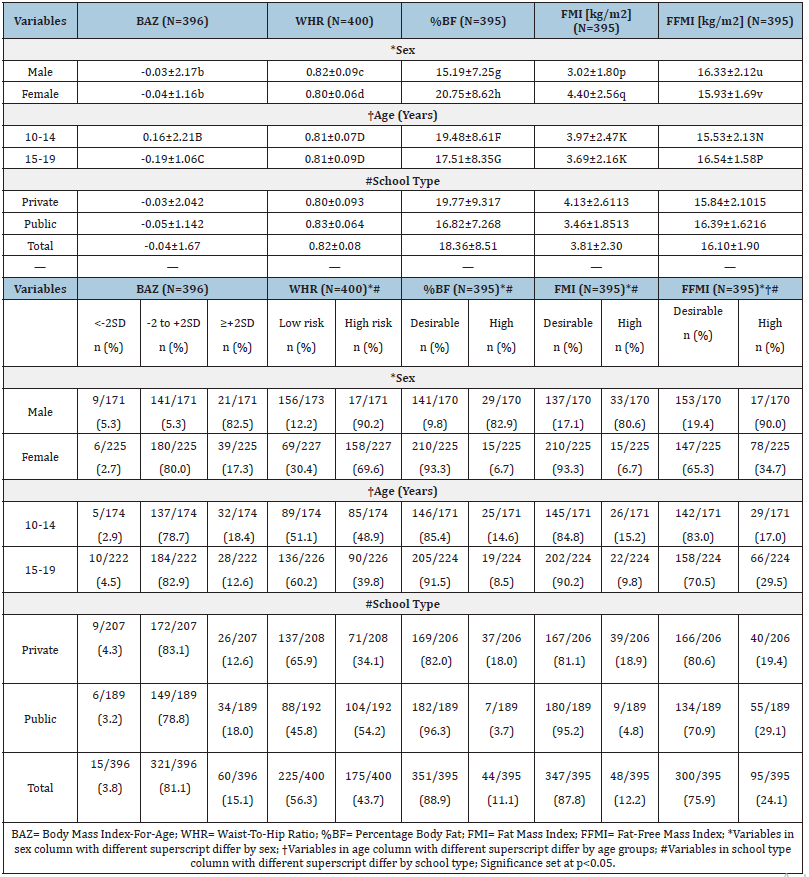
A total of 400 SGAs participated in this study. The mean age was 15±2 years, 56.8% were females, 52.0% attended private schools (Table 1) and 63% ate 3X daily but breakfast was the most skipped meal (26.0%; Figure 1A). Watching television was the most common lifestyle practice (Figure 1B). The most frequently reported time for any form of physical activity was 30 minutes (Table 1). TPAL score indicated that 57% of the adolescents were physically inactive (Table 1). The proportion of boys who played at school, walked for a longer time, and engaged in vigorous physical activity were significantly higher compared to girls and this was also higher in adolescents attending public compared to private schools (p<0.015; Table 2). More boys than girls played video games and SES was higher in private than public schools (p<0.0001; Table 2). There were no significant associations between skipping breakfast, snacking, MPA and TPAL by sex or school type. The mean BAZ, WHR, %BF, FMI and FFMI were -0.04±1.67, 0.82±0.08, 18.36±8.51%, 3.81±2.30 and 16.10±1.90 respectively and this was significantly different by sex and school type except for BAZ (Table 3). FMI and %BF were significantly higher in girls than boys and in private than public schools while FFMI was higher in boys than girls and in public than private schools. The proportion of adolescents with normal FMI: FFMI was significantly higher in public than private schools (Figure 2).
Table 1:Background characteristics and physical activity profile of school-going adolescents in Hohoe (N=400).
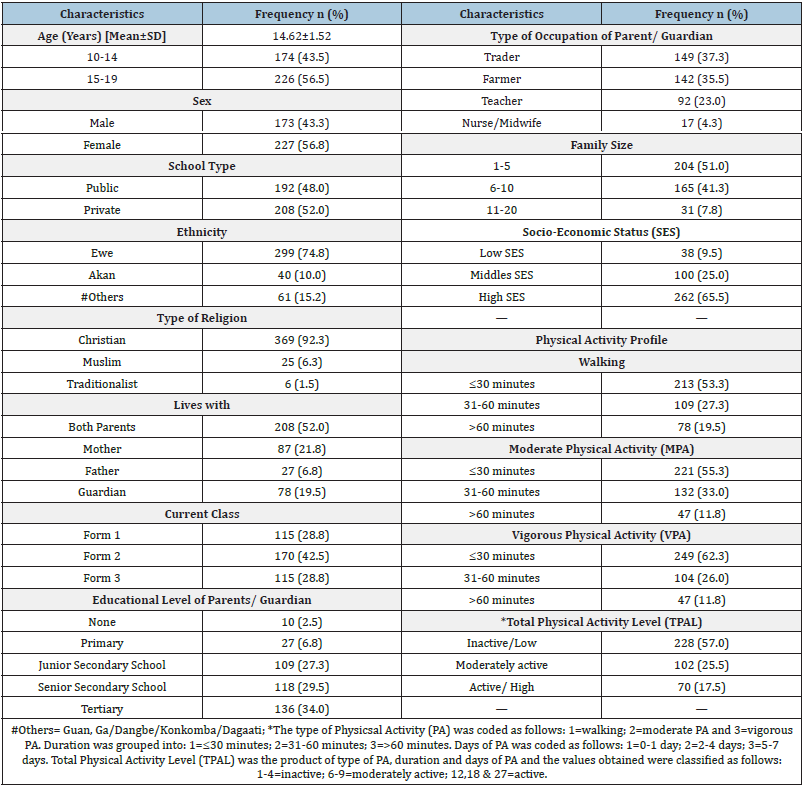
Figure 1A.Eating habits of school-going adolescents in Hohoe.
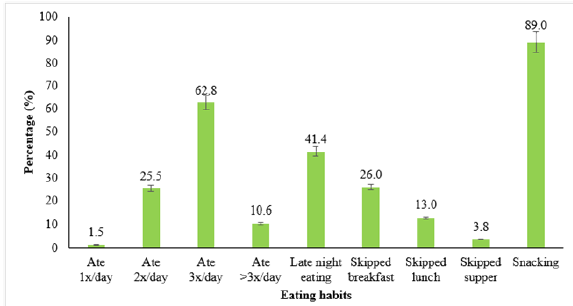
Figure 1B.Lifestyle practices of school-going adolescents in Hohoe.
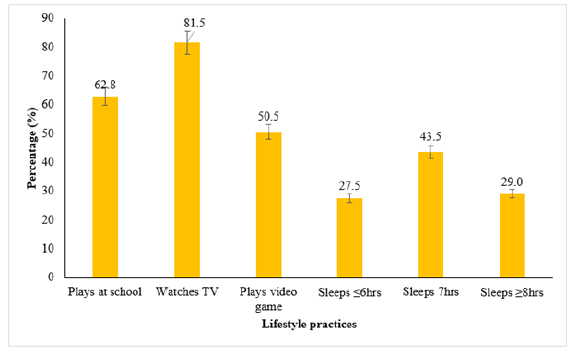
Figure 2.Comparative analysis of body mass index among school-going adolescents by school type.
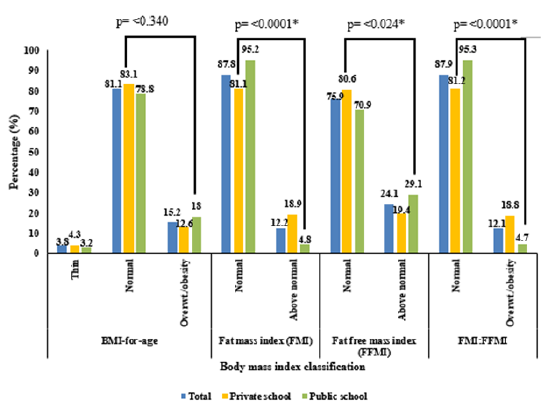
Table 2:Association between sex and type of school, background characteristics and physical activity profile of schoolgoing adolescents in Hohoe (N=400).
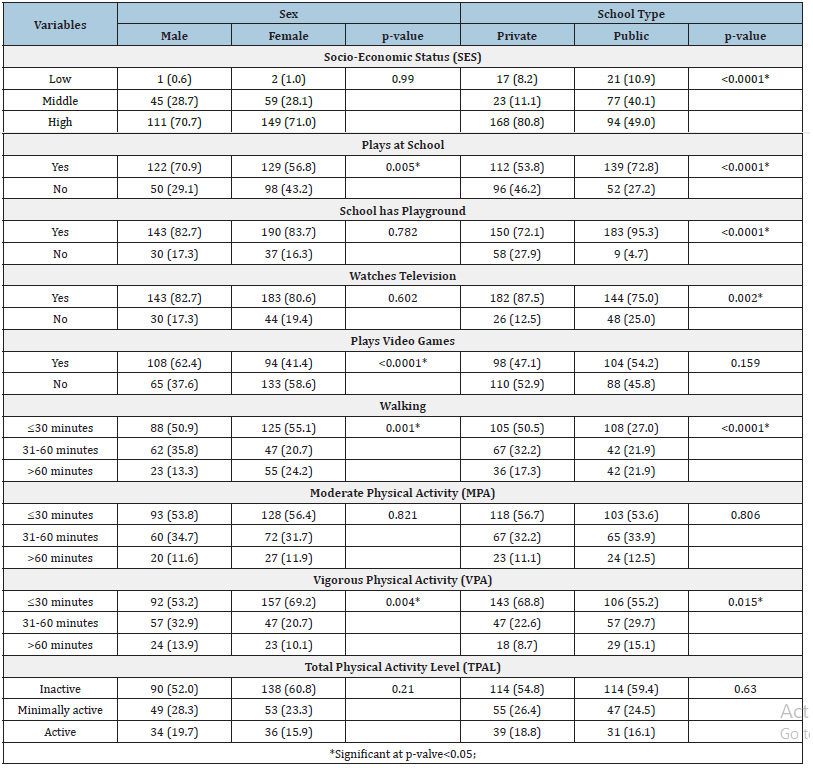
Table 3:Associations between sex, age, school type and anthropometric profile of school-going adolescents in Hohoe.
Predictors of FMI and overweight/obesity among SGAs
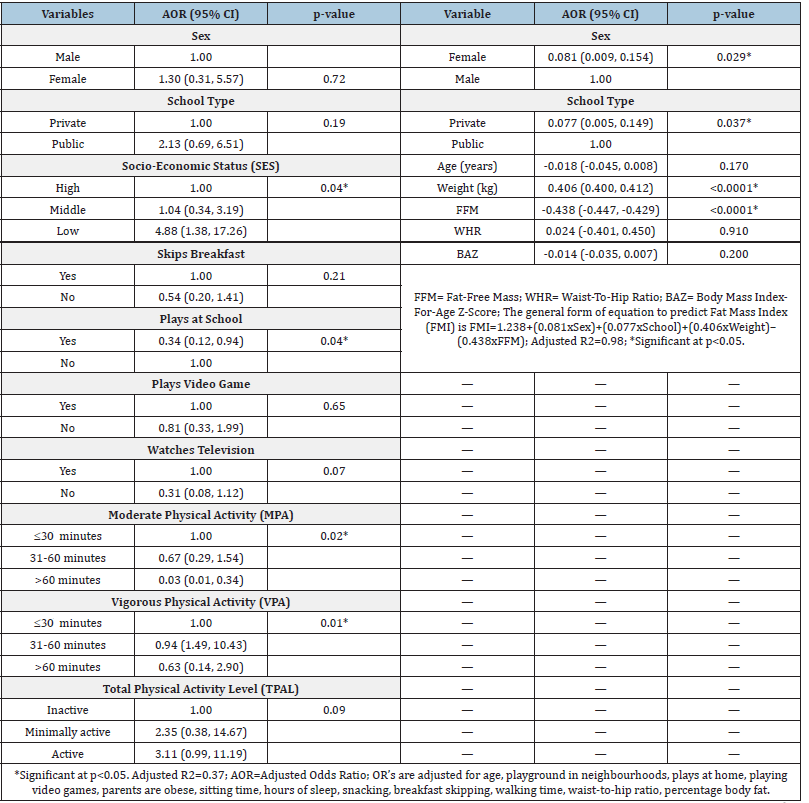
The predictors of FMI were school type, weight, sex and FFM [F (8,382)=2395.90, p<0.0001, R2=0.98, Table 4]. All four variables added statistical significance to the prediction and the general form of the equation is FMI=1.238+(0.081xSex)+(0.077xSchool)+(0.406xWeight)– (0.438xFFM). For a unit increase in weight (kg), there is a 0.406kg/ m2 increase in FMI whiles for a unit increase in FFM, there is a 0.438kg/m2 decrease in FMI (Table 4). Being a girl compared to a boy increased an adolescents’ FMI by 0.081kg/m2 and attending a private school compared to a public school increased an adolescents’ FMI by 0.077kg/m2 (Table 4). SES, MPA, VPA, and playing at school predicted an adolescent’s odds of being overweight/ obese. Adolescents who belonged to a low SES were 4.88 times more likely to be overweight/obese compared to adolescents in high SES household (p=0.04; Table 4). Daily MPA>30 minutes decreased an adolescent’s odds of being overweight/obese by 67% compared to MPA30 minutes (AOR=0.67; 95%CI=0.29, 1.54; p=0.02; Table 4). Daily VPA>60 minutes decreased an adolescent’s odds of being overweight/obese by 63% compared to VPA 30 minutes (AOR=0.63; 95%CI=0.14, 2.90; p=0.01; Table 4). Playing at school was protective against overweight/obesity (AOR=0.34; 95%CI=0.12, 0.94; p=0.04; Table 4).
Table 4:Determinants of overweight/obesity and fat mass index among school-going adolescents in Hohoe.
Discussion
General characteristics and associations between variables
Higher education increases wealth quintile and income levels of households; hence the type of school parents/guardians send their wards to. In agreement with a previous study in northern Ghana [25], the SES of the household that the adolescents belonged to correlated with the level of education of the household head and which type of school the adolescent attends. This is because, private schools in Hohoe municipality pay termly fees that could be ten times the amount public schools pay or attend for free. The huge disparity in termly fees is a drawback to parents who have little or no formal education since their income level is just below or above the poverty line and cannot afford to pay these high tuition fees at the expense of their meagre erratic household incomes, a greater part of which is used for housekeeping. Consistent with a similar study in Northern Ghana [25] and Nigeria [26], breakfast was the most skipped meal, and this pattern was not different by school type. Time between waking up and amount of house chores before school may predict the adolescents’ likelihood of skipping breakfast compared to other meals of the day. Also, most adolescents are likely to skip breakfast if its preparation will interfere with the time they must report to school because lateness to school is often punished. As reported in this study and among adolescents in Nigeria, the skipping of breakfast may be compensated for by snacking at school which is likely to increase their risk for overweight/obesity and its co-morbidities [27]. In an attempt to document PA habits, we obtained self-reports of the adolescents on the type, duration and frequency of PA and compared it with the AHA recommendation for adolescents [24]. In agreement with a previous study in Northern Ghana [25] and Brazil [28], walking to school was the most common PA among SGAs in Hohoe. The beneficial effects of walking may not be fully harnessed among the adolescents who walk shorter distances in reporting to and from school compared to their colleagues in northern Ghana who cover relatively longer distances to school. Thus, the contribution of walking to and from school to TPAL may be low on school days and throughout the year, a finding consistent with another study among Iran school children aged 7-18 years [29]. Based on the AHA recommendation, we posit that walking for these adolescents may be beneficial if it is done briskly and for at least 60 minutes. Current PA recommendations of at least thirty minutes daily walking in Ghana as part of the Ghana Health Service (GHS) regenerative health policy can only maintain health-related fitness but does not have the propensity to curb the increasing overweight/obesity trends among all ages of the Ghanaian population particularly adolescents, hence the need for school health education to promote longer duration of PA. Adolescents spent most of their waking hours in school, hence the availability of regular PA and PA space is crucial in school settings. Adolescents in this study and those in a study conducted in Canada [30] showed that they are more likely to play at school due to the availability of PA space. Unlike the Canadian study which did not examine differences by school type, this study showed that adolescents in private schools were more sedentary compared to their colleagues in the public schools due to little or no PA space availability. Although PA space is an important element of the built environment, encouraging PA cannot just happen in one place- it needs to happen in or outside the school and home. At home, it is possible that PA is been displaced by television watching, video gaming and other screen time activities as reported by the adolescents in this study and in other studies [30]. If these adolescents continue to be physically inactive, then they are likely to become physically inactive in adulthood and the overweight/obesity prevalence will continue to increase. The increasing prevalence of overweight/obesity among children and adolescents has led to numerous research in this area due to its public health consequences [16-18]. For children and adolescents, overweight/obesity is classified using BAZ based on the WHO-2007 growth standards, but individual children do not grow necessarily according to these growth standards [31]. The shortcomings of the WHO-2007 classification influenced the inclusion of FMI and FFMI in this study as proposed by previous researchers [16-18]. In this study, there were no differences in prevalence of overweight/ obesity using the WHO-2007 and FMI or FFMI classification. However, using the FMI or FFMI classification can help one judge whether the deficit or excess of body weight is selectively due to a change in FMI vs FFMI or both [32]. Although BAZ were similar for boys and girls, FMI and FFMI differed greatly by sex, a finding corroborating previous studies among Caucasians adolescents [16- 18]. In boys, FFMI increased with age whilst both FMI and FFMI increased with age in girls and this is in keeping with previous studies [16,17] but contrary to another [18]. An explanation for this observation is that older boys increase faster in FFM than younger boys and experience a decrease in FM compared to girls based on differences in physiological make-up. Also, the increase in FFMI with age in these adolescents may contribute to “adiposity rebound” as suggested by other investigators [17]. Although FMI, FFMI and %BF compares well with a similar study among SGAs in Brazil, the Brazilian study [33] did not compare private and public schools. Some possible explanations for the differences in FMI and FFMI between private and public schools are SES, playing at school, availability of school playground, lifestyle practices (watching television, late night eating, hours of sleep, etc) and level of PA as these variables were significantly different by school type. The %BF was higher in girls than in the boys and this agrees with previous studies [16,17]. These differences reflect physiological development, as girls gain more body fat while boys gain more muscle mass during puberty because of the drastic hormonal changes that induce important modifications in growth, bone mass, and body composition [34]. The increase in %BF is true for girls who gain and deposit more adipose tissue around the thighs and buttocks than boys who deposit adipose tissue around the abdomen. Due to this regional fat distribution, we expected WHR to show little variation by sex when compared to %BF, FMI and FFMI and this is confirmed by a previous study among Caucasian school children [16].
Predictors of FMI and overweight/obesity among SGAs
The overweight/obesity prevalence was about twofold the value reported from a previous study in the Volta region, Ghana [19]. This may be due to differences in inclusion criteria, study site selection and year of data collection. Nonetheless, the present overweight/ obesity prevalence collaborated similar research in the Ashanti region, Ghana and southern Ethiopia which reported an overweight prevalence of 12.2% and 12.9% [35,36]. The overweight/obesity prevalence was lower compared to SGAs in US and Canada [13,37] and in Egypt, Morocco, and Mauritania [7], and higher compared to Benin and Malawi [7]. The difference could be due to the type of classification methods used but importantly the SES between these countries and Ghana, which is a low-middle income country undergoing the nutrition transition. Consistent with previous studies [6,23], sex, school type, weight and FFM were significant predictors of FMI. Also, SES, playing at school, MPA and VPA significantly predicted an adolescents’ odds of being overweight/ obese. VPA was the most protective factor against adolescent overweight/obesity, and this is in consonance with a 2015 study among university students in northern Ghana in which VPA reduced abdominal obesity risk by 30% [38]. To curb the present overweight/obesity menace among adolescents and decrease the burden of non-communicable diseases in later life, physical activity regimes among Ghanaian children and adolescents should go beyond just walking to include VPA. Corroborating other authors [39], playing at school is protective against being overweight/obese and it is an important concept in obesity prevention. Factors that may increase the development of effective strategies for obesity prevention in these SGAs may be associated with the activation of critical genes for fat metabolism [40]. PA has been shown to increase the anti-aging gene Sirtuin 1 that may reverse obesity [40]. Thus, Sirtuin 1 activators should be considered as effective strategies against obesity in developing countries. There is also evidence from a review of school-based cross-sectional studies of a modest association between PA and lower BMI [39]. This suggest that an increase in school-based PA alone may not be sufficient to reverse the current obesity trends. Adolescents can increase their PA levels in many other ways during school and non-school hours, including active walking, unorganized outdoor free play, personal fitness, recreational activities, and organized sports. Interestingly, sex differences should be considered when encouraging adolescents to increase PA as evident in this study and by others [37,38]. Available evidence indicates that exposure to television and video games might impact body weight by promoting snacking behavior and adverse dietary practices that increases energy intake [37]. These additional factors make television viewing and video gaming potentially more insidious a risk factor for childhood obesity, but its effect was not observed in this study probably because energy intake may not be significantly altered during these leisure time activities among these adolescents. Nonetheless since time is finite, every hour spent watching television or video gaming is a missed opportunity to be physically active. Finally, cross-sectional, and longitudinal studies have shown that skipping breakfast is linked to increased risk of overweight/obesity [41], but this was not observed here probably because fewer SGAs skipped breakfast.
Limitations of the Study
This was a cross-sectional study, hence does not allow examination of casual inference between socio-demographic, lifestyle behaviours and overweight/obesity. This study did not measure actual dietary intake thus, the reported overweight/obesity prevalence cannot be associated with dietary intake. Moreover, the findings cannot be generalized to non-schooling adolescents who may have different socio-demographic characteristics compared to SGAs. There is possibility of recall and social desirability bias on sedentary and PA behaviours, and we tried to overcome this by probing. We urge other investigators to consider evaluating the rapidly changing nutritional and social environment as well as dietary patterns and pedometer determined steps in future studies of overweight/obesity in Ghana.
Conclusion
Sex, school type, weight and FFM were significant predictors of FMI among SGAs in Ghana. SES, MPA, VPA and playing at school decreased an adolescents’ odds of being overweight/obese in Ghana. Increasing levels of PA attenuated the possible effect of school type on an adolescents’ odds of being overweight/obese. Increasing PA time at or outside the school should be encouraged to curtail the upsurge of overweight/obesity among SGAs in Ghana. Understanding the interrelationship between these factors may enhance the development of effective strategies for overweight/ obesity prevention among children and adolescents in Ghana and other African countries.
What is Already Known on this Topic
a. There is higher prevalence of overweight/obesity among
children and adolescents attending private schools compared to
those attending public schools.
b. Physical activity is protective against being overweight/
obese.
What this Study Adds
a. Increasing levels of physical activity attenuated the
possible effect of school type on an adolescents’ odds of being
overweight/obese.
b. Except for walking, moderate physical activity, vigorous
physical activity and playing at school decreased an adolescents’
odds of being overweight/obese.
Authors’ Contributions
Isaac Agbemafle and Manju B. Reddy conceived the study. Philip Kofie, and Sandra Osei were responsible for data collection and entry. Isaac Agbemafle, Philip Kofie, and Sandra Osei were responsible for data analyses. Isaac Agbemafle, Philip Kofie, Sandra Osei and Manju B. Reddy contributed literature review. Isaac Agbemafle drafted the manuscript. All authors read and approved the final manuscript.
Acknowledgement
We thank the adolescents who participated in this study and the heads of the participating schools for allowing us to use the school premises for data collection.
References
- WHO (2012) Childhood obesity prevention. Int J Obes 23: s44-s45.
- FAO, IFAD, UNICEF, WFP, WHO (2022) The State of Food Security and Nutrition in the World. FAO, Italy.
- Cesare DM, Sorić M, Bovet P, Miranda JJ, Bhutta Z, et al. (2019) The epidemiological burden of obesity in childhood: A worldwide epidemic requiring urgent action. BMC Med 17(1): 212.
- Simmonds M, Llewellyn A, Owen CG, Woolacott N (2016) Predicting adult obesity from childhood obesity: A systematic review and meta-analysis. Obes Rev 17(2): 95-107.
- Guthold R, Cowan MJ, Autenrieth CS, Kann L, Riley LM (2010) Physical activity and sedentary behavior among schoolchildren: A 34-country comparison. J Pediatr 157(1): 43-49
- Onis MD, Blössner M (2000) Prevalence and trends of overweight among preschool children in developing countries. Am J Clin Nutr 72(4): 1032-1039.
- Manyanga T, El-Sayed H, Doku DT, Randall JR (2014) The prevalence of underweight, overweight, obesity and associated risk factors among school-going adolescents in seven African countries. BMC Public Health 14: 887-898.
- Ayele BA, Tiruneh SA, Ayele AA, Zemene MA, Chanie ES, et al. (2022) Prevalence and determinants of overweight/obesity among under-five children in sub-Saharan Africa: A multilevel analysis. BMC Pediatr 22(1): 585.
- GSS, GHS, ICF (2014) Ghana Demographic and Health Survey. Rockville, Maryland, USA.
- Asenso RO, Agyeman AA, Laar A, Boateng D (2016) Overweight and obesity epidemic in Ghana-A systematic review and meta-analysis. BMC Public Health 16(1): 1239-1257.
- Wang YC, McPherson K, Marsh T, Gortmaker SL, Brown M (2011) Health and economic burden of the projected obesity trends in the USA and the UK. The Lancet 378(9793): 815-825.
- McDonald NC (2007) Active transportation to school: trends among US schoolchildren, 1969-2001. Am J Prev Med 32(6): 509-516.
- Anderson PM, Butcher KF (2006) Childhood obesity: trends and potential causes. Future Child 16(1): 19-45.
- Rodríguez GV, López JPR, Matillas MM, Moreno LA, Wärnberg J, et al. (2008) Television watching, videogames, and excess of body fat in Spanish adolescents: The AVENA study. Nutrition 24(7-8): 654-662.
- https://www.who.int/news-room/fact-sheets/detail/healthy-diet
- Eissa MA, Dai S, Mihalopoulos NL, Day RS, Harrist RB, et al. (2009) Trajectories of fat mass index, fat free-mass index, and waist circumference in children: Project HeartBeat! Am J Prev Med 37(1): S34-S39.
- Freedman DS, Wang J, Maynard LM, Thornton JC, Mei Z, et al. (2005) Relation of BMI to fat and fat-free mass among children and adolescents. Int J Obes 29(1): 1-8.
- Schutz Y, Kyle UUG, Pichard C (2002) Fat-free mass index and fat mass index percentiles in Caucasians aged 18-98 y. International Journal of Obesity & Related Metabolic Disorders 26(7): 953-963.
- Agbozo F, Atito P, Abubakari A (2016) Malnutrition and associated factors in children: A comparative study between public and private schools in Hohoe Municipality, Ghana. BMC Nutr 2: 32-42.
- Moore DS, McCabe GP (1993) Inference for distributions. Introduction to the Practice of Statistics, pp. 498-574.
- (1995) Physical status: The use of and interpretation of anthropometry, Report of a WHO Expert Committee. World Health Organ Tech Rep Ser 854: 1-452.
- Booth ML, Ainsworth BE, Pratt M, Ekelund U, Yngve A, et al. (2003) International physical activity questionnaire: 12-country reliability and validity. Med Sci Sports Exerc 35(8): 1381-1395.
- McManus AM, Mellecker RR (2012) Physical activity and obese children. J Sport Health Sci 1(3): 141-148.
- AHA (2014) The AHA’s recommendations for physical activity in children.
- Amidu N, Owiredu W, Saaka M, Quaye L, Wanwan M, et al. (2013) Determinants of childhood obesity among basic school children aged 6-12 years in Tamale Metropolis. Journal of Medical and Biomedical Sciences 2(3): 26-34.
- Onyiriuka AN, Umoru DD, Ibeawuchi AN (2013) Weight status and eating habits of adolescent Nigerian urban secondary school girls. South African Journal of Child Health 7(3): 108-112.
- Adolphus K, Lawton CL, Dye L (2013) The effects of breakfast on behaviour and academic performance in children and adolescents. Front Hum Neurosci 7: 425-453.
- Oliveira TCD, Silva AAMD, Santos CJND, Silva JS, Conceição SIOD, et al. (2010) Physical activity and sedentary lifestyle among children from private and public schools in Northern Brazil. Rev Saude Publica 44(6): 996-1004.
- khodanazari H, Choupani AA, Aghayan I (2022) The contribution of walking to school in students’ physical activity and its effect on being overweight. Biomed Res Int.
- Veugelers P, Sithole F, Zhang S, Muhajarine N (2008) Neighborhood characteristics in relation to diet, physical activity and overweight of Canadian children. Int J Pediatr Obes 3(3): 152-159.
- Cole TJ, Bellizzi MC, Flegal KM, Dietz WH (2000) Establishing a standard definition for child overweight and obesity worldwide: international survey. BMJ 320(7244): 1240-1243.
- Heber D, Ingles S, Ashley JM, Maxwell MH, Lyons RF, et al. (1996) Clinical detection of sarcopenic obesity by bioelectrical impedance analysis. Am J Clin Nutr 64(3 Suppl): 472S-477S.
- Frignani RR, Passos MAZ, Ferrari GLDM, Niskier SR, Fisberg M, et al. (2015) Reference curves of the body fat index in adolescents and their association with anthropometric variables. Jornal de Pediatria (Versão em Português) 91(3): 248-255.
- Rogol AD (2003) Growth, body composition and hormonal axes in children and adolescents. J Endocrinol Invest 26(9): 855-860.
- Kumah DB, Akuffo KO, Abaka CJE, Affram DE, Osae EA (2015) Prevalence of overweight and obesity among students in the kumasi metropolis. J Nutr Metab pp. 1-5.
- Teshome T, Singh P, Moges D (2013) Prevalence and associated factors of overweight and obesity among high school adolescents in urban communities of Hawassa, Southern Ethiopia. Current Research in Nutrition and Food Science Journal 1: 23-36.
- Locke CT, Craig CL, Cameron C, Griffiths JM (2011) Canadian children’s and youth’s pedometer-determined steps/day, parent-reported TV watching time, and overweight/obesity: the CANPLAY surveillance study. International Journal of Behavioral Nutrition and Physical Activity 8: 66-76.
- Mogre V, Nyaba R, Aleyira S, Sam NB (2015) Demographic, dietary and physical activity predictors of general and abdominal obesity among university students: a cross-sectional study. Springer plus 4: 226-234.
- McCambridge TM, Bernhardt DT, Brenner JS, Congeni JA, Gomez JE, et al. (2006) Active healthy living: prevention of childhood obesity through increased physical activity. Pediatrics 117(5): 1834-1842.
- Martins IJ (2016) Anti-aging genes improve appetite regulation and reverse cell senescence and apoptosis in global populations. Adv Aging Res 05: 9-26.
- Utter J, Scragg R, Mhurchu CN, Schaaf D (2007) At-home breakfast consumption among New Zealand children: Associations with body mass index and related nutrition behaviors. J Am Diet Assoc 107(4): 570-576.
© 2022 Isaac Agbemafle. This is an open access article distributed under the terms of the Creative Commons Attribution License , which permits unrestricted use, distribution, and build upon your work non-commercially.
 a Creative Commons Attribution 4.0 International License. Based on a work at www.crimsonpublishers.com.
Best viewed in


.jpg)


 Editorial Board Registrations
 Submit your Article
 Refer a Friend
 Advertise With Us
.jpg)


.jpg)


.bmp)
.jpg)
.png)
.jpg)


.jpg)


.png)

.png)


.png)


