
- About Us
- Information
-

The Author ensures that the research has been conducted responsibly and ethically with adherence to all relevant regulations. read more..
- For Authors
- For Reviewer
- Manuscript Guidelines
- Membership
- Publication Ethics
-
- Journals
- Reprints
- e-Books
- Videos
- Policies
- Contact Us
 COVID-19
- Submissions


Full Text
Novel Techniques in Nutrition and Food Science
Differential Equation Analysis on COVID-19
Wang Z1, Yu Z1, TianC1, Rodriguez LC2,3,4, Batista LS4 and Zhao B1*
1Colleage of Science, China
2ELIDAN genome SAS, 1 avenue du Lycée, Montereau Fault Yonne, France
3ELIDAN Dynamic LLC, Tampa, USA
4Environmental Biotechnology Department, Jamaica
*Corresponding author: Bin Zhao, College of Science, China
Submission: August 10, 2020;Published: September 23, 2020

ISSN:2640-9208Volume5 Issue2
Abstract
Background: An infectious disease caused by a novel coronavirus called COVID-19 has raged across the world since December 2019. The novel coronavirus first appeared in Wuhan, China, and quickly spread to Asia and now many countries around the world are affected by the epidemic. The deaths of many patients, including medical staff, caused social panic, media attention, and high attention from governments and world organizations. Today, with the joint efforts of the government, the doctors and all walks of life, the epidemic in Hubei Province has been brought under control, preventing its spread from affecting the lives of the people. Because of its rapid spread and serious consequences, this sudden novel coronary pneumonia epidemic has become an important social hot spot event. Through the analysis of the novel coronary pneumonia epidemic situation, we can also have a better understanding of sudden infectious diseases in the future, so that we can take more effective response measures, establish a truly predictable and provide reliable and sufficient information for prevention and control model.
Methods: We establish different models according to the different developments of the epidemic situation, different time points, and different response measures taken by the government. To be specific, during the period of 2020.1.23-2020.2.7, the traditional SIR model is adopted; during the period of 2020.2.8-2020.3.30, according to the scientific research results, it was considered that the novel coronary pneumonia has a latent period, so in the later phase of epidemic development, the government has effectively isolated patients, thus we adopt the SEIQR model accordingly. During the period of 2020.3.31-2020.5.16, because more asymptomatic infected people were found, we use the SEIQLR model to fit. Finally, through a SEIR simulator, considering the susceptible number, the latent number, the infected number, the cured number, death number and other factors, we simulate the change of various numbers of people from the beginning to the next 180 days of novel coronary pneumonia.
Findings: The results based on the analysis of differential equations and kinetic models show that through the prediction of the model established in the first phase, the epidemic situation of novel coronary pneumonia in Hubei Province was controlled at the end of March, which is in line with the actual situation. The rest of Hubei province, except for Wuhan, lifted control of the departure channel from 0:00 am on March 25, and Wuhan was also unblocked on April 8. Through the establishment of the second-phase model, it is found that the epidemic situation will reach its peak in mid-February. For example, the quarantine admission of the hospital declined after mid-February, which is inseparable from the measures to build square cabin hospitals in early February so that more and more patients can be admitted. The model established in the third phase shows that the epidemic had been completely controlled by the end of May, which is also in line with the reality. Because in mid-May, the Wuhan government conducted a nucleic acid test on all the citizens to screen for asymptomatic infected persons to fundamentally control the spread of novel coronary pneumonia.
Interpretation: Hubei Province, as the center of the initial outbreak of novel coronary pneumonia, people were forced to be isolated at home during the Spring Festival, the most important Chinese holiday, and the whole society was in a state of suspension of work and
Study: The Chinese government had taken many measures in response to the epidemic, such as shutting down the city, vigorously building square cabin hospitals, and prohibiting people from gathering. At the beginning of May this year, the epidemic in Hubei Province was finally effectively controlled. For ordinary citizens, we should not cause unnecessary panic about the unknown novel coronavirus. Instead, we should fully understand and be familiar with this virus. In addition to the relevant medical knowledge, we should also understand the spread of infectious diseases through appropriate mathematical models. By mathematical models, we can understand the degree of harm of infectious diseases, when to control it, how to stop it, and use scientific views to reveal the original face of the novel coronavirus to the public without causing social panic.
Keywords: COVID-19; Pneumonia; Virus; Coronary; Differential equation; Infectious disease model
Introduction
The coronavirus disease 2019 (COVID-19) was first reported in December 2019 in Wuhan, China. It quickly spread to other districts in the country, and a month later, to other countries across the world, impacting over 200 countries and territories [1]. On March 11, 2020, Tedros, the Director General of the World Health Organization, announced that, based on an assessment, the World Health Organization believes that the current novel coronary pneumonia could be described as a global pandemic [2]. COVID-19 is a highly contagious respiratory infection caused by a coronavirus that is transmitted primarily through close airborne droplets and contact with a patient's respiratory secretions and close contact, and may also be transmitted through droplet contaminants from a patient (e.g., through hands, clothing, food, water, or the environment). The incubation period of most patients is within 7 days. Common clinical symptoms of COVID-19 patients include fever, respiratory symptoms, fatigue, normal or decreased peripheral blood lymphocyte count, and multiple bilateral flaky glass cups around the two lungs in computed tomography (CT) results turbid [3]. Although the exact source of COVID-19 is still unknown, patients with COVID-19 are by far the most certain source of infection.
As of June 26, 2020, it has been reported that the cumulative number of confirmed cases of COVID-19 in the world has reached 9,690,148, and the cumulative deaths have reached 488,971 [4]. At this time, there are 68,135 cumulative confirmed cases of COVID-19 and 4,512 cumulative deaths in Hubei Province, China [5]. The outbreak of COVID-19 has had a great impact on people's lives and the development of the national economy. From March to the present, novel coronary pneumonia has been basically controlled in China. The normal life of the people and the economy affected by the epidemic are recovering.
However, in many areas except China, the epidemic situation is still very serious, and the number of infected people is still high. We analyze Hubei Province, the initial epidemic center of the new outbreak of pneumonia, and combine with the actual situation in Hubei Province, using different models to provide the world with valuable experience and effective measures in the fight against the epidemic. In view of the fact that the Chinese government had adopted different policies over time during the fight against the novel coronavirus. When we are modeling, we use different models at different time periods to more effectively conform to the development trend of the epidemic and to respond to changes brought about by policies. Then we use a software that could simulate the spread of novel coronavirus, in order to find a result in a theoretical circumstance.
Methods
Data
The data in this paper on Hubei Province are from authoritative data published by the Hubei Provincial Health Planning Commission on its official platform from January 23, 2020 to May 16, 2020 [6]. Data include cumulative diagnosed cases, cumulative deaths, cumulative cures, suspected cases, and asymptomatic infections, etc., and get Hubei Province's 2019 total population from official sources [7]. The data we collect is very large, so we must process and analyze the large amount of data collected. The approach is to use Excel to determine the data categories, and then we use MATLAB to further optimize the parameters so that we can effectively use these data to gain the results. The specific operation is according to the known data, filter the data and through basic operations in Excel to get the data we actually need. Then bring these data into MATLAB to calculate, get the optimized parameter value through fmincon function.
The model
Based on the characteristics of novel coronary pneumonia transmission, we use differential equations to establish dynamic infectious disease models and analyze the whole process in three time periods, depending on the time of transmission and the studies published by scientists on novel coronary pneumonia epidemics at different times. Taking January 23, 2020 to February 7, 2020 as the first phase, the SIR model [8,9] is established. Because it was in the early phase of the outbreak of novel coronary pneumonia, research in all aspects was not enough, and did not realize that novel coronary pneumonia had an incubation period and asymptomatic infection. Therefore, the data selected are the daily number of confirmed diagnoses, the cumulative number of deaths, and the cumulative number of cures. Taking February 8, 2020 to March 30, 2020 as the second phase, the SEIQR model [10,11] is established. According to the data, the suspected case was released for the first time on February 8, and with the control of the state, most of the diagnosed patients were able to receive effective isolation measures and treatment. Therefore, we take into account the patients in the incubation period and the quarantined patients, that is, we select the daily number of confirmed diagnoses, cumulative deaths, cumulative cures, centralized isolation, and suspected numbers.
Taking March 31, 2020 to May 16, 2020 as the third phase, the SEIQLR model [12,13] is established. According to the data on March 31, the official released information for asymptomatic people for the first time. Therefore, we also consider asymptomatic infections, that is, we select the daily number of confirmed diagnoses, cumulative deaths, cumulative cures, centralized isolation, suspected number, and daily number of asymptomatic infections.
SEIQLR-based method for estimation
Based on the known data, we set the 2019 population of Hubei Province as N. Then we divide the population of Hubei Province into six categories. Among them, people who are not infected with the novel coronavirus are classified as S(t), the daily number of suspects is classified as E(t), and the daily number of diagnoses that exist daily is classified as I(t), those who are quarantined after diagnoses are classified as Q(t), asymptomatic infected people are classified as the latent, that is L(t), and cumulatively cured and died patients are classified as R(t).
Therefore, we make the following assumptions.
The population is evenly distributed.
The cured people will be permanently immune to the virus and will not be re-infected.
The quarantined and the diagnosed have the same infectious power.
The latent patients, the diagnosed, and the suspected have different infectious power.
For the SEIQLR model, we set specific definitions for the six categories of people as shown in Table 1 below.
Table 1: Classification and definition of population under transmission of COVID-19.

However, not all data for the above six categories are directly available, and some require a merging operation of known data. Specifically, for the susceptible (S), we need to subtract all the people infected with the virus from the total population N. For the infectious (I), we need to subtract the number of people quarantined (Q) and the number of people who are exposed to the virus (E) from the number of people diagnosed. And for the removal (R), we need to add up the number of people cured and the number of people who have died because of the COVID-19.
For all the mathematical symbols mentioned above, the explanations are shown in Table 2. In the analysis of the epidemic in Hubei Province, different models are used depending on the time period. (Figure 1-3) that shown above, represent the schematics of the SIR, SEIQR, and SEIQLR models, respectively. Figure 4 that shown below, represent the resume of (Figure 1-3).
Figure 1: 2020.1.23 - 2020.2.7, SIR model, where β(t) = βI.

Figure 2: 2020.2.8 - 2020.3.30, SEIQR model, where β(t)=β(ωE+I+Q).

Figure 3: 2020.3.31 - 2020.5.16, SEIQLR model, where β(t)=β(ωE+I+Q+λL).

Figure 4: Resume of (Figure 1,2 & 3).

Table 2: Mathematical symbols used in SEIQLR model.

For the SIR model, assuming that the total number of people is N, the proportions of healthy people, patients, and removals in the total number of people are classified as S(t), I(t), and R(t), respectively. Then it is obvious that S(t)+R(t)+I(t)=N holds. The natural birth rate and mortality of the population are not considered during the epidemic. It is assumed that the number of effective contacts per patient per day is β, which is called the contagion rate, and when a healthy person is effectively contacted by the patient, he will be immediately infected and become ill. Assuming that the number of health people effectively exposed per patient per day is βS(t), the number of health people exposed per day for all patients I(t) is βS(t)I(t), these healthy individuals are immediately infected. Monotonic reduction in S(t) based on the assumption that the contagion rate is β. Among patients, the rate of diagnosed case transfer per day is ν, where ν=1. Patients are transferred to inpatient care with a removal rate of α, where α includes cure rates and mortality, i.e., the number of daily removals is ανI(t) [13,14].
We establish the transformation relationship through the micro-method, thus we can get the following equation set
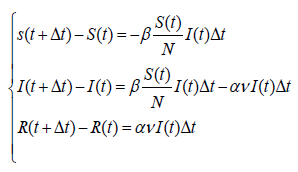
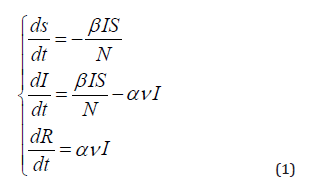
When Δt→0, the model can be described by set of kinetic equation [15] (ODEs), and the final differential equation set of the SIR model is obtained as follows.
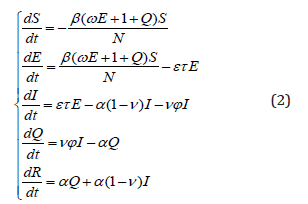
Taking the same approach, we can obtain that the SEIQR model differential equation set.
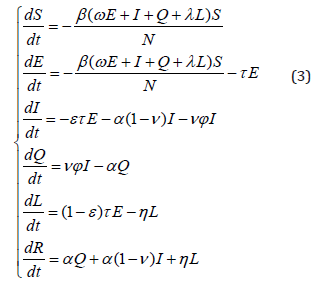
The SEIQLR model differential equation set.
After establishing the equation sets, we need to solve the three parameters of contagion rate β, removal rate for quarantine α and removal rate for the latent η through MATLAB, and use the built-in function fmincon to optimize the values of these three parameters to get more accurate values. The remaining parameters are given in advance by the parameter estimation method.
SEIR-based simulation
With a software that simulates the SEIR model [16], we create a closed environment (Small World) to study the process of transmission of infectious diseases. Among the parameters we set are the total population, the number of initial diagnoses, etc. The detailed parameter settings are shown in Tables 3-5 below. The model used here is the SEIHD model, which is the equivalent of the SEIR model. Because (H) and (D) here represent the number of people cured and the number of people who died from the disease, respectively, adding these two together gives (R). To study infectious diseases for the long-term effects on society, we set the number of simulation days to 180, which is about six months.
Table 3: Parameter settings of various types of personnel in the SEIR simulation.

Table 4: Parameter Setting of natural propagation in the SEIR simulation.

Table 5: Parameter settings of human intervention in the SEIR simulation.

Result
The result of SIR-based method in Phase 1
In MATLAB, optimization of the parameters by the fmincon function [17] yields α=0.08, β=0.5 for the first phase. By fitting the curves, we can see from Figure 5 that in the first phase the curves fit perfectly to the observed values. As can be seen in Figure 5, the fitted values are in perfect agreement with the actual values, and the predicted values are also close to the actual situation. In early April the epidemic will be largely contained, and indeed it is. In many areas of Hubei province, there were no new confirmed cases on a single day, and the blockade was lifted in early April.
Figure 5: Result of curve fitting in Phase 1 (2020.1.23 - 2020.2.7).

The result of SEIQR-based method in Phase 2
The second phase parameter sizes are obtained after parameter optimization by the fmincon function, where α=0.025 and β=0.1. In Figure 6-8 we can see the relationship between the observed and predicted values.
From the fitted values in Figures 6-8, it can be seen that the largest number of the quarantined patients in Hubei Province was in mid-February, which corresponds to the actual opening of the square cabin hospital in early February and the vigorous construction of new isolation sites. This alleviated the initial novel coronary pneumonia outbreak that could not accommodate all patients due to insufficient medical resources. After that, the number of suspects gradually decreased, and the number of removals continued to rise. This shows that with the implementation of the policy, the situation in Hubei Province was getting better. On the other hand, we can see that in Figure 7, due to the surge of initial data, the fitted curve has a large deviation. This also shows that some unexpected situations in reality cannot be effectively reflected in the mathematical model.
Figure 6: Result of curve fitting for the exposed E(t) in Phase 2 (2020.2.8-2020.3.30).

Figure 7: Result of curve fitting for the quarantined Q(t) in Phase 2 (2020.2.8-2020.3.30).

Figure 8: Result of curve fitting for the removal R(t) in Phase 2 (2020.2.8-2020.3.30).

The result of SEIQLR-based method in Phase 3
Optimization of the parameters by the fmincon function yields third stage α=0.13, β=0.21, η=0.04. With Figure 9, 19, and 11 we can see the relationship between the observed and predicted values. It can be seen from Figures 9-11 that the epidemic at the end of May has been completely controlled, which is consistent with the actual situation in Hubei Province. However, we can also see from Figures 9-11 that the degree of curve fitting is not good. This is due to the large changes in the observed values, which caused the fitting curve to deviate. Besides, this also fully demonstrates that the economic and productivity sacrificed by the Hubei government has paid off. In fact, most areas of Hubei gradually resumed production in April. This is due to the timely establishment of makeshift hospitals by the government and the people's active response to the government's call to isolate themselves at home and wear masks whenever they go out.
Figure 9: Result of curve fitting for the susceptible S(t) in Phase 3 (2020.3.31-2020.5.16).

Figure 10: Result of curve fitting for the quarantined Q(t) in Phase 3 (2020.3.31-2020.5.16).

Figure 11: Result of curve fitting for the removal R(t) in Phase 3 (2020.3.31-2020.5.16).

The result of SEIR-based simulation
The result image is shown in Figure 6, which includes five curves representing S, E, I, H, and D. The meanings of the letters are indicated in Table 3, which has been shown already. We use the values of the parameters given in Tables 3-5 to obtain the image shown above. It is evident from the image that COVID-19 has a significant impact on a society that has not implemented comprehensive and stringent measures. This impact is demonstrated not only by the fact that more than 80 percent of the population is infected with the novel coronavirus, but more importantly by the hundreds of thousands of deaths. Even though this is a virtual environment and there are many unknowns in real life, it can be used as a guide to reality through simulation. Therefore, in order to effectively combat the novel coronavirus, it is necessary to strengthen social control measures and medical means.
Conclusion
As can be seen from the above, we use two different software to analyze the data, namely MATLAB and SEIR simulator. In comparison, MATLAB is more powerful, it can improve differential equations according to our needs, but it is relatively complicated in parameter setting and image drawing; SEIR simulator is more convenient: only need to set a few parameters to generate image, but there are certain limitations in the optimization of the equation. And we combine the above two cases to achieve a more accurate purpose. In addition, we have established three different models based on different phases, namely the SIR model, the SEIQR model and the SEIQLR model, which are gradually improved in order to better fit the actual situation of the epidemic.
It can be seen from the results that the degree of fitting curve is different using different models. Although we considered more factors in Phase 2 and Phase 3, the curve fitting effect is not ideal. This may be because what happened in reality is accidental, and these phenomena cannot be explained by traditional mathematical models. On the other hand, the factors taken into account do not accurately reflect reality. However, in general, the three models we establish can effectively reflect the trends in reality.
In summary, the traditional mathematical model cannot effectively explain reality to a certain extent, but this is not to deny the value of the traditional mathematical model. Although the SEIQLR model we establish does not work well in curve fitting, it takes into account more factors than the SIR model, and there are more influential factors in reality. Therefore, for such an event that contains many factors, we should consider using the improved traditional model, such as the SEIQLR model, or use more advanced methods, such as time series analysis, neural networks, etc.
Discussion
Novel coronavirus pneumonia is influenced by many factors, but we use a time-phased approach and establish different models for different time periods. In the case of COVID-19, an unprecedented malignant epidemic, inexperience in the early phase of the epidemic made it difficult to make sound judgements. Therefore, we initially establish the SIR model based on official published data and previous information on infectious disease models. Over time, latent patients with novel coronavirus were also counted in the data, and government control was further increased with vigorous efforts to isolate and treat patients, so we establish the SEIQR model.
When various experiences became more available, studies found that novel coronary pneumonia had asymptomatic infections, thus we establish the SEIQLR model. This approach to modeling provides a better simulation of the actual situation. Finally, we obtain the transmission of novel coronary pneumonia from the initial phase to 180 days afterwards by setting the relevant parameters in a closed environment through the SEIR simulator, which will also give us some reference value in the process of combating novel coronary pneumonia [18]. Our model of infectious disease which is established by differential equation has a wide range of operating prospect, except for infectious disease itself (e.g. COVID-19 and SARS) of the prediction, prevention and control, there are a lot of social behaviors and incidents in our life follow the rule similar to the model of the spread of infectious disease.
Figure 12: Result of SEIR simulation.

The infectious disease model can be widely used in the diffusion of innovation, the network public opinion spread, the spread of financial risk, and other areas of the social science research [19,20]. The diffusion process of management accounting matters, which is shown in the (Table 6) and (Figure 12) below, clearly uses the SIR model for analysis [21].
We can see from Figure 12 that the conversion relationship between neutrals, opponents and supporters can also be described by the SIR model, but there are some differences from the SIR model of infectious diseases. For instance, a neutral person (S) can directly become an opponent (R), but in an infectious disease, a susceptible person (S) must be transformed from an infected person (I) to a removal (R).
Table 6: Management accounting practice diffusion system and infectious disease model.

Limitations
When we establish the models, we do not consider the impact of natural birth and mortality on the whole. Because there is a lack of data on the mobile population and on infections among the mobile population, we ignore the impact of population movement between provinces and districts on the epidemic in the preblockade period in Hubei Province. The model we have established is only for Hubei province, but it is actually worth discussing at the national level, and the spread of the novel coronavirus to rural and pastoral areas. In addition, for modeling, how to group the total population and characterize random phenomena, and how to study the stratification of population subgroups that affect the predictive control mechanisms of infectious diseases based on epidemiological characteristics such as age, behavior, geographic distribution, and mobility. The models established are influenced by many factors such as differences between patient infectiousness, individual susceptibility, differences in morbidity between local districts, differences in intensity of prevention and control in different regions, and errors in statistical data [22]. We can also see from the resulting images that as the complexity of the model increases, the fit does not improve correspondingly, and even the fit is worse than the simple model. This is not only because of the discrepancy between reality and theory, but more importantly because the factors taken into account in differential equations do not necessarily reflect reality effectively [23]. This also tells us that theoretical mathematical models alone are not enough if we want to better reflect reality, because there are many unknown factors in reality that mathematical models cannot accurately represent.
Conflict of Interest
We have no conflict of interests to disclose and the manuscript has been read and approved by all named authors.
Acknowledgement
This work was supported by the Philosophical and Social Sciences Research Project of Hubei Education Department (19Y049), and the Staring Research Foundation for the Ph.D. of Hubei University of Technology (BSQD2019054), Hubei Province, China.
References
- Faraz AS, Ahmed AQ, Matthew RMK (2020) Preliminary identification of potential vaccine targets for the COVID-19 coronavirus (SARS-CoV-2) based on SARS-CoV immunological studies. Viruses 12(3):
- https://www.who.int/docs/default-source/coronaviruse/situation-reports/20200211-sitrep-22-ncov.pdf?sfvrsn=fb6d49b1_2
- Zhiqiang Q, Gang M, Xiaogang Z (2020) Diagnosis and antiviral treatment of novel coronavirus pneumonia. Chinese Journal of Clinical New Medicine 13(05): 429-435.
- http://www.medsci.cn/article/show_article.do?id=1ecd19654400
- http://k.sina.com.cn/article_2607972104_9b727f0801900qi8n.html?from=local
- (2020) National Bureau of Statistics.
- Ronggui L, Tao J (2006) A study of technology diffusion models based on the SIR infectious disease model. Journal of Management Engineering (1): 37-40.
- Gui Z, Weide L, Lingfeng Z (2011) Comparison of different control strategies based on the SIR infectious disease model. Journal of North China University, Nature Science 012(003): 265-269.
- Jianquan L, Feng W, Zhien M (2005) A global analysis of a class of infectious disease models with quarantine. Journal of Engineering Mathematics 022(001): 20-24.
- Shuangde Z, Hai H, Xihong Z (2002) A class of models of infectious disease dynamics containing latency. Journal of Mathematical Medicine 015(005): 385-386.
- Huilin C, Huiru D, Yinan Z (2015) SLICAR model of transmission considering both latency and onset of infection in cryptogenic populations. China Health Statistics 032(002): 264-266.
- King AA, Lonides EL, Pascual M, et al. (2008) Inapparent infections and cholera dynamics. Nature 454(7206): 877-880.
- Qiyuan K (2019) Mathematical models. Higher Education Press, China.
- Giordano FR (2014) Mathematical modeling. Mechanical Industry Press.
- Yong Y (1991) Uniqueness of the overall existence of solutions to groups of equations of infectious disease dynamics. Annals of Mathematics: Chinese Edition (02):86-98.
- An outbreak development simulation software based on the K-SEIRD mathematical model.
- Wei P (2019) Simulation modeling and MATLAB practical tutorial. Tsinghua University Press, China.
- Jianli y, Juhua l, Shuigao J (2005) Mathematical modeling of infectious diseases and SARS prediction. Health Research 034(003): 352-353.
- http://xueshu.baidu.com/usercenter/paper/show?paperid=1p7b06
- Zhao G, Zhong Y (2007) Management accounting practice. Tsinghua University press, China, p. 10.
- Wang Z (2020) Mathematical analysis on the epidemic of coronavirus disease. J Pharmacol Pharmaceut Pharmacovig 4: 014.
- Yicang Z, Yun T (2003) Mathematical models for SARS transmission prediction. Journal of Engineering Mathematics 020(007): 53-62.
- Rodriguez LC (2020) How to evaluate viral transmission in enclosed areas. Journal of Bioscience & Biomedical Engineering 2(1): 1-8.
© 2020 Bin Zhao. This is an open access article distributed under the terms of the Creative Commons Attribution License , which permits unrestricted use, distribution, and build upon your work non-commercially.
Editor In Chief


.jpg)


Signup for Newsletter

Quick Links
 Editorial Board Registrations
 Submit your Article
 Refer a Friend
 Advertise With Us
Our Recent Edition

.jpg)


Top Editors


.jpg)


.bmp)
.jpg)
.png)
.jpg)


.jpg)


.png)

.png)


.png)


Financial Support

Sponsors

Latest e-Books

Latest Video

 a Creative Commons Attribution 4.0 International License. Based on a work at www.crimsonpublishers.com.
Best viewed in
a Creative Commons Attribution 4.0 International License. Based on a work at www.crimsonpublishers.com.
Best viewed in