
- About Us
- Information
-

The Author ensures that the research has been conducted responsibly and ethically with adherence to all relevant regulations. read more..
- For Authors
- For Reviewer
- Manuscript Guidelines
- Membership
- Publication Ethics
-
- Journals
- Reprints
- e-Books
- Videos
- Policies
- Contact Us
 COVID-19
- Submissions


Full Text
Novel Techniques in Nutrition and Food Science
Production and Characterization of Nutritious Peanut Butter Enhanced with Orange Fleshed Sweet Potato
Mulindwa J1, Kaaya NA1, Tumuhimbise G1 and Naveen Puppala2*
1School of Food Technology, Nutrition and Bioengineering, Makerere University, P.O.BOX 7062, Kampala, Uganda.
2New Mexico State University, Agricultural Science Center at Clovis, New Mexico 88101, USA.
*Corresponding author: Naveen Puppala, Department of Agricultural Science Center at Clovis, USA
Submission: November 1, 2019;Published: December 04, 2019
ISSN:2640-9208Volume4 Issue4
Abstract
Peanuts worldwide are popular for their nutritional quality and commercial potential. Their consumption in Uganda is high and second after common beans thus making them a suitable food for fortification to fight the increasing vitamin A deficiency in the country. Consumption of orange fleshed sweet potato (OFSP) is equally high in the country and this too offers potential to fortify peanut butter for increased intake of vitamin A. The objective of this study was to investigate the potential of producing a nutritious peanut butter, with high shelf-life. An OFSP ratios of 0% (Control), 5% (Treatment 1), 10% (Treatment 2) and 15% (Treatment 3) were mixed with peanut butter. The product was assessed for proximate composition using AOAC methods and sensory qualities. The shelf-life of product was also established by determining the fat quality, beta-carotene retention and microbial quality. Fortifying peanut butter with OFSP significantly increased the protein content from 20.47 to 27.76%, fat from 30.8 to 32.4%, sugars from 2.96 to 25.51% and, beta-carotene from 244 to 1388μg 100g-1. In all treatments, the control had the lowest amount of nutrient, while OFSP that was fortified with 15% peanut butter had the highest levels of the nutrient. When OFSP was fortified with 10 and 15% peanut butter it resulted in higher retention of β-carotene between 400 to 600μg 100-1g which could meet the daily World Health Organization (WHO) recommendations of 350 to 500μg 100-1g. After storing the product for five months, OFSP that was fortified with 10 and 15% peanut butter had good fat quality as reflected by the low acid value (AV) below 0.9mg KOH-1 and peroxide value (PV) below 4mEq kg-1 respectively. There was a strong negative correlation (r=0.049; p˂0.05) between peroxide formation and the amount of β-carotene in the peanut butter. All peanut butter samples were free of dangerous levels of microbes. The peanut butter treated with OFSP had acceptable sensory score of 6-7 on the scale of 1 to 9. The results suggest that peanut butter fortified at 15% OFSP had greater shelf-life and meet the vitamin A requirements of school going children.
Keywords: Peanut butter; OFSP; β-carotene; Fat quality
Introduction
Peanuts (Arachis hypogaea L) are popular worldwide because of their value as plant protein source (23-35%) and fat (45-52%) [1]. The peanuts possess high nutritional and commercial value due to the presence of fatty acids, protein, carbohydrates, minerals and vitamins [2,3]. Globally, peanut consumption is relatively high and is consumed either as roasted, cooked or as peanut butter [4]. In Uganda, peanuts rank second with annual production of 210,000 tons in shell after common beans (Phaseolus vulgaris; FAO, 2017). Peanuts are potential food source for fortification since they are consumed widely in Uganda in various forms as sauce, peanut butter and paste. In Uganda increasing prevalence of vitamin A deficiency amongst children and pregnant women has been reported at a rate of 19% to 20% respectively [5]. This situation along with limited access to nutritious foods adversely affects the wellbeing of children and adults. Consumption of peanut butter fortified with vitamin A is considered as a way to reduce vitamin A deficiency [6,7].
Peanut butter is a semi-perishable product with prolonged shelf life due to its low moisture content [8]. Peanut products in storage are exposed to ambient conditions, with exposure to sunlight. The heat accumulated during storage and accelerates rancidity [8-10]. The rancid peanut butter is unfit for consumption because of off flavors [11,12]. The β-carotene is a powerful antioxidant that provide protection against oxidative processes in food systems [13,14]. The antioxidant activity of β-carotene is attributed to their polyene frameworks [15]. Orange Fleshed Sweet Potato (OFSP), one of the major sources of beta-carotene is widely grown and consumed in Uganda [16]. In the year 1995, researchers recognized the potential of OFSP varieties to address widespread vitamin A deficiency in Sub Saharan Africa using integrated agriculture-nutrition approach [17]. Use of OFSP is a rich plant-based source of β-carotene, which the body converts into vitamin A [17]. Through the multi-partner initiative, OFSP was launched in Uganda headed by Harvest-Plus. Various Non-Government Organizations (NGO), Volunteer Efforts for Development Concerns (VEDCO), Farming for Food and Development Program-Eastern Uganda (FFDP-EU) and National Agricultural Research Organization (NARO) have since disseminated OFSP in Uganda to create awareness and have released varieties such as Ejumula, Vita, and Kabodeamong others; and value addition for increased consumption [18]. Research has shown that OFSP has the potential to improve the vitamin A status of individuals [19,20]. Study by Jaarsveld et al. (2005) showed that, there was a 10% significant improvement in Vitamin A that liver stores amongst the school children who were fed on OFSP. Product diversity can be a driver to its increased consumption especially amongst the children. This study therefore aimed at production of a shelf stable, high nutritious OFSP-fortified peanut butter product that could be used by school-going children.
Materials and Methods
Materials
Twenty kilograms of peanut (Valencia variety) were obtained from the National Semi-Arid Resources Research Institute, Soroti, Uganda. Triglyceride stabilizer was purchased from Dansico Company, United States of America (USA). Two hundred (200)kg of Orange fleshed sweet potato roots (Kabode variety) were purchased from VEDCO Uganda at maturity age of 4 months when roots have attained dark orange color and expected to contain highest β-carotene content. Chemicals and reagents used in laboratory analysis were obtained from Westford laboratory, Kampala, Uganda.
Preparation of OFSP peanut butter
Peanut butter was produced following [21], with some modifications to suit the available technology. Peanut kernels were selected, cleaned using a 2-step wise cleaning method; 1) dry cleaning where sorting is done, and 2) wet cleaning where the kernels were washed to remove dust on the surfaces. The peanut kernels were then roasted in the electrical oven (Model: GU-6) for 25 minutes at a temperature of 140 °C, then cooled for 5 minutes and test was removed to ease sorting of seeds by color to reduce the incidences of aflatoxin infection [22]. Peanuts that passed sorting, were ground using a blade grinder (Capacitor Start Motor; type: YC112M-2; HP 248A) till a smooth peanut butter was formed. The OFSP flour was added to the smooth peanut butter in ratios of 0% (C0), 5% (Treatment 1), 10% (Treatment 2) and 15% (Treatment 3). Varying ratios were used to increase the concentration of β-carotene and putting into consideration the effect of solids on the quality of peanut butter [23]. The OFSP flour was chosen over OFSP pulp because of the deteriorative effect that pulp can impose on the product due to high moisture content. Mixing was done using a dough mixer (Type: 94/R10; No. 21602) for 15 minutes to achieve uniform and consistence mixture, and 0.7% of triglyceride stabilizer was added. The OFSP peanut butter and control sample were packed in food grade plastic jars.
Chemical analyses
The samples packaged in food grade containers were delivered to Makerere University chemistry laboratory for proximate analysis (Moisture content, protein, fat, sucrose, fiber and beta-carotene), and shelf stability (acid value, peroxide value, β-carotene retention and microbial quality) studies.
Moisture
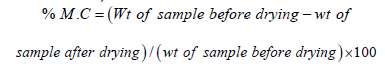
About 3g of each sample was weighted in the dry dishes and weight recorded. The dishes with the sample were put in the oven and dried for about 6 hours at temperature of 95 °C. The dishes were then cooled in a desiccator and weights recorded and percent moisture determined,
Protein
Crude protein content of samples was determined using the standard Kjeldahl method [24]. About 0.2g of each sample was digested using 5ml concentrated Sulphur acid and Kjeldahl tablets as catalysts. The sample solution was heated slowly for the first 6 minutes, heated rapidly after stabilization for 2 hours then left to cool. The digest was quantitatively transferred to a 50ml volumetric flask and made to volume with distilled water, then shaken to homogenize the solution. The sample distillate was prepared by pipetting 10ml aliquots of the digest in a Markham still (Foss, Tecator, Britain), 20 ml of 40% sodium hydroxide was introduced into the distillation chamber and distillation was allowed to proceed for about 4 minutes. The distillate was collected into the conical flask containing 10 ml boric acid (4%) and mixed indicators (bromocresol green and methyl red); the end point was marked by color change back to the original brown color. The blank titer was subtracted from the sample titer and the total crude protein determined using the equation below:
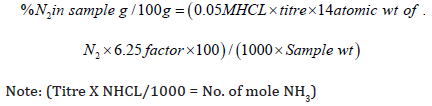
Note: (Titre X NHCL/1000 = No. of mole NH3)
Dietary fiber
Dietary fiber was determined on the basis of Acid Detergent Fibre (ADF) standard method [24]. One gram of each sample was weighed and mixed in 100ml of acid detergent fiber (28ml concentrated Sulphur acid and 20g cetyltrimethylammonium ammonium Bromide) solution. The solution was boiled for 1 hour on the fiber analyzer (Labconco Corporation, Kansascity, Missouri 64132. Serial No. 246719) and then filtered through a pre-weighed glass sintered crucible. The crucible was dried in the oven for 30 minutes and cooled in the desiccator before weighing. The fiber was determined using the formula below:

Fat
About 3g of sample was weighed into a thimble in triplicates. The thimbles and their contents were placed into 50ml of petroleum ether (PE) in a beaker assembled in the Soxhlet system. The fat in the sample was extracted using PE, by boiling at 115 °C for 20 minutes and then rinsed for 45 minutes. The beakers were transferred to the oven to evaporate off the PE and other water-soluble material for 30 minutes at 90 ᵒC. The beakers were cooled in the desiccator to room temperature and weights taken.

Sugar
Total sugars were determined by hot water extraction method (AOAC, 2002). One gram of each sample of peanut butter was accurately weighed into 250ml beakers to which 1ml lead acetate was added followed by 70ml of hot water. The beakers with the contents were then placed on a hot water bath at 80 °C and heated for 1 hour. To the cooled sample solution, half a spatula of sodium bicarbonate was added to precipitate all the excess lead acetate. The sample was then transferred to 100ml volumetric flask quantitatively and shaken to mix well. A portion of the sample was poured into test tubes and centrifuged at 700rpm for 5 minutes.
Five (5) ml of the clear solution of the sample, 1 ml of concentrated Sulphur acid and 20ml of distilled water were added to 100ml conical flasks and then heated to boiling for 10 minutes. The cooled solution was neutralized with sodium bicarbonate and transferred quantitatively to 50ml volumetric flask and made to volume with distilled water and mixed. To develop the color, 1ml of sample was added followed by 1ml of phenol (5%) and 5ml of concentrated sulphuric acid to a clean test tube and mixed well. The absorbance of the solution was read off at 470nm.
β-carotene
Following Rodriguez et al. [18], three (3)g of peanut butter was weighed in the mortar. Using 50ml of cold acetone, the sample was ground to extract the carotenoids. Experiment was repeated until the sample was colorless, and then mixture was filtered through a funnel. About 30ml of petroleum ether where added to filtrate. To remove the acetone residue, the mixture was washed in a 500ml separator funnel using 300ml of distilled water, this was repeated three times. Petroleum ether (PE) phase was collected in a 50ml volumetric flask through a funnel containing 15g anhydrous sodium sulfate to remove residual water. Absorbance of beta-carotene was read at 450nm using a spectrophotometry.
Shelf stability of OFSP peanut butter under different conditions
The peanut butter with added OFSP and control sample were stored on shelf under ambient conditions that reflected the retail environment of peanut butter and then analyzed for quality changes over a period of 5 months. Fat quality (acid value and peroxide value), β-carotene retention and microbial quality (microorganisms of interest were E. coli, S.aureus, yeasts and moulds)was determined every after a month.
Fat quality
Acid value (AV): Acid value of treatments and control sample was determined [24] by weighing 3g of each sample into 100ml conical flask. Solvent mixture (50ml; neutral 95% ethanol: diethyl ether, v/v) with phenolphthalein were added to the sample in the flask. The mixture was allowed to stand for 20 minutes shaking at an interval of 3 minutes to ensure that the free fatty acids in the sample dissolve into the solvent. The supernatant was decanted off and was titrated with standard sodium hydroxide solution to the pink endpoint (the pink color persisting for at least 10 seconds). The acid value was expressed as percentage.
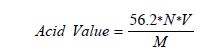
Where;
V is the number of ml of NaOH solution used
N is the exact normality, and
M is the mass in g of the sample
Peroxide Value (PV)
The Peroxide value was determined [24] by weighing 5g of sample into a beaker and mixed thoroughly in a 30ml mixture of 3:2 glacial acetic acid and chloroform solution by vigorous shaking. Saturated potassium iodide solution (0.5ml) was added to the mixture, as a result of which iodine was liberated due to reaction with the peroxide. This was then titrated against a standard solution of sodium thiosulphate, using starch solution as indicator. The procedure was repeated to determine the titration value for a blank sample. PV was calculated as below:

Where;
S=Titration value of the sample (ml)
B=Titration value of the blank sample (ml)
N= Normality of the Sodium Thiosulphate solution= 0.01N
Sample Weight=5gm
Microbial Analysis
Staphylococcus auerus
Ten (10) grams of peanut butter sample was added into sterile bottles having 90ml peptone water. After thoroughly mixing, the sample was serially diluted up to 10-6. Twenty ml Baird parker agar (BPA) was poured on Petri-dishes and left to set at room temperature. After complete solidification, the plates were inverted to avoid dripping of condensed water on solidified agar. Duplicate samples (0.1ml) of dilutions 10-1 and 10-2 were surface spread on the solidified plated petri-dishes using sterile glass rod. The plates were incubated at 37 °C for 3 days. Enumeration was done considering spreaders and clusters as a single colony (ISO 21527-2)
Yeasts and moulds
Yeasts and moulds count were made by adding 10g of peanut butter sample into sterile bottles having 90ml peptone water. After thoroughly mixing, the sample was serially diluted up to 10-6. Acidified agar (15-20ml) was poured on Petri dishes and left to set at room temperature. After complete solidification, the plates were inverted to avoid dripping of condensed water onto the solidified agar. Duplicate samples (0.1ml) of 10-1 and 10-2 dilutions were surface spread on the solidified plated petri-dishes using sterile glass rod. The plates were incubated at 30 °C for 3 days in upright position because yeasts and molds grow upwards. Enumeration was done considering spreading colonies and clusters as a single colony (ISO 21527-2)
Coliforms (E-coli)
Ten grams of peanut butter sample were added into sterile test bottles having 90ml peptone water. After thoroughly mixing, the sample was serially diluted up to 10-6. Dilutions of 10-1 and 10-2 were taken in duplicate samples (1ml) and pour plated using 20ml of violet red bile agar. After thoroughly mixing, the plated sample was allowed to solidify and then incubated at 37 °C for 24 hours. Counts were made considering the purplish red colonies as coliform colonies and clusters as single colonies (ISO 4832).
Assessing acceptability of OFSP peanut butter
Fifty (50) consumer panelists were recruited from the School of Food Technology, Nutrition and Bioengineering, Makerere University. The panelists were briefed before the start of session. Four samples from the five treatment combinations were presented to each panelist. Samples were evaluated in the order of appearance on the ballot. Panelists were asked to place a spoonful of peanut butter on plain bread to evaluate the spread ability and consistency. They were also asked to rinse their mouths with water between samples. The samples were evaluated and ranked by the panelists for color, flavor, spread ability, consistency and overall acceptability using 9-point Hedonic Scale, where 1=dislike extremely, and 9=like extremely [25].
Data analysis
Data for sensory evaluation was analyzed using SPSS [26]. Data on proximate analysis and keeping quality of the peanut butter sample were tabulated and means subjected to ANOVA using Genstat 13th Edition). The means were separated using LSD (P≤0.05) to determine significant differences.
Result and Discussion
Although the moisture content of the control (C0) was significantly lower than the treatment samples (P< 0.05), the moisture content of the latter did not differ significantly implying that increased amount of OFSP have no influence on the moisture content of the fortified peanut butter. The moisture content of the control sample was 1.89% which is in agreement with findings of McDaniel et al., 2012 who reported that peanuts have moisture content between 1.4 to 2%. Fiber content increased significantly (P<0.05) with an increase in the ratio of added OFSP flour to peanut butter. The control sample had the least fiber content, followed by treatment 1, 2, and 3. The increase in the fiber content of the samples with increased ratio of OFSP could be due to relatively high fiber content of OFSP which is reported to be in the range of 1.8 to 3% [27].
The results showed that addition of OFSP to peanut butter does not significantly affect the fat content of the peanut butter (Table 1). The fat content of the control and treatments ranged between 30.83 to 32.45% though there was no significant difference among the samples. The control sample (32.45%) and treatment 1 (32.53%) had the highest fat content while treatment 3 (30.83%) had the least amount. The findings also show that, the amount of fat decreased with increasing ratio of OFSP flour added to the peanut butter. The current study showed that the fat content of the peanut butter was between 32-30%, this is in agreement with the findings of [28] who also reported peanut butter fat content of 32% in the peanut butter. However, others reported higher fat content between 49 to 51% [29-31]. This variation in fat content could be due to differences in agro-ecology and varietal differences [21]. OFSP flour is devoid of fat 0.41% [32] and this could explain why there was decrease in fat content of treatments with high ratio of OFSP flour.
Table 1: Proximate analysis for peanut butter samples.

Values are means±standard deviations. Means followed by the same letter in the same column are not significantly different (p>0.05). Note: Control (0% OFSP), treatment 1 (5% OFSP flour), treatment 2 (10%OFSP flour) and treatment 3 (15% OFSP flour).
The sugar and β-carotene contents in the study significantly increased with increasing addition of OFSP flour in peanut butter, implying that the more OFSP flour used, the more sugar and β-carotene content of the peanut butter. The control sample had the least content of sugar and β-carotene of 2.96% and 244µg100g-1 respectively while Treatment 3 had the highest levels, over eight times and five times of sugar (25.51%) and beta-carotene (1388µg100g-1) respectively. The results also show that treatment 2 had higher sugar and β-carotene content than Treatment 1, and both treatments had significantly greater sugar and β-carotene than control. The sugar content of the peanut butter was 2.96% which was in agreement with the literature as stated by Settaluri et al. [2]. Sweet potatoes have a relatively high sugar content, and this explains why increase in its concentration led to significantly increased percentage of sugars.
According to study done by King et al. [33], he reported that peanuts contain around 3µg/100g β-carotene, while [34] reported β-carotene content in peanuts of 15.23µg/100g and Pattee et al. [35] reported β-carotene of 60µg/100g. All the findings are in contrary to the results of the current study, and this natural variation may be explained by the geographical and varietal differences. On addition of OFSP to peanut butter, beta-carotene increased to values that could meet the World Health Organization [36] daily recommended in takes of 350 to 500µg100g-1 for children between 5 and 16 years.
The protein content significantly ranged from 20.47 to 27.76%, with control having the highest protein content (27.76%), followed by treatment 1 (25.79%), then treatment 2 (24.36%) and lastly treatment 3 (20.47%). The results reflect that, as substitution ratio of OFSP increased, the protein content of peanut butter reduced significantly. The results obtained in the study are in agreement with what was reported by Shakerardekani et al. [30]; Riveros et al. [31] and Singh et al. [37], who reported protein content in peanut butter in the range of 22 to 30%. According to Low et al., 2010, OFSP has a low protein value of 0.016% and this could explain why there was significant decrease in protein content of product with increased substitution ratio of OFSP.
Fat quality
Fat quality is very important as far as storage of peanut butter is concerned because it affects peanut butter shelf life due to oil susceptibility to rancidity [30,31]. Rancidity is often used as an indicator of the stability and edibility of oils [38-40].
Acid value (AV)
Changes in the AV of control (C0), Treatment 1 (5% OFSP), Treatment 2 (10% OFSP), and Treatment 3 (15% OFSP) (Figure 1) showed a gradual increase as the OFSP ratios and storage time increased. Acid Value in 5th month of storage increased significantly in all samples, with control (C0) showing 109% increase followed by 91% in treatment 1, 81% in treatment 2, and 76% in treatment 3. By the fifth month, AV of control and treatment 1 had increased to 1.08 milli-grams of potassium hydroxide per gram of fat (mgKOHg-1) and 1.004 mg KOHg-1respectively. Treatment 2 and treatment 3 were still below 1mgKOHg-1. Kirk et al. [40] stated that when acid value is in the range of 1 to 1.5mgKOHg-1, rancidity is detected by sensory tests.
Figure 1: Changes in AV concentration of the OFSP peanut butter and control sample with storage time. Line labeled ** shows the limit beyond which acidity of oils can start to affect sensory properties. Control sample (C0), Treatment 1(5% OFSP), Treatment 2 (10% OFSP) and Treatment 3 (15% OFSP).

The AV represents the amount of the free fatty acids present in food sample and is determined by measuring the number of milligrams of potassium hydroxide required to neutralize the free fatty acids in 1g of the sample. The AV also shows the extent to which the glycerides in the oil have been decomposed by lipase [40]. Thus, every increase in the potassium hydroxide shows the presence of more free fatty acids and also indicates lipase activity on fats [41]. The free fatty acids increase with storage time as described by Bendini et al. [38]. The increase is triggered by exposure of lipase and other lipolytic materials to atmospheric oxygen after peanut crushing [42]. Light and heat also accelerate the breakdown and decomposition of fats to free fatty acids [43]. Since the peanut butter samples were stored at ambient conditions, there was a possibility of exposure to elevated temperatures and light conditions during storage, which could have led to increased formation of free fatty acids.
Peroxide value (PV) of OFSP peanut butter samples
From the first to the third month of storage, the treatment 2 and 3 did not register any peroxide unlike treatment 1which recorded some peroxides. The control sample (C0) had peroxides formed in the second month of storage. During the fourth and fifth month of storage, all the samples had registered some levels of peroxides but with C0 registering significantly high increase to a value of 19.62meqkg-1 (Figure 2). The results also show that, treatments with low OFSP ratio had high rate of increase in the peroxide value. At peroxide value of 10meqkg-1, oxidation reactions are initiated, and rancid flavors may start to be noticed. The results however showed that, for the first four months of storage PV was not high to cause rancidity unlike in the fifth month where the PV for C0 significantly increased above the limit.
Figure 2: Changes in PV with storage time for the different peanut butter with added OFSP and control sample. Line labeled** indicates the induction period beyond which peroxide formation accelerates rapidly and development of off flavors. Control sample (C0), Treatment 1 (5% OFSP), Treatment 2(10% OFSP) and Treatment 3 (15% OFSP).

PV is an indicator of the initial stages of oxidative change in food [44]. This method utilizes the principle of ferric ion complexion where hydrogen peroxide (ROOH) is reduced with Fe2+ leading to formation of Fe3+ complexes [41]. The concentration of peroxides as represented by the PV is useful in assessing the extent to which spoilage has advanced. The report by Azhar et al. [45] indicated that PV increased with storage time which is in agreement with the current study which showed that PVs of the samples increased with increasing storage time. Mailer et al. [46] also claimed that more oxidation occurs in lipids with prolonged time of storage. When the concentration of peroxides reaches an induction point (10mEq/kg), complex chemical changes occur, and volatile products are formed that are mainly the rancid taste and odour [38]. In the current study, the PV for the different samples was between 2.5-19mEq/kg of fat with C0 (19mEq/kg) having the highest and Treatment 3 the least PV (2.5mEq/kg). Therefore, the OFSP peanut butter had not yet attained the values necessary to produce the rancid flavors during the five months of storage.
The presence of carotenoids in OFSP can inhibit the formation of peroxides. Amongst the carotenoids, β-carotene has a higher potent for peroxides, which involves formation of hydrogen radical abstraction (ROO-CAR) complex, thus inhibiting utilization of the free radicals by oxygen [15]. This may explain the reduced rates of peroxide formation in samples with OFSP flour. Furthermore, peanuts have naturally occurring phytochemicals like tocopherols and polyphenolics; these also play a role in slowing or preventing lipid oxidation due to their anti-oxidative nature [41,47].
Relationship of PV and AV with OFSP levels and storage time
Table 2: Correlation of PV with independent variable AV, storage time and OFSP ratio.

R2=68.9; Values with * have a significant positive or negative relationship at P≤0.05
There was no linear relationship between AV and OFSP ratio (r= -0.1847, P≥0.05) (Table 2). However, a strong positive relationship between AV and time of storage (r=0.8955, P≤0.05) was detected. PV was significantly negatively (r=-0.4971) and positively (r=0.5852) associated with OFSP ratio and storage time, respectively (Table2). The correlations further show that AV significantly affected PV positively (r= 0.758). The negative relationship between PV and OFSP indicates that OFSP was resisting the formation of peroxides. This may be because β-carotene contained in OFSP reacts with fat radical to form a stable radical which does not quickly react with oxygen [48]. Antioxidants terminate the free radical intermediates, by being oxidized themselves, thus acting as reducing agents [48,49].
β-carotene retention of treatment samples with storage time
In all the samples, β-carotene significantly reduced as the storage time increased (Figure 3). The control sample (C0) had the least β-carotene which also significantly kept on reducing with storage time. Treatment 3 with highest level of β-carotene (1388.2µg/100g) in the 1st month of storage and it had reduced to 580.6µg/100g in the 5th month. The results further show that, the reduction in β-carotene was proportion to the amount present in the samples. Treatment 2 and 3 which had high values, also registered a significantly high loss with storage. However, at the end of the fifth month of storage, treatment 2 and 3 still had considerably high β-carotene levels compared to treatment 1 and control (C0).
Figure 3: Changes in β-carotene with storage time for the different peanut butter with added OFSP and control sample. Control sample (C0), Treatment 1: (5% OFSP flour), Treatment 2: (10%OFSP flour) and Treatment 3: (15% OFSP flour).

The losses in β-carotene over time may be due to exposure of peanut butter samples to light during storage as β-carotene is sensitive to heat and light [50]. The processing procedures and time also expose β-carotene to oxygen which may further influence the losses as noted by Bechoff et al. [51] and Wheatley [52]. In addition, the difficulty in complete extraction of the carotenoids during analysis may have introduced variability in the results obtained as it was also noted by Bengtsson et al. [16]. Despite the fact that there was significant loss in β-carotene during storage, the quantities retained by the Treatments 2 and 3 were high compared to the control sample. Thus, peanut butter fortified with 10% and 15% OFSP can contribute some level of β-carotene o the daily β-carotene requirements.
Relationship between β-carotene with storage time, OFSP ratio and PV units
Results in Table 3 show that β-carotene was significantly correlated with storage time, OFSP flour and PV value while both storage time and PV were negatively correlated (r=-0.5483 and; r=-0.5852) with the β-carotene retention, respectively. On the other hand, there was a strong positive correlation observed between OFSP ratio and the β-carotene (r=0.7547, P≤0.05). The literature indicates that a decrease in β-carotene during storage is natural [51]. This was also reflected in the study as a strong negative correlation was noted between beta-carotene and storage time (r=0.5483, P≤0.05). The decrease in β-carotene can be addressed by increasing the amount added to the food. The current study showed that β-carotene content correlates positively with the amount of OFSP flour added in the sample (r=0.7547, P≤0.05) indicating that an increase in the OFSP flour increased positively the level of β-carotene. These findings agree with Bechoff et al. [12] and Bengtsson et al. [16] who reported that more OFSP flour added in foods increases the β-carotene content.
Table 3: Correlation of B-carotene with other independent variables.

R2=89.2; values with *have a significant positive or negative relationship (P≤0.05)
Among other factors that influence β-carotene content, is oxidation. Since β-carotene plays an anti-oxidative role, the increasing PVs of the peanut butter samples negatively affected the retention of β-carotene as it is expected that β-carotene is used up in the process of inhibition of peroxide formation. β-carotene binds with the free radicals and blocks oxygen uptake during oxidation and it is depleted as it binds with the free radicals [37]. This phenomenon explains why β-carotene correlates negatively with the PV and may also explain why treatments with high OFSP registered lower values of PV since β-carotene inhibited the formation of peroxides
Changes in microbial quality of OFSP peanut butter during storage. The presence of microbes such as Escherichia coli, Staphylococcus aureus, yeasts and molds in peanut butter can be detrimental to human health [53,54]. In the present study (Table 4), all samples tested negative for yeasts and molds and E. coli. However, Treatments 1, 2 and 3 tested positive for presence of S. aureus and C0 tested negative (Table 3). The S. aureus ranged from 5.1*100cfu/g to 4*101cfu/g with treatment 3 recording the highest and treatment 2 had the least. The counts of S. aureus in treated peanut butter decreased with storage time.
Table 4: Changes in colony counts for microorganisms in peanut butter with OFSP and control sample during storage.

N. D= Not Detected Note: Control sample (C0), treatment 1 (5% OFSP flour), treatment 2 (10%OFSP flour) and treatment 3 (15% OFSP flour).
aureus has several strains, and some are known for causing food spoilage which doesn’t result into harm to the consumers but leads to food wasting (Institute of Food Technologists and Food and Drug Administration [55]. The production of S. aureus toxins is favored by minimum water activity (aw) of 0.9 [56], yet the peanut butter is known to have very low water activity of below 0.7 [56], which does not support production of toxins.
S.aureus competes poorly in most foods with low moisture content [56,57], and owing to the fact the samples had moisture in the range of 1.8 to 2% which is far below the required for growth S. aureus and toxin production. This may also explain the reduction trend of Staphylococci numbers in the peanut butter samples with storage time.
USDA (2010) set the minimum Coliform content to be below 3.6cfu/g and all samples were free of E. coli. This indicates good hygiene since the presence of coliform (E. coli) in peanut butter can reflect the possibility of fecal contamination as coliforms are considered normal flora of the intestinal tract of humans and animals [52]. The set standard for the yeasts and moulds by UNBS et al. [58] in peanut butter is ˂103cfu/g of sample which also shows that the peanut butter produced is safe for consumption since the results from microbial analysis reported absence of yeasts and moulds.
Changes in sensory attributes of peanut butter with storage time
No significant changes in color were noticed in all the samples (Table 5). Although significant changes in aroma, spread ability, oiliness, taste, flavor and overall acceptability were noticed in samples with storage time; the sensory scores were within desirable range of 6 to 7and according to sensory scale 6 represents like moderately and 7 like much (Table 5). The sensory attributes are mainly affected by the changes in the fat quality of the peanut butter products due to fat oxidation [7,59]. However, the effect of fat oxidation was not noticed in the OFSP enriched peanut butter samples except in the control (C0). In the present study, microbial testing was done prior to sensory evaluation [60-62] and all treatments were found to be microbiologically safe for sensory evaluation.
Table 5: Sensory changes for the control sample and peanut butter with added OFSP with storage time.

All values represent means ±SD; Values with same letter in a column are not significantly different (p≤0.05). Control sample (C0), Treatment 1: (5% OFSP flour), Treatment 2: (10%OFSP flour) and Treatment 3: (15% OFSP flour).
Conclusion
The findings suggest that use of OFSP in the production of peanut butter improved β-carotene content, which increases with high substitution levels. Treatment 3 with 15% OFSP had the highest β-carotene, highest beta-carotene retention on shelf, better fat quality and had acceptable sensory score. Thus, it is concluded that OFSP can be used in peanut butter to enhance its nutritional value (vitamin A requirements) of the school-going children. There is a need to encourage the diverse utilization of OFSP in peanut butter production to improve the vitamin A status of school going children. This could be one of the most possible ways of improving OFSP utilization by incorporating it in common local products like Oddi.
Acknowledgement
This research was supported in part by Makerere University, Uganda; by the Office of Agriculture, Research and Policy, Bureau of Food Security, US Agency for International Development, under the terms of Award No. AID-ECG-A-00-07-0001 to the University of Georgia as management entity for the US Feed the Future Innovation Lab on Peanut Productivity and Mycotoxin Control. The laboratory technicians of the School of Food Technology, Nutrition and Bio-engineering (FTNB) are appreciated for the technical support during the study.
References
- Muzoora S, Margaret LK, Bailey H, Vuzi P (2017) Status on aflatoxin levels in groundnuts in Uganda. The Pan African Medical Journal 27(4): 11.
- Settaluri VS, Kandala CVK, Puppala N, Sundaram J (2012) Peanuts and their nutritional aspects-A review. Food and Nutrition Sciences 3(12): 1644-1650.
- Sundaram J, Kandala CV, Holser RA, Butts CL (2010) Determination of in-shell peanut oil and fatty acid composition using near-infrared reflectance spectroscopy. Journal of the American Oil Chemists’ Society 87(10): 1103-1114.
- Derek BJ, Michael B, Halmer P (2006) The encyclopedia of seeds: science, technology and uses. CABI publishers.
- Uganda Bureau of Statistics (UBOS) and ICF (2018) Uganda demographic and health survey 2016. Kampala Uganda and Rockville, USA: UBOS and ICF, Maryland, USA.
- Jan KRL, Cole D, Loechl C, Lynam J, Andrade M (2010) Challenge theme paper 3: nutritional impact with orange-fleshed sweet potato (OFSP). Social Sciences Working Paper 1: 73-105.
- Nambiar PM, Florkowski WJ (2013) Peanut Paste/ butter consumption frequency in the republic of uganda: count data model approach. Selected paper prepared for presentation at the Southern Agricultural Economics Association Annual Meeting (SAEA), Orlando, FL, 3-5.
- Gills LA, Resurreccion AVA (2000) Overall acceptability and sensory profiles of unsterilized peanut butter and peanut butter stabilized with palm oil. Journal of Food Processing and Preservation 24(6): 495-516.
- Okello KD, Kaaya AN, Bisikwa J, Were M, Oloka KH (2010) Management of Aflatoxins in Groundnuts. A manual for Farmers, Processors, Traders and Consumers in Uganda. aflatoxins in groundnuts (Arachis hypogea). National Agricultural Research Organization in collaboration with Makerere University pp. 18-21.
- Sewald M, Vries J (1990) Food product shelf life. Medallion Laboratories, Analytical Progress.
- Waheed A, Ahmad T, Yousaf A, Zaefr IJ (2004) Effect of various levels of fat and antioxidant on the quality of broiler rations stored at high temperatures for different periods. Pakistan Veterinary Journal 24(2): 70-75.
- Kristott J (2000) The stability and Shelf-life of food. In: Kilcast D, Subramanian P (Eds), Fats and Oils. Woodhead publishing. England, UK.
- Passwater RA (1996) Beta-carotene and other carotenoids: The antioxidant family that protects against cancer and heart disease and strengthens the immune system. Keats Inc. publishing.
- Charoensiri R, Kongkachuichai R, Suknicom S, Sungpuag P (2009) Beta-carotene, lycopene, and alpha-tocopherol contents of selected Thai fruits. Food Chemistry 113: 202-207.
- Guo JJ, Hu CH (2010) Mechanism of chain termination in lipid peroxidation by carotenes: a theoretical study. Journal of Physics and Chemistry Biology 114(50): 16948-16958.
- Bengtsson A, Namutebi A, Alminger LM, Swanberg L (2008) Effects of various traditional processing methods on the all-trans- β-carotene content of orange fleshed sweet potato. Journal of Food Composition and Analysis 21(2): 134-143.
- Jan WL, Mwanga ROM, Andrade M, Carey E, Marie BA (2017) Tackling Vitamin, A deficiency with biofortified sweet potato in Sub-Saharan Africa. Global Food Security 14: 23-30.
- Amaya DBR, Mieko K (2004) Harvest plus handbook for carotenoid analysis. (International center for tropical agriculture), Published by Ciat. Technical Monograph Series 2.
- Awuni V, Alhassan MW, Amagloh FK (2017) Orange-fleshed sweet potato (Ipomoea batatas) composite bread as a significant source of dietary vitamin A. Food science & nutrition 6(1): 174-179.
- Jamil KM, Brown KH, Jamil M, Peerson JM, Keenan AH, et al. (2012) Daily consumption of orange-fleshed sweet potato for 60 days increased plasma b-carotene concentration but did not increase total body vitamin a pool size in Bangladeshi women1-3. The journal of Nutrition Community and International Nutrition 142: 1896-1902.
- Ozcan M, Serap S (2003) Physical and chemical analysis and fatty acid composition of peanut, peanut oil and peanut butter from COM and NC-7 cultivars. Grasas y Aceites 54(1): 12-18.
- Galvez BG, Matias RS, Yanez MM, Sanchez MF, Arroyo AG (2002) ECM regulates MT1-MMP localization with β1 or αvβ3 integrins at distinct cell compartments modulating its internalization and activity on human endothelial cells. Journal of Cell Biology 159(3): 509-521.
- Palomar LS, Galvez LA, Dotollo MO, Lustre OA, Resurreccion AVA (2006) Stabilized peanut spread with roasted cassava flour: Peanut butter and spreads. Monograph series No.6. United States Agency for International Development Peanut Collaborative Research Support Program, Phillippines, USA.
- AOAC (2002) Official methods of analysis. Association of Official Analysis Chemistry, Washington DC, USA.
- Resurreccion, Anna VA (1998) Consumer sensory testing for product development, 1st [Ed], Springer publishers.
- SPSS Inc (2007) SPSS for windows, Version 16.0. Chicago, USA.
- Sanoussi AF, Adjatin A, Dansi A, Adebowale A, Sanni LO (2016) Mineral composition of ten elite sweet potato (Ipomoea batatas [L.] ) Landraces of Benin. International Journal of Current Microbiology and Applied Sciences 5(1): 103-115.
- Akhtar S, Khalid N, Ahmed I, Shehzad A, Suleria RH (2013) Physicochemical characteristics functional properties and nutritional benefits of peanut oil: A review critical reviews in Food Science and Nutrition 51(12).
- Adjou ES, Dahouenon AE, Soumanou MM (2012) Investigations on the microflora and processing effects on the nutritional quality of peanut (arachis hypogeal l). Journal of Microbiology, Biotechnology and Food Sciences 2(3): 1025-1039.
- Shakerardekani A, Karim R, Ghazali HM, Chin LN (2013) Textural, rheological and sensory properties and oxidative stability of nut spreads-A review. International Journal of Molecular Science 14(2): 4223-4241.
- Riveros CG, Mestrallet MG, Nepote, V, Grosso NR (2009) Chemical composition and sensory analysis of peanut pastes elaborated with high-oleic and regular peanuts from Argentina. Grasas Y aceites 60(4): 388-395.
- Mills JB, Tumhimbise GA, Jamil KM, Thakker SK, Failla ML, et al. (2009) Sweet potato beta-carotene bioefficacy is enhanced by dietary fat and not reduced by soluble fibre intake in Mongolian gerbils. Journal of Nutrition 139(1): 44-50.
- King JC, Blumberg J, Ingwersen L, Jenab M, Tucker LK (2007) Tree nuts and peanuts as components of healthy diet. The Journal of Nutrition 138(9): 1736-1740.
- Panwar MB, Mathur PB, Bhaasharla VV, Reddy D, Sharma KK (2013) Rapid, accurate and routine HPLC method for large-scale screening of pro-vitamin A carotenoids in oilseeds. Journal of Plant Biochemistry and Biotechnology 24(1): 84-92.
- Pattee HE, Pierson JL, Young CT, Giesbrecht FG (1982) Change in roasted peanut flavor and other quality factors with seed size and storage time. Journal of Food Science 47(2): 455-456.
- WHO/FAO (2004) Vitamin and mineral requirements in human nutrition (second edition).
- Singh B, Singh U (1991) Peanut as a source of protein for human foods. Plants for Human Nutrition 41(2): 165-177.
- Bendini A, Cerretani L, Salvador MD, Fregapane G, Lercker G (2010) Stability of the sensory quality of virgin olive oil during storage. An overview. Italian Food and Beverage Technology pp. 5-18.
- Akusu MO, Achinewhu SC, Mitchell J (2000) Quality attributes and storage stability of locally and mechanically extracted crude palm oils in selected communities in rivers and Bayelsa states, Nigeria. Plant Foods for Human Nutrition 55(2): 119-126.
- Kirk RS, Sawyer R (1991) Pearson’s Composition and Analysis of Foods. In: Food (Food adulteration and inspection) Analysis. (9th edn), Longman Scientific and Technical, Harlow, UK.
- Shahidi F, Zhong Y (2005) Bailey’s Industrial Oil and Fat Products. In: Shahidi F (Ed.), Lipid Oxidation: Measurement Methods. (6th edn), John Wiley and Sons Inc, St. John’s, Canada, Volume 6.
- Haas, MJ (2001) Lypolytic Microoganisms, Enzymatic lipid hydrolysis (lipolysis). In: Downes FP, Ito K (Eds.), Compendium of methods of the microbiological examination of foods. (4th edn), American public health association, Washington, US, pp. 175.
- Ahn DU, Ajuyah A, Wolfe FH, Sim JS (1993) Oxygen availability affects prooxidant catalyzed lipid oxidation of cooked turkey patties. Journal of Food Science 58(2): 278-291.
- Auezova L, Saliba C, Moussa EH, Hosry LE, Yammine S, et al. (2012) A methodological approach to study almond oil stability in relation to alpha-tocopherol supplementation. Journal of Food and Nutrition Sciences 3(12): 1710-1715.
- Azhar KF, Nisa K (2006) Lipids and their oxidation in seafood. Journal of Chemical Society of Pakistan 28(3): 298-305.
- Mailer RJ, Graham K, Ayton J (2012) The effect of storage in collapsible containers on olive oil quality. Australian Government, Rural Industries Research and Development Corporation. Publication No. 12/008. Project No. PRJ-006488.
- Maestri DM, Nepote V, Lamarque AL, Zygadlo JA (2006) Natural products as antioxidants. In: Imperato F (Ed). Phytochemistry: advances in research, pp. 105-135.
- Aluyor EO, Jesu MO (2008) The use of antioxidants in vegetable oils- A review. African Journal of Biotechnology 7(25): 4836-4842.
- Ling LT, Palanisamy UD, Cheng MH (2010) Prooxidant/antioxidant ratio (ProAntidex) as a better index of net free radical scavenging potential. Molecules 15: 7884-7892.
- Boon CS, McClements DJ, Weiss J, Decker EA (2010) Factors influencing the chemical stability of carotenoids in foods. Critical Reviews in Food Science and Nutrition 50(6): 515-53.
- Bechoff A, Poulaert M, Tomlins KI, Westby A, Menya G, et al. (2011) Retention and Bioaccessibility of Beta-carotene in blended foods containing orange-fleshed sweet potato flour. Journal of Agricultural and Food Chemistry 59: 10373-10380.
- Wheatley C, Loechl C (2008) A critical review of sweet potato processing research conducted by CIP and partners in Sub-Saharan Africa. Social Science Working Paper No. 2008-4. The International Potato Center (CIP). Lima, Peru.
- Odu NN, Okonko IO (2012) Bacteriology quality of traditionally processed peanut butter sold in Port Harcourt metropolis, Rivers State, Nigeria. Researcher 4(6): 15-21.
- United States Department of Agriculture (USDA) (2010) USDA commodity requirements. PP12, Peanut Products for Use in Domestic Programs.
- Institute of Food Technologists and Food and Drug Administration (IFT/FDA) (2003) Evaluation and definition of potentially hazardous foods: Comprehensive reviews in food science and food safety. NSF International Volume 2.
- Behling RG, Eifert J, Erickson MC, Gurtler JB, Kornacki JL, et al. (2010) Selected pathogens of concern to industrial food processors: infectious, toxigenic, toxico-infectious, selected emerging pathogenic bacteria. In: Kornacki JL (Ed), Principles of microbiological troubleshooting in the industrial food processing environment, Food microbiology and food Safety. Behling food safety associates, Springer Science + Business Media publishers, Madison, Wisconsin, USA.
- FDA (2010) Water activity (aw) in foods. Inspections, Compliance, Enforcement, and Crimininal Investigations.
- https://members.wto.org/crnattachments/2013/tbt/UGA/13_4341_00_e.pdf
- Ogunwolu SO, Ogunjobi MAK (2010) Nutritional and sensory evaluation of cashew nut butter produced from Nigeria cashew. Journal of Food Technology 8(1): 14-17.
- Kilcast D, Subramaniam, P (2000) The stability and shelf-life of food. In: (2nd edn), Leatherhead Food Research Association. Woodhead publishing ltd, Cambridge, England.
- Food and Drug Administration (2012) Foodborne pathogenic microorganisms and natural toxins. In: Bad bug book. (2nd edn), Center for Food Safety and Applied Nurtition, USA, pp. 89-92.
- Okello DK, Biruma M, Deom MC (2010) Overview of groundnuts research in Uganda: Past, present and future. African Journal of Biotechnology 9(39): 6448-6459.
© 2019 Naveen Puppala. This is an open access article distributed under the terms of the Creative Commons Attribution License , which permits unrestricted use, distribution, and build upon your work non-commercially.
Editor In Chief


.jpg)


Signup for Newsletter

Quick Links
 Editorial Board Registrations
 Submit your Article
 Refer a Friend
 Advertise With Us
Our Recent Edition

.jpg)


Top Editors


.jpg)


.bmp)
.jpg)
.png)
.jpg)


.jpg)


.png)

.png)


.png)


Financial Support

Sponsors

Latest e-Books

Latest Video

 a Creative Commons Attribution 4.0 International License. Based on a work at www.crimsonpublishers.com.
Best viewed in
a Creative Commons Attribution 4.0 International License. Based on a work at www.crimsonpublishers.com.
Best viewed in