- Submissions

Full Text
Novel Techniques in Nutrition and Food Science
Technology of Refermentation Coffee Beans
Afriliana A1,3, Subagio A1, Erawantini F2, Yoshiharu M3, Taizo M3 and Harada H3*
1 Department of Agricultural Product Technology, Indonesia
2 Department of Medical Record, Indonesia
3 3Department of Environmental Science, Japan
*Corresponding author:Harada H, Department of Environmental Science, Japan
Submission: December 08, 2018;Published: February 28, 2019

ISSN:2640-9208Volume3 Issue3
Abstract
The purpose of this study is to produce specialty coffee by refermentation technology. To facilitate farmers in their implementation. Improving the quality of coffee which will affect the economic improvement of farmers.
Introduction
Indonesia is the fourth coffee producer in the world. Indonesian coffee production reaches 400 thousand tons per year [1]. So far, Indonesian coffee exports have declined, because the quality of coffee beans is still considered low. In processing coffee beans, two things that greatly affect the quality of coffee are the fermentation and roasting stages. Previous studies, for improving the quality of coffee beans were carried out by making starters, either by using bacteria, or yeast [2]. The starter is used for both semi-wet and wet fermentation. In our study, coffee bean refermentation technology were used to improve the quality of coffee beans. Implementation refermentation technology in dried coffee beans. The coffee used is robusta coffee (Canephora coffee). This is because in Indonesia, Robusta coffee is more numerous than Arabica coffee. Robusta coffee is usually not fermented by farmers [3]. The refermentation technology is done by making the condition of the coffee beans the same as before being dried, which has a water content of 50-60%. After that, it is fermented using a starter which is a combination of lactic acid bacteria (lactobacillus) and yeast (Saccharomyces cerevisiae) for 12 hours in an automatic microreactor machine. The microreactor is equipped with temperature control, stirring speed and the number of starters added.
Material and Methods
Material
The materials used were unfermented robusta coffee harvested from Sidomulyo Village, Jember Regency, Indonesia, lactobacillus mesentroides, Lactococcus lactis and Saccharomyces cerevisiae. The materials used for analysis were NaCl, and alcohol 70% were purchased from Merck, HCl, NaOH, standard glucose, and standard caffein. The tools used in this study were fermentor height 130cm, width 40cm (CV. Asmak Kopi, Indonesia), roaster capacity 10kg (AR, Indonesia), grinder, cuptest assessment forms, pH meters, Spectrophotometer (Hitachi, Japan), HPLC (GL sciences, Japan), FTIR (GL sciences, Japan), vortex (Hitachi, Japan).
Methods
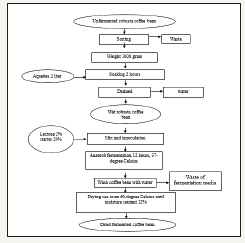
Fermentation of unfermented robusta coffee bean: Unfermented Robusta coffee was sorted from damaged beans and foreign objects. Robusta coffee resulted from sorting as much as 1000 grams was soaked in 2L using distilled water for 2 hours. Wet Robusta coffee beans were drained and added 2% lactose and 20% stater. Refermentation was carried out for 12hours using controlled temperatures of 37 ᵒC with two replicates. The next step was washing Robusta coffee beans using water. Then, it was dried use oven 60 ᵒC until the moisture content became 12%. Complete method described in Figure 1 below.
Figure 1:Flowchart fermentation of unfermented Robusta coffee bean.
Sample preparation for analysis: Fermented coffee beans are roasted using a temperature of 170-degree Celsius for 9 minutes (medium roasted) to form a flavor and reduce the water content of the coffee. Then roasted coffee was reduced in size using a grinder into coffee powder. The coffee powder produced was then tested cup test (sensory analysis) in the Indonesian coffee and cocoa research center laboratory in Jambe by expert panelists and chemical analysis. Flow chart of sensory analysis preparation and chemical analysis can be seen in Figure 2.
Figure 2:Flowchart of preparation sample of sensory and chemical analysis.

Sensory analysis
Sensory analysis was performed with cuptest using the UCDA method (2010). The panelists were two expert panelists and one trained panelist at the Indonesian Coffee and Cocoa Research Center Laboratory in Jember. Parameters of cup test were fragrance/ aroma, flavor, aftertaste, saltiness/acidity, bitterness/sweetness, mouthfeel/body, balance, overall, uniform cup and clean cup.
Chemical analysis
Glucose analysis (Nelson somogy method)
A. Standard preparation
Make standard solution 0,10,25,50,100, and 200μg/ml. 1ml of each standard put to test tube. Then add 1ml somogy reagent. Heat in boiling water for 20 minutes. Cooling 15minutes. Add 1ml nelson reagent. Adjust solution to 25ml distilled water. Then read absorbance at 550nm. Make curve of standard.
B. Sample preparation
1ml of each standard put to test tube. Then add 1ml somogy reagent. Heat in boiling water for 20 minutes. Cooling 15 minutes. Add 1ml nelson reagent. Adjust solution to 25ml distilled water. Then read absorbance at 550nm.
Protein analysis (Lowry method)
Standard preparation: 0.2ml of BSA working standard in 5 test tubes and make up to 1ml using distilled water. The test tube with 1ml distilled water serve as blank. Then, add 4.5ml of Reagent I and incubate for 10 minutes. After incubation add 0.5ml of reagent II and incubate for 30 minutes. Measure the absorbance at 660nm and plot the standard graph. Estimate the amount of protein present in the given sample from the standard graph.
Sample preparation: 1g sample added 200ml distilled water. Shaking for 1 hour. Take 50ml to erlemeyer flask. Then add 25% HCl 2.5ml put to erlemeyer flask. Put in to water bath 65 degree celcius for 20 minutes. Add 4mol/liter NaOH, and for neutralization using phenolphtalein. Adjust volume until 250ml using distilled water. Then measure absorbance using spectrophotometry.
Determination caffein by HPLC [4]
Standard solutions: Caffeine stock solution of 1000ppm was prepared by accurately weighing 100mg of pure caffeine and quantitatively transferring it into 100ml volumetric flask and making it to the mark with the mobile phase. Working standards of 10,20,40,60,80ppm were prepared by serial dilution of the stock solution with the mobile phase.
Sample preparation and analyte determination: 2g coffee samples were weighed in triplicate and put into 250ml beakers. 100ml of boiling distilled water was added and let to stand for five minutes with stirring, the solution was cooled and filtered into conical flasks. 5ml of the filtrate were pipetted into clean 50ml volumetric flasks and made to the mark with the mobile phase. The standards and the samples were run in the HPLC system. The following were the HPLC conditions: Column, Reversephase-ODS, 250×4.6mm, flow rate, 1ml/min, detector, photodiode array set at 278nm, pressure, 150khf/cm2, mobile phase, water, acetic acid, methanol (79.9, 0.1 and 20) and sample volume, 10μl. A calibration curve of peak areas versus concentration of the standards was plotted. The caffeine level of the various samples was calculated using the regression equation of the best line of fit.
Physical Analysis
pH value
Measurement of pH value using pH meter [5]. Dry coffee was dissolution in a ratio of 1:3 coffee beans and distilled water.
FTIR analysis [6]
Paper samples placed in the path of an infrared beam will absorb and transmit light and then the light signal will penetrate the sample to the detector. The detector measures the intensity of the radiation moving into a sample and the intensity of the radiation transmitting through a sample.
Results and Discussion
Sensory analysis
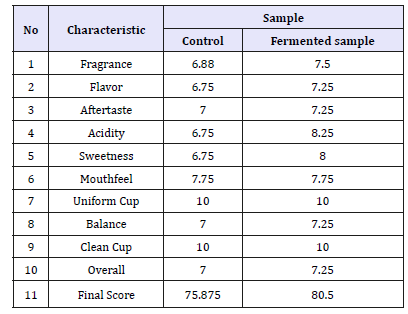
Robusta coffee taste test results (cup test) of Robusta coffee fermented by starter and lactose with test criteria include fragrance/flavor, flavor, aftertaste, acidity, sweetness, mouthfeel/ body, uniform cup, clean cup, overall, balance, and final score can be seen on Table 1. Based on Robusta coffee flavor test data, the overall characteristics of fermented sample have a high score 80.50 indicating that coffee is specialty coffee (>=80). Fragrance is an aspect of scent that includes the smell of coffee when it is dry or powder, while the smell is odor when the coffee is brewed with hot water. Treatment of starter addition with lactose media influences the aroma of coffee produced because of the process of breaking lactose into glucose by lactic acid bacteria (LAB). Glucose is used as a source of energy to produce metabolism in the form of organic acids which later functions as a precursor to the formation of flavor in coffee [7]. In addition, according to Nugroho (2014), the temperature of roasting also affects the formation of fragrance value or aroma of coffee beans. The standard roasting (medium) of aromatic components forms chocolaty aroma, but higher warming (dark) will burn the compounds aside sugar browning [8]. Flavor is a special trait between aromas, acidity, and ends with an aftertaste. The value of coffee flavor includes the influence of the quality and complexity of the combined flavor and aroma when coffee is drunk.
Table 1:Organoleptic test of Robusta coffee.
Chemical analysis
Results of chemical analysis can be seen in Table 2. From the table, glucose, caffeine, and protein levels have decreased. This is because in the fermentation process there is a degradation of several complex compounds in coffee beans, into compounds that are simpler by involving several microorganisms that aim to help release the layer of mucus that still envelops coffee. Data are presented as the proximate analysis method AOAC (2000), average (means)±Standard Deviation (SD), repetition (n=2). From Table 1, glucose drops to 6.9%, caffeine becomes 1.4%, and protein becomes 12.89%. When the fermentation process, lactic acid bacteria, namely Leoconostoc mesentroides and Lactococcus lactis will degradation glucose into lactic acid [9]. So that causes a decrease in pH and increase in temperature. This causes the yeast (Saccharomyces cerevisiae) can grow well. In other words, there is a symbiosis of mutualism between these microorganisms.
Table 2:Chemical composition of sample after refermentation.

Muchtadi et al. [5] states that the outside of coffee beans that are like gel or mucus, consist of 80% pectin and 20% glucose. The mucus layer of coffee beans that contain glucose, inoculum is used as a substrate. The reduced mucus layer causes water to enter the coffee beans more easily through the pores on the skin of the horn. The entry of water into coffee beans causes caffeine to dissolve. This is caused by the nature of caffeine which is easily soluble in water, according to the statement of [10] that caffeine is soluble in water. Caffeine dissolves in water because it can bind one water molecule. Macrone [11] also explained that protein decomposition causes reduced caffeine levels in coffee and will increase free amino acids. Saccharomyces cerevisiae can produce sucrose (invertase) and maltase enzymes that convert sugar to be easily fermented. Saccharomyces cerevisiae also produces proteolytic and amylolytic enzymes. Amylolytic enzymes will remodel carbohydrates into acids until a pH occurs in iso electrical point of the protein. Then the protein will be coagulated, and by proteolytic enzymes, the protein will be reduced so that it will accelerate the release of mucus [12].
Physical Analysis
Changes in pH value of coffee beans after fermentation
Figure 3:Changes of pH during refermentation.
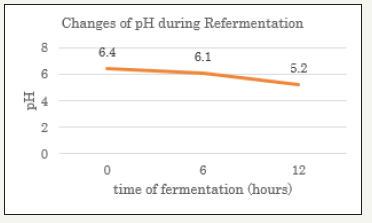
The results of measurement of pH value of coffee beans after fermentation can be seen in Figure 3. Coffee given the addition of starter and lactose media decreases significant pH of control coffee which was not given any additional substance. The more concentration of the added kefir starter, the more pH value decreases or the acidity increases. Fermentation can cause the pH of coffee beans to decline due to the breakdown of sugar or caffeine to be converted into acidic compounds such as lactic acid, acetate, butyric and propionate. These bacteria breaking sugar for 5 to12 hours during fermentation, because of breakdown of sugars such as lactic acid and acetic acid with greater lactic acid content and affect the acidity level. The decline in pH values is also reported by Wilujeng & Wikandari [13], stating that the length of fermentation will decrease pH due to amylolytic activity that degrades starch to glucose and then becomes lactic acid. This is supported by Wardani, pointing out that during fermentation, lactic acid bacteria will convert lactose into lactose glucose and galactose and then become lactic acid and make the pH decrease. Acidity in coffee is produced from chlorogenic acid, acetic acid, and other non-volatile acids. Acetic acid is obtained by reshuffling glucose, lactose, sucrose, raffinose, and stachyose through glycolysis process. The length of fermentation process will be the proliferation of acidic bacteria which leads to the increase of organic acids produced. The formed acids will be released into the environment causing changes in acidity.
FTIR analysis
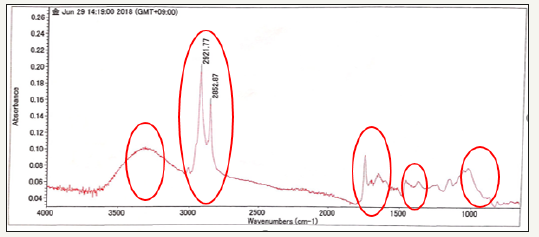
Components of ground coffee compounds can be seen in Figure 4 and Table 3. The two sharp bands that can be viewed in the 2800-3000cm-1 range have also been reported for both Arabica and Robusta roasted coffee samples, but no identification was attempted [14]. Nonetheless, studies of FTIR analysis of caffeine on soft drinks have also reported two sharp peaks at 2829 and 2882cm-1, with the later one being correlated with the asymmetric stretching of C-H bonds of methyl (-CH3) group in the caffeine molecule and the peak region being successfully used to develop predictive models for quantitative analysis of caffeine [15]. Samples after reference also show sharp peaks at wave number 2921.77- 2852.87. This means that the sample still contains caffeine. The sharp band at 1743cm-1 has been also observed on FTIR studies of roasted coffee [14,16]. In association to carbonyl (C=O) vibration in lipids [14] or to aliphatic esters [16]. After the refermentation process, ground coffee samples also contain carbonyl compounds, such as lipids and aliphatic esters. This is because the wave number 1658.45-1754.75 produces a sharp peak intensity [17-21].
Table 3:Components of coffee powder compounds after refermentation.
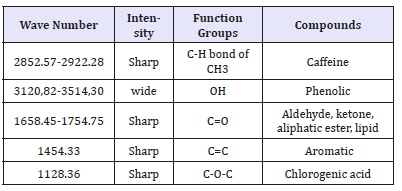
Figure 4:FTIR of coffee grounds.
Conclusion
Technology of refermentation can increase quality of coffee bean. From organoleptic test, this technology can increase score until 5 point or have score more than 80 (specialty coffee) [22- 27]. In addition, some compounds have decreased, namely glucose dropped to 6.9%, caffeine to 1.4%, and protein to 12.89%.
Acknowledgment
I am deeply indebted to my supervisor, Professor Hiroyuki Harada for warm support, inspiration and thoughtful guidance. Also, I would like to thank to Prefectural University of Hiroshima and Islamic Development Bank for financial funding this research.
References
- Kuntawee S, Akarapisan A (2015) Isolation and identification of aspergillus species producing ochratoxin a in arabica coffee beans. International Journal of Agricultural Technology 11(5): 1235-1242.
- Abdalall A, Amira HA, Talib A, Ebtisam A (2014) Aflatoxin and ochratoxin production in ground coffee during storage. Canadian Journal of Pure and Applied Sciences 8(2): 2825-2836.
- Oliveira G, Silva DM, Pereira RGFA, Paiva LC, Prado G, et al. (2013) Effect of different roasting levels and practice sizes on ochratoxin a concentration in coffee beans. Journal of Food Control 34: 651-656.
- Ocnaru E, Doni BM, Cheregi M, Mihaela CC, Maria LJ, et al. (2014) A robust method for determination of ochratoxin a in wine samples by SPE and HPLC-FLD. Revista de Chimie-Bucharest 65(5): 516-520.
- FAO (2004) Good hygiene practice along the coffee chain: overview of analytical methods for ochratoxin a. FAO food and Nutritional Organization 81: 1-8.
- Leah MM, Koskei R, Mburu M (2017) Moulds and ochratoxin an associated with green coffee (coffea arabica) beans processed by dry and wet methods in nyeri country. IOSR Journal of Environmental Science, Toxicology, and Food Technology 11(6): 66-72.
- Cappozzo J, Jackson L, Jung LH, Zhou W, Taher FA, et al. (2017) Occurrence of ochratoxin a in infant foods in the united states. J Food Prot 80(2): 251-256.
© 2019 Harada H. This is an open access article distributed under the terms of the Creative Commons Attribution License , which permits unrestricted use, distribution, and build upon your work non-commercially.
 a Creative Commons Attribution 4.0 International License. Based on a work at www.crimsonpublishers.com.
Best viewed in


.jpg)


 Editorial Board Registrations
 Submit your Article
 Refer a Friend
 Advertise With Us
.jpg)


.jpg)


.bmp)
.jpg)
.png)
.jpg)


.jpg)


.png)

.png)


.png)


