
- About Us
- Information
-

The Author ensures that the research has been conducted responsibly and ethically with adherence to all relevant regulations. read more..
- For Authors
- For Reviewer
- Manuscript Guidelines
- Membership
- Publication Ethics
-
- Journals
- Reprints
- e-Books
- Videos
- Policies
- Contact Us
 COVID-19
- Submissions


Full Text
Novel Techniques in Nutrition and Food Science
Quality Criteria Establishment for Dissolution of Ascorbic Acid from Sustained Release Pellets
Mostafa Essam Ahmed Mostafa Eissa*
Department of Microbiology and Immunology, Cairo University, Egypt
*Corresponding author: Mostafa Essam Ahmed Mostafa Eissa, PhD Researcher, Department of Microbiology and Immunology, Faculty of Pharmacy, Cairo University, Cairo, Egypt
Submission: April 14, 2018;Published: May 22, 2018

ISSN 2640-9208 Volume2 Issue2
Abstract
With the advancement in the manufacturing industry of the food additive and supplements coupled with ever-increasing challenges in the health risk hazards, the establishment of strict control measures become essential to ensure product quality and safety. A small firm for manufacturing of food supplements and additives established a production line for a new product based on L-ascorbic acid (vitamin C) 500mg per hard gelatine capsule. Ascorbic Acid is provided as sustained release pellets. One of the important quality control tests that should be inspected was the dissolution profile after one, four and eight hours. Dissolution rate test was performed for 70 consecutive batches and results were interpreted. The best-fitting model that described the dissolution rate was Morgan-Mercer-Flodin (MMF) Model which is Sigmoidal four parameter mathematical curve. Establishment of Control Limits (CLs) was determined for each chronological test point using commercial statistical software package. Control limits standard deviations (sd) for one, four and eight hours were 28.1%±3.5%, 68.1%±4.1% and 89.4%±3.3%, respectively. On the other hand, the calculated lower and upper control limits (LCL, UCL) were (21.1%, 35.1%), (59.3%, 77.0%) and (81.6%, 97.2%), respectively. Interestingly, no Out-Of-Specification (OOS) results were detected for individual lots of product, yet UCLs exceeded Upper Specification Limits (USLs). This shift in the dissolution rate process is evident, especially in four hours point. Within/Overall Capability plots confirmed this finding with strong shift was detected to the right side that indicated a crucial need for investigational analysis. Accordingly, Statistical Process Control (SPC) provided provision for early warning of deviations in the manufacturing process cycle of the product before any true excursions may occur. The selection of product that has simple manufacturing processing steps such as Vitamin C will aid in the spotting of the most probable causes of hidden deviations which may be related to consistency of raw materials quality and/or laboratory system related-deviations.
Keywords: Ascorbic acid; Hard gelatin capsule; Pellets; Dissolution rate; MMF model
Abbreviations: MMF: Morgan Mercer Flodin; CL: Control Limit; LCL: Lower Control Limit; UCL: Upper Control Limit; USL: Upper Specification Limit; SPC: Statistical Process Control; HGC: Hard Gelatin Capsule; API: Active Pharmaceutical Ingredient; QC: Quality Control; QA: Quality Assurance
Introduction
Many animals can synthesize vitamin C, which is known also as L-ascorbic acid, endogenously. However, the human body, in contrast to these organisms, has not the ability to synthesize this compound. Accordingly, it may be acquired from exogenous source as food supplement [1]. Vitamin C is involved in protein metabolism in addition to the synthesis of several biomolecules such as L-Carnitine, collagen and certain neurotransmitters [1,2]. Moreover, L-ascorbic acid acts as an antioxidant and has an important role to regenerate other antioxidants within body such as α-tocopherol, which is also called vitamin E [3,4]. In addition, L-ascorbic acid has a crucial function in the immune system [3] and enhance the absorption of non-heme iron [5]. Due to the physiological importance of vitamin C, deficiency in its daily intake causes disease condition known as “Scurvy”, with prominent signs include: lassitude, fatigue and fragile capillary system associated with widespread connective tissue weakness [6-9].
Due to the clinical and physiological importance of vitamin C, it has been incorporated in different forms by the manufacturers of the medicinal drug products [10]. During the last decades, extended release formulations became more common and popular because they offer several advantages over the classical dosage forms in terms of financial costs, toxic effects, dosing regimen and instability of blood plasma concentrations [11]. Efficiently low but therapeutically effective plasma concentrations of the active medicinal products can be achieved usually between 8 and 12 hours coupled with minimized risk of local irritation are among major advantages of the prolonged release drug forms [12-15].
However, the efficacy and quality of the medicinal product delivered to the final customer is largely dependent on the monitoring of certain inspection properties using statistical tools. Statistical Process Control (SPC) may be defined as the utilization of factual techniques to check and monitor current procedure to guarantee that it works at its maximum capacity to create acceptable units. Under SPC, a procedure carries on typically to create however much accommodating item as could reasonably be expected with the minimum conceivable waste. While SPC has been connected most as often as possible to the controlling of manufacturing and production lines, it applies similarly well to any procedure with a quantifiable yield. Using SPC techniques will allow for triggering continuous enhancement projects [16].
Since the final consumable products affect human health directly, monitoring of manufactured batches should be strictly controlled in terms of quality and consistency. The present study aimed to apply SPC on one of the important inspection characteristics of L-ascorbic acid sustained release pellets in form of Hard Gelatin Capsule (HGC) viz. dissolution rate of Active Pharmaceutical Ingredient (API) at predefined intervals. A newly installed plant for manufacturing of food supplements and additives has launched this vitamin C product and performed long-term inspection about the current state of quality of the manufactured product and the level of improvement needed to ensure compliance and stability of the dosage form quality characteristics.
Materials and Methods
A recently established plant for food supplements and additives manufacturing has launched a new product as HGC containing sustained release vitamin C pellets. Detailed data of dissolution test of 70 successive batches of the product from Quality Control (QC) laboratory were collected and processed by the quality team of the firm - using commercial statistical software packages - to investigate the current state of the firm compliance to GxP and the degree of improvement required. This work is part of total quality characteristic monitoring project that guides the industry futuristic development. GxP refers to Good (G), broad set of quality references and guidelines (x) and Practice (P) (International Society for Pharmaceutical Engineering [17].
The Content of each Capsule includes 600mg of vitamin C pellets with a net content of ascorbic acid equivalent to 500mg. Other inactive components are beeswax, stearic acid and microcrystalline cellulose. The Dissolution test was performed for 70 batches based on an internal method developed by the manufacturer of the sustained release pellets. Dissolution medium was made of buffer pH 2.9, volume 900ml and in USP paddle apparatus with speed 100rpm.
Figure 1: Simplified manufacturing process diagram of ascorbic acid capsule

Simplified manufacturing processing steps were illustrated graphically as shown in (Figure 1) Determination of the process limits and parameters: Centre line and control limits are calculated as detailed literally as detailed in Minitab [18]. Determination of best fitting model for curve was determined using Curve Expert Version 1.4. Correlation analysis, outlier’s detection and column statistics were executed using Graph Pad Prism Version 6.01 for Windows.
Result and Discussion
Results of the dissolution test for 70 batches of vitamin C HGC are shown in (Figure 2) with out-of-control batches are indicated with red points. Figure 3 shows concurrent comparative dissolution pattern of the pellets at different testing intervals with slightly decreasing trend over time. It should be noted that No outliers were detected using ROUT (at Q =10.0%) which was recommended method by Graph Pad Prism. Data did not show any Out-Of-Specification (OOS) results.
Kinetics of dissolution of L-ascorbic acid can be expressed by the following model:
Morgan-Mercer-Flodin (MMF) Model (Sigmoidal four parameter mathematical curve):
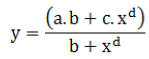
Where: Coefficient Data for control limit (CL) calculation are the following: a =1.41E-011, b =3.64E+000, c =1.30E+002 and d =9.99E-001. y =Fraction of vitamin C dissolved after x hours. Coefficient Data for lower specification limit (LSL) determination are: a =5.38E-002, b =1.15E+004, c =2.28E+005 and d= 6.71E-001. On the other hand, upper specification limit (USL) coefficient data are a =-2.30E-009, b= 4.48E+000, c =1.92E+002 and d =7.62E- 001. On the other side, LCL and UCL coefficient parameters are a =-1.85E-011 and a =6.40E-011, b =4.82E+000 and b =2.84E+000, c =1.23E+002 and c =1.35E+002 and d =1.09E+000 and d =9.62E- 001, respectively. They are presented graphically in Figure 4.
Figure 3: Trending charts showing the general dissolution profile after one, four and eight hours of 70 batches of Ascorbic Acid pellets with mean, UCL and LCL indicated (red spots are out-of- control points).

Figure 4: Concurrent comparative study of dissolution profile of 70 batches of Ascorbic acid showing general decreasing trend line (solid black line).

Figure 5: Dissolution rate of vitamin C showing control level (CL)±standard deviation (sd), lower control limit (LCL), upper control limit (UCL), lower specification limit (LSL) and upper specification limit (USL).

Figure 5 demonstrates overall/within capability plot for the three sections of the dissolution test. Figure 5B shows strong shift of the process to the right side i.e. towards USL. The greater spreading of the overall over within dissolution process indicates unstable and unsatisfactory performance over long run assessment study.
Statistical quality control is a strategy by which organizations collect and break down gathered information on the fluctuations which happen within processing activity time with a specific end goal to figure out whether improvements are required [19]. Accordingly, interpretation of results in Figure 2 was subjected to SPC analysis to monitor its quality and improvement required rather than reliance on reporting individual observation results only which did not show either Out-Of-Specification (OOS) nor outlier values from the test.
MMF model of dissolution in the current study, that was shown in the curve of Figure 4, is different from the pattern shown by other researchers [15,20]. This is an area for extended research to elucidate the variation in the dissolution due to pellets engineering.
Overall capability must be close enough to short-term one to ensure process stability and predictability and at the same time drifting to either limiting boundaries of the specification should be avoided. Moreover, CL should be contained within SL of the process [21,22]. So, the process did not show stability over long run with CL exceeded SL indicating that improvement is required. In addition, strong shift toward higher rate was evident at four hours point of the dissolution test. The pellets have been obtained from the same source during the manufacturing of 70 batches after QA investigation of the facility. Nevertheless, some investigators had demonstrated that the release of ascorbic acid is different between individual pellets which in turn are affected by unique microscopic surface defects on each unit [23]. Thus, the manufacturing of controlled release materials should be under the condition of statistical control to produce a consistent outcome in the dissolution study.
Little influence on the product quality could be impacted by production because the whole manufacturing steps are automated as demonstrated in Figure 1. Possible influential factor from automatic filling is the average filling weight, which was found to show low correlation with the dissolution pattern suggesting that it has low (if any) effect on the true stability of the dissolution rate. Based on these findings, further investigation is required to determine the root cause of such state of instability which may be due to the supplier quality issue and consistency of the pellets and/or laboratory analysis problems which may be related to instruments, methods and/or analysts training.
Conclusion
SPC provides an important tool to assess the quality of the inspection characteristics and provisionally predicts the compliance of the underneath involved processes to GxP rules. In the present study, the automated manufacturing stages coupled with the absence of interfering processing steps that influence the quality parameters of the final product limit the questionable sources of out-of-control and instability of the investigated process. In the current case, the most probable cause is quality control good laboratory practice (GLP) issue with the possibility of unstable dissolution pattern that may be originated from the manufacturer of the sustained release pellets.
References
- Li Y, Schellhorn HE (2007) New developments and novel therapeutic perspectives for vitamin C. Nutr 137(10): 2171-2184.
- Carr AC, Frei B (1999) Toward a new recommended dietary allowance for vitamin C based on antioxidant and health effects in humans. The American journal of clinical nutrition 69(6): 1086-1107.
- Frei B, England L, Ames BN (1989) Ascorbate is an outstanding antioxidant in human blood plasma. Proc Natl Acad Sci U S A 86(16): 6377-6381.
- Jacob RA, Sotoudeh G (2002) Vitamin C function and status in chronic disease. Nutr Clin Care 5(2): 66-74.
- Gershoff SN (1993) Vitamin C (ascorbic acid): new roles, new requirements? Nutrition reviews 51(11): 313-326.
- Institute of Medicine, Food and Nutrition Board (2000) Dietary reference intakes for vitamin C, vitamin E, Selenium and Carotenoids. National Academy Press, Washington, DC, USA.
- Stephen R, Utecht T (2001) Scurvy identified in the emergency department: a case report. J Emerg Med 21(3): 235-237.
- Weinstein M, Babyn P, Zlotkin S (2001) An orange a day keeps the doctor away: scurvy in the year 2000. Pediatrics 108(3): e55-e55.
- Wang AH, Still C (2007) Old world meets modern: a case report of scurvy. Nutrition in Clinical Practice 22(4): 445-448.
- Mayo Clinic (2017) Ascorbic Acid (Oral Route). DRG-20068031 Drugs & Supplements, Ascorbic Acid (Oral Route).
- Aulton ME (2007) Aulton’s Pharmaceutics: The Design and Manufacture of Medecines. (3rd edn), Elsevier, Philadelphia, USA, pp. 145-151.
- Chopra R, Alderborn G, Podczeck F, Newton JM (2002) The influence of pellet shape and surface properties on the drug release from uncoated and coated pellets. International journal of pharmaceutics 239(1): 171- 178.
- Sadeghi F, Ford JL, Rajabi Siahboomi A (2003) The influence of drug type on the release profiles from Surelease-coated pellets. International journal of pharmaceutics 254(2): 123-135.
- Lecomte F, Siepmann J, Walther M, MacRae RJ, Bodmeier R (2004) Polymer blends used for the aqueous coating of solid dosage forms: importance of the type of plasticizer. J Control Release 99(1): 1-13.
- Aleksovski A, Spaseska Aleksovska E, Jašić, M (2012) Formulation and evaluation of ascorbic acid extended release hydrophilic matrix tablets by using hydroxypropyl methylcellulose and polyethylene oxide as matrix forming polymers. Hrana U Zdravlju I Bolesti 1(2): 22-31.
- Pharma IQ, a division of IQPC (2017) Statistical Process Control (SPC). Pharmaceuticals & Biotechnology Pharma & Biotech Resources.
- International Society for Pharmaceutical Engineering (ISPE) (2017) GAMP® Good Practice Guide: GxP Compliant Laboratory Computerized Systems.
- Minitab I (2014) MINITAB release 17: statistical software for windows. Minitab Inc., USA.s
- Shah S, Shridhar P, Gohil D (2010) Control chart: A statistical process control tool in pharmacy, Asian Journal of Pharmaceutics 4(3): 184.
- Andreazza I, Ferraz H (2011) Preparation of pellets containing highly soluble drug by extrusion/spheronisation and coating with kollicoat® SR 30D. Braz arch bio technol 54(2): 315-320.
- Scibilia B (2015) A Simple guide to between / within capability.
- (2016) Interpret the capability plot in capability sixpack Minitab.
- Förmer P, Theurer C, Müller A, Schmidt PC (2006) Visualization and analysis of the release mechanism of shellac coated ascorbic acid pellets, Die Pharmazie. An International Journal of Pharmaceutical Sciences 61(12): 1005-1008.
© 2018 Mostafa Essam Ahmed Mostafa Eissa. This is an open access article distributed under the terms of the Creative Commons Attribution License , which permits unrestricted use, distribution, and build upon your work non-commercially.
Editor In Chief


.jpg)


Signup for Newsletter

Quick Links
 Editorial Board Registrations
 Submit your Article
 Refer a Friend
 Advertise With Us
Our Recent Edition

.jpg)


Top Editors


.jpg)


.bmp)
.jpg)
.png)
.jpg)


.jpg)


.png)

.png)


.png)


Financial Support

Sponsors

Latest e-Books

Latest Video

 a Creative Commons Attribution 4.0 International License. Based on a work at www.crimsonpublishers.com.
Best viewed in
a Creative Commons Attribution 4.0 International License. Based on a work at www.crimsonpublishers.com.
Best viewed in