
- About Us
- Information
-

The Author ensures that the research has been conducted responsibly and ethically with adherence to all relevant regulations. read more..
- For Authors
- For Reviewer
- Manuscript Guidelines
- Membership
- Publication Ethics
-
- Journals
- Reprints
- e-Books
- Videos
- Policies
- Contact Us
 COVID-19
- Submissions


Full Text
Novel Research in Sciences
Design of Hybrid Laminar Flow Control System for Aircraft Wings
Muhammad Mohamed Faizan Pathana1 and Amir Zare Shahnehb2*
1Cranfield University, College Road, Bedfordshire, MK43 0AL, United Kingdom
2School of Aerospace, Transport and Manufacturing, Cranfield University, College Road, Bedfordshire, MK43 0AL, United Kingdom
*Corresponding author: Amir Zare Shahnehb, School of Aerospace, Transport and Manufacturing, Cranfield University, College Road, Bedfordshire, MK43 0AL, United Kingdom
Submission: October 10, 2022;Published: December 16, 2022
.jpg)
Volume13 Issue1December , 2022
Abstract
Background: Aviation industry is working towards making the future flights fuel efficient by improving
the performance of the aircraft technology. Airlines are looking to keep their costs lower and get the
most efficient flights. This is a great challenge in coming years for aerospace engineers to improve the
performance of the flight and help it complete long-range missions in future. Thus, this report is based
on the experimental aircraft by NASA known as X-48 which is blended wing aircraft. The aircraft as a
full scale is taken and a hybrid laminar flow control system is introduced into the wings so as to see its
effect on the aerodynamic performance and thus try to lower the aircraft drag. The effects of skin-friction
associated drug are to be dealt with and the laminar layer is to extend.
Methods: The baseline aircraft is taken, and initial aerodynamic parameters are evaluated using CFD
tools such as ANSYS Fluent. The hybrid laminar flow control system would then be designed, modelled
in CAD and henceforth would be evaluated to see the system performance. The passive suction system
would also be designed and simulated in CFD environment to compare with baseline design.
Results: The system developed helps to lower the zero-lift drag by nearly 31.2%. The system also helps
to lower the aircraft’s system weight by nearly 5%. The simulations performed in ANSYS show that
perforated wing surfaces help to increase the L/D ratio of the wing surface from around 5.1 in base-line
design to 20.3 with perforations. Moreover, the drug power needed will be lowered by nearly 54.4% and
the range increases by nearly 1.87 times.
Conclusion: As a conclusion it can be said that the developed system has achieved the aim of lowering
the aerodynamic drag and saved the fuel weight to a great extent. Also, the system has ensured that range
performance has increased. The improvements in the system in the future would be looking at modelling
the turbo compressor in the system for detailed CFD analysis, evaluation at different AoA’s, looking more
into manufacturing capability and cost modelling.
Keywords: Hlfc; Catia; Ansys; Cfd
Background
There has been for a long time quite a lot of research about the effects of drag on aircraft surfaces and the possible means of reduction of drag so as to ensure better performance of the aircraft aero dynamically. The most frequently and successfully used ones are the laminar control-methods and trying to optimize the geometry and form of the aircraft wings. The main aim of the report as labelled out within the abstract is to ensure drag reduction on the aircraft, hence improving performance and lowering the consumption of fuel to a greater extent, thus lowering associated penalties. Means of lowering the aircraft drag are innumerable, but within the scope of this project, the main aim is to extend laminar layer, lowering hence the aircraft drag and this will be seen analytically and by means of CFD. The effects of both the form and the viscous-drags will be accounted for in the initial analysis and the final flow-control values will be compared to this. So as to carry out this work, the main software which will be used is FLUENT in ANSYS which is obviously a CFD tool.
In terms of flow control, two of the primarily used ones are the laminar flow control and Hybrid Laminar Flow Control (HLFC). The former consists of an opening which allows the airflow to flow in and out of the trailing edge. No additional power is required for airflow to reach the trailing edge. The hybrid laminar flow control is used as a suction system. The primary function is to increase the thickness of boundary layer at the lower surface of the wing by allowing airflow to enter the system. Thus, it will ensure constant laminar flow and will prevent flow separation. Moreover, a complex system is needed in order to have a good amount of suction. However, in case of low levels of suction, the boundary layer won’t be affected. On the contrary, a high level of suction can cause pressure issues to the upper region of the wing. The suction system is known as the central part of the HLFC system. This suction is caused by the pressure difference created between the surface of the airfoil and the plenum underside of the surface. This pressure difference is caused by the active system known as the component e.g., compressors that occurs among the airfoil surface and the outlet section. In order to make this HLFC system, the perforations needed to be perforated at the surface of the wing. In order to make the perforations advanced manufacturing techniques are used to create the perforations on the titanium (Ti) sheet and then can be able to attach the titanium sheet with the CFRP structure of leading edge. Some of the requirements for the HLFC system are labelled out in the following image as follows [1] (Figure 1).
Figure 1:HLFC Suction system requirements and interfaces [30].

The baseline design taken for the research is a blended-wing design inspired from the NASA X-48 and is a full-scale realizable aircraft based on the tested prototype by NASA. This model is taken so as to view the aerodynamic characteristics along the wing in particular without taking into account other surfaces like the tail, etc. as the research is mostly based on the aerodynamic investigation rather than looking into the flight dynamic analysis. The tail and engines hence are not part of aerodynamic study. Similarly, the study of optional additional surfaces such as winglets has been neglected and might be part of future work (Figure 2). The characteristics of the aircraft selected are listed in the next table. These characteristics would include the characteristics of the wing, the fuselage features and so on. Moreover, certain important parameters associated with wing geometry are also listed. The methodology is based on the simulation of baseline design through a CFD software such as FLUENT and then mainly focus on the drag reduction by means of creating the system design for flow control, find drag analytically and by simulation and hence compare the results of baseline design with the hybrid laminar-flow control results. More than looking into the aerodynamics of the baseline design, maximum focus will be on the flow control methodology and drag reduction (Figure 3 & Table 1).
Figure 2:Rendered view of baseline aircraft.

Figure 3:Methodology used for the research work.

Table 1:Baseline Aircraft Parameters.

Initial aerodynamic data
Initial aerodynamic estimates were done for baseline aircraft
using ANSYS Fluent. The methodology used is:
a) Model generation-The model generation is the first step
in the pre-processor part of the CFD process. The 3D CAD modeling
of X-48 aircraft is required. Then after making the 3D model, it is
imported into the Ansys software inside the enclosure which is
called “Making the computational domain”.
b) Mesh generation - The mesh generation is the next key
step in the pre-processor step of the Ansys where the
computational domain created is divided into many
elements and cells. This helps to calculate various
parameters such as the pressure, velocity and temperature
c) Setting boundary conditions – The next step involves
setting up the boundary conditions of the computational
domain. These boundary conditions involve setting
velocity, temperature and pressure of the fluid.
The analysis was to be done aminly on the half-model when taken in 3D and hence in the ANSYS Fluent Design Modeler section, the geometry was imported and the enclosure generated. The geometry was then meshed using the mesh settings and was obtained as follows (Figure 4). The solver is then set-up based on the following parameters and then run later for around 150-200 iterations with time-step of 0.1 seconds and the values obtained are tabulated in the next few tables. These values are indicated for simulations carried out at different AoA’s and for 2D and 3D simulations (Table 2-4) (Figure 5 & 6).
Figure 4:Mesh generated and skewness improvement in mesh.

Figure 5:Velocity Streamlines.

Figure 6:3D Half-body simulation.

Table 2:CFD Simulation setting..

Table 3:3D simulation results at different AoA’s.

Table 4:2D simulation results at cruise altitude.

Methods
HLFC system design
For the system design, certain limitations have to be accounted
for initially. This is based on literature review and design
considerations, and these include:
A. Manufacturing limitation: Minimum hole diameter of 50
micrometers and minimum spacing ratio of 5 based on
available laser drilling technology [2].
B. Speed limitation through hole: The maximum speed which
has been suggested is 40m/s because if velocity is greater
than this velocity will lead to the roughness of the flow
and influence the outcome of the flow control method.
C. Material used for skin structure: Perforated titanium Ti-
6AL-4V is used widely for outer skin purposes due to
its high mechanical strength, corrosion resistance and
efficient weight properties [3-7].
The design parameters of the system designed were calculated in terms of the mass-flow rate, X-factors and Y-factors etc. are calculated across the wing surface. The X- factor can be calculated by knowing the mass flow rate through the holes at different altitudes and Cq values and the dynamic viscosity, thickness of the skin. Before X-factor calculated, the mass flowrate through holes can be evaluated by:
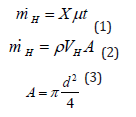
X is a factor
MH is the mass flow rate through the holes
A is the area of the hole(m2)
D is the diameter of the hole 50 micrometers
t is the thickness of the skin (m)
μ is the dynamic viscosity
After the X factor is calculated at various Cq values and the altitude then Y factor is evaluated as [2]:
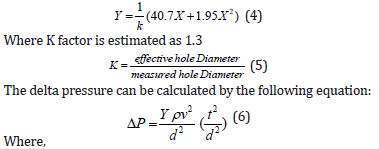
Where,
Y is a factor
D is a diameter of the holes = 50 micrometers
t is the thickness of the skin (m)
ρ is the density (kg/m3)
v is the kinematic viscosity
ΔP is the pressure drop (pa)
The final parameters evaluated at 12,192m for aircraft is presented in the next table. It gives the information about key parameters which were used to design the HLFC system (Table 5). The suction system power needs to be estimated as one of the key design parameters so as to design the turbo compressor. The pressure losses and the suction power estimation method are defined schematically as follows [2] (Figure 7). In addition to this methodology, certain diagrams such as the Cordier diagram would be needed to decide upon the type of turbo-compressor to choose based on specific speed and specific diameter (Figure 8 & Table 6).
Table 5:HLFC System Design Parameters.

Table 6:Turbocompressor specifications.

Figure 7:Suction System Power estimation method and losses [15].

Figure 8:Cordier diagrams [30] [15]..

CAD modelling of HLFC system
The integral parts of the wing’s structure include the spar and ribs. These components of wing play essential role in providing the structural strength to the wing. The main duct is goes past the structural layout of the wing. The structural re-enforcements were done in CATIA and also the turbo compressor which is placed on the underside of fuselage. The two turbo compressors show the system redundancy in case of failure of one. Moreover, the structural members, namely the ribs are perforated at the leading edge for suction control. The complex structure require duct to be intact with the ribs without compromising with the strength of the overall wing. This in turn has drawback, as duct going through the ribs could lead to pressure losses. This is why turbo compressor is placed near the fuselage to accommodate for the pressure losses and provide power to the HLFC system. The turbo compressor is located near the nose area close to the NLG which has a primary function to recycle the suction pressure for keeping the aircraft computer system cool. The pressure enters in the turbo compressor via the main duct inlet and then leaves via the outlet to the aircraft computer system room. The collector feeder ducts are compensating for the pressure losses to provide adequate inlet pressure to the turbo compressor whereas the pressure filters give an option of setting a desired pressure for the system.
Collector-feeder mechanism would be used in the system so as to inter-connect the collector regions to the main-ducting system. As pressure in system is usually defined by the inlets and outlet values of turbo-compressor, pressure filters would be required within collector-feeder mechanism so that values of pressure within each of the collectors can be at a certain necessary pressure. These filters are usually porous designed sheets and can hence be fashioned in similar manner as outer sheets/skin since the flowrates and variations in pressure are quite known. Usually, the recommendations provided are that sizing of hole is over 50-micrometers when used within outer-skin surface as injected insect/water or ice would not be clogging-up these filters. Also, the velocity through hole would not be limited to a fixed value of close to 40 m/s as these distorted surfaces are not on the wing region and thus there would not be any kind of non-intended and pre-maturely generated flows. Usually also, the main ducting mechanism is slightly on the bent side while trying to make sure that near the collector region, there would be enough clearances for the feeder-ducting system and at other locations, the location of the duct would be as much as feasible near the upper region so as to ensure maximum spacing availability for flaps mechanisms and actuation system.
Also, while taking the fact that the flow is non-compressible as velocity is maintained below the value of Mach 0.4 and close to 0.3, the sizing of the ducts is done in a manner that velocity and flow within duct is kept underneath the limitations as the ducting would be hence minimum as possible in order to lower space and the weight. In case later on after the designing process there is greater availability of space, sizes of the duct would be made bigger and hence the flows in the ducts/flow-speed can be lowered and losses too lowered substantially. Moreover, design assumptions would also include the fact that the air being taken in via the perforated skin would be sucked forward to nearby located collectors. This would give calculations of volume flow rates which has already been done earlier in the design process. Further discussion would also be about the turbo-compressors and the system safety needed with redundancy. It was mentioned earlier that there would be two of such turbo-compressors and the proposed designs would have one each with the single and double and hence penalties and other factors calculated later on for both. It is obvious the redundant option is much better though adding to weight, yet increases the safe functioning while also adding that if one of the turbo-compressors would fail, then the others would be functional. Also, the functioning would always be at fifty percentage of max. capability (Power) so as to make sure system is working and functioning smoothly.
Flexible hyper-line FX hoses are to be used so that they do not interfere with movement of control surfaces. In case of removal of water from the system, either it could be drained-out by simple water drain-holes or by usage of techniques such as purged air. One method to remove the water accumulated is thus by making use of drain-holes, in regions where there is greater likelihood of pooling of water. This is more possible in cases of HTP’s and regions of the wing, where gravity helps to drain out water. Added mass flow is hence found as:

Similarly, hot-air bled from engines and blowing through porous-skin section, could be used for the purpose of de-icing and de-insect mechanism. Anti-insect mechanisms comprise of KRUGER flaps as deflectors or simple spray fixed on these flaps aimed at the leading edges (Figure 9).
Figure 9:CAD Model of the HLFC System with various features and water-drain method depicted.

LFC system performance
The system performance is evaluated based on the following aerodynamic equations:
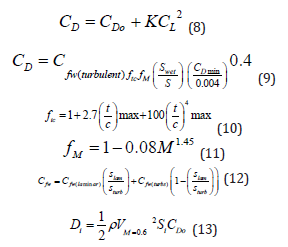
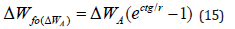
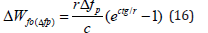
In the HLFC system, the weights of the system would have to be calculated taking into account the active and the passive suction. Moreover, the weight of the skin-area would be directly related to the region where there is suction. These areas have been calculated span-wise and are included within the appendix for further details. The thickness of the Ti sheets used is a standard 1 milli-meters and with a density value of 4500 kilograms/cubicmeter, fibre-glass used with density of around 450-500 kilograms/ cubic-meter, the mass of the skin found by taking the internal CAD design and hence the outer region of the wing was having a value of close to 65 kilograms. The system includes collector regions and ducts, together with filters and hence this, when included with a suitable thickness, making use of Aluminium alloys of density around 2700 kilograms/cubic-meter would give mass of around 95 kilograms for the collector and similarly another 4-5 kilograms for the ducts. The level of redundancy also plays a role and hence the double-redundant one would have greater weight and hence weight addition in the range of 2-3 kilograms/wing. Mass of the single-turbo-compressor will be 45 kilograms and hence this can be taken by summing up the individual values or simply estimating using CAD model by applying material to each section. As such, if there is two for a redundant system, then the weight gets doubled. Hence the final weight of the HLFC system would be 337.6 kilograms for the non- redundant, single turbo-compressor and for redundant one around 422.6 kilograms. The weight penalty is the summation of the weights of the system and the penalties associated with the fuel penalties. These penalties are due to the effects of weight. There are mainly three driving factors, the system weight denoted by (ΔWfo(ΔWA)), the lowering in the performance of the engine and hence the off-takes within the system denoted by (ΔWfo(Δfp)) and the effects of the drag associated with the aircraft depicted by (ΔWfo(ΔD)). In the case of the hybrid laminar flow control methodology, there is lowering of the drag of the system and hence the value of penalties due to system’s drag would be a negative one and it is expected that this reduction in penalty would be outweighing the effects of the system’s weight and the power offtakes. Mathematically, the overall weight penalty is given by:

The consideration taken for the sake of making the calculations simple is that aircraft would be cruising at the AAM or the average value of the aircraft mass and is taken as a consideration to be 60 percentage of the DFM or the design-fuel mass. As there is greater need for fuel in the climb stage and lowering in the descent phase, this approximation is alright. The system masses were estimated earlier and hence the non-redundant and the redundant systems would have total weight WA of 3311.856 Newtons and 4145.706 Newtons respectively. Moreover:
Here, the specific fuel consumption of the engine at cruising condition is denoted by ‘c’, the mission time is depicted by ‘t’ and the value of acceleration due to gravity; ‘g’ taken as 9.81, the value ‘r’ is the average Lift/Drag ratio in the cruising condition and for the design taken and analysed earlier by CFD, this is 18. In the cruise conditions, there are several means of calculating the SFC of the engine used. The X-48 makes use of 3-turbo-jet engines in the scalable model and is realizable for full-scale aircraft. These can be found by building the virtually prevalent engine model using software like TURBOMATCH which would be comprising of several blocks with varying properties so as to find the details of the aircraft’s engine’s performance. This can also be found using existing aircrafts and similar engine specifications. The concept was set up was done previously for a BWB by Mcbean and with a similar aircraft configuration and overall MTOW, the engine SFC estimated earlier was around 1.47 x 10⁻⁵ kilograms/Newton-second. The total time for the aircraft’s mission can be taken by using the values of the design range for this mission upon the true-airspeed achieved at cruise and this value comes to be around 52000s. Hence, Wfo(ΔWa) would be 1711.235 Newtons (Zero-redundant) and 2142.08 Newtons (Double-redundant).
The shaft-power off-takes would be calculated based on the equation as follows:
Here, Δfp would be defining the fuel rates made use-of as a result of the off-takes within the compressor, the values c, t, g and r have been mentioned before. The equation for Δfp is given as follows:
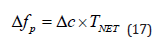
If Δc is increment of the SFC of the engine as a result of the system, the Total thrust given by T (Net) in the cruise condition, in the case of the aircraft X-48 taken here is around 68kN, the value of the increment in SFC would have to be taken either by reference or by running an engine simulation model. This can be by using a TURBOMATCH model or by means of using available data from existing models such as the one used by MCBEAN p NET Δf = Δc×T [2]. The average values taken would be close to 1.4x10⁻⁹ kilograms/ Newton-second, by taking the simulation conditions in the cruise conditions, as the shaft-off take would be around 4500 kW and such a value as taken as the net value of around 9000 kW for the entire system is to be distributed amongst the two engines and therefore, as the value is for one engine. Hence, it would be the value used for both systems irrespective of the redundancies and even though there might be greater redundancy, the consumption of power from the system is only half of total available and hence 50 percentage usage [8-15]. Therefore, the value of: =9.52 x 10⁻⁵ kg/Ns
Therefore, the value of Wfo(Δfp) = 60.232 Newtons.
If the system drag is taken into account,
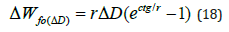
The common reasons for the drag within the system is due to the system’s induced characteristics of ram-air within the system. Such assumptions can be made taking into account the fact that the loss in momentum of the air would take place. Hence, in the case of the calculations of the HLFC system, reduction in the drag value would have to be subtracted from the ram-value of the drag to get the net drag. The ram flow drag would be the product of the flowrate of the air taken in and the true-airspeed. From the previously calculated values, the mass-flow rate is around 1.01 kilograms/ second and ram drag is hence: D(Ram) = Mass flow rate x VTAS = 1.01 x 188.65 = 190.5365 Newtons. It has already been calculated that the drag saving per wing is 2182.225 Newtons [16-21].
Thus, the net drag change would hence be:
Overall drag = DRam – 2DWing saving = 190.365 – (2 x2182.225) = -4174.085 Newtons.
Hence, Wfo(ΔD) = -38821.495 Newtons. Hence, the value calculated is the same for the zero and redundant systems. Moreover, the effect of the fuel penalties as a result of the system’s weight and the power-off takes is small as compared to the overall negative value which arises from the drag reduction.
The net fuel weight penalties (Or the fuel saving in this case), can be calculated as follows:

Hence this gives a fuel saving of 37050.028 Newtons (3776.76 kilograms) for non-redundant system and 36619.18 Newtons (3732.84 kilograms) for double-redundant. In terms of the weight of the aircraft in general, the value of WT can be estimated for both sets of architectures. The value is as follows:
Non-redundant system
WT = 3311.856 + 1711.235+ 60.232- 38821.495 = -33738.17 Newtons. Thus, there is a weight reduction of close to 3439.16 kilograms, which is significant.
Double- redundant system WT = 4145.706 + 1711.235 + 60.232- 38821.495 = -32904.32 Newtons (3354.16 kilograms). Thus, there is a weight reduction of close to 3354.16 kilograms. As expected, the redundant system is heavier, thus overall performance is lower with the same drag reduction but is much more reliable. If this seen in terms of the total Operating Empty weight of the aircraft, then the weight reduction is nearly 5 percent lowering in the total aircraft’s max empty weight (MTOW) of 68,784 kilograms, which comprises empty weight with the remaining weights of fuel and payload, etc. adding up [22-25].
2D and 3D simulations of passive suction method
The main aim is to investigate the laminar flow control method
on the 2D airfoil NACA 23112. The pores will be 3D modelled for
various case studies at different diameters and spaces to understand
the boundary layer control method. After going through the brief
overview, the next step is to experiment with Ansys Fluent on the 2D
cases with different types of pores. One way of studying the effects
is by installing porous surface on the upper surface of the wing and
the other method is the porous design which is modelled as in the
next image. Simple porous designs on upper surfaces would not be
useful and data has proven that it would be lowering the lift and
increasing drag. Hence the second method is chosen which has a
tube that allows air to flow from leading edge to trailing edge. This
investigation includes three different cases of porous design which
will be compared for results to get the most optimum outcome [16-
30].
A. Case 1: The first case has a hole diameter of 1 mm which
has spacing of 5 mm. So, the Dp = 0.1mm and the Sp =
0.5mm
B. Case 2: The second case has a hole diameter of 0.5 mm
which has spacing of 1.5 mm. So, the Dp = 0.05mm and
the Sp = 1.5mm
C. Case 3: The third case has a hole diameter of 0.5 mm
which has spacing of 1 mm. So, the Dp = 0.05mm and the
Sp = 1mm
Figure 10:CAD Model of the HLFC System with various features and water-drain method depicted.

After the geometry has been imported in design modeler of Fluent workbench, the next step is meshing. The mesh can be seen in the previous figure where the tube and the areas of the airfoil where pores and curvature exist is refined to level best. Proximity and curvature function is used in Ansys to refine the results within the tube where it bends towards the trailing edge and exit. After meshing, the geometry is taken to solver stage and the set-up is similar to base-line configuration taken in initial background aerodynamic study. The obtained results will be tabulated further in the results section. Apart from 2D simulations, 3D simulations were also carried out and for that the wing had to be modelled in CATIA to incorporate perforations. The perforation case taken was only case-2 so as to see the impact of what could be optimum for such a design. The modelled geometry was then imported to ANSYS, enclosure created and meshing carried out suitably. The geometry and the meshed wing are shown below (Figure 10).
Range and drag performance
The range performance is viewed based on the criteria of the BREGUET range equation, given as follows:
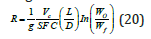
“g” defines the acceleration due to gravity and is a universal
constant, 9.81 m/s2
“Ve” is defined as the cruising velocity/speed
The “SFC” is basically the specific fuel consumption and is
dependent on the kind of engine used and is engine-specific
“L/D” is the lift over drag ratio and these parameters have
already been mentioned in detail in the previous tasks
Wo/Wf is defined as the ratio between the initial mass of
aircraft and the final mass (Ratio between take-off and landing
mass).
The cruising speed is given by:
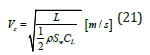
Here,
“L” is defined as the lift required (Equivalent to 17773
kilograms weight)
“p” is density of the atmosphere at cruise or 0.2329 kg/m3 for
this case
“Sw” is the wetted surface area
“CL” is the coefficient of lift
Another important study is that of the drug-performance, so as to estimate the drag savings. The fuel consumption is associated with the power needed for flight and hence it can be found as follows:
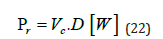
Here the power requited to counter-act the drag is defined by Pr and the drag force generated is given by “D”. With the same design cruise speed, usually it is expected that the wing with the lower value of drag-coefficient would be needing lesser power so as to counter-act the drag. Moreover, in case of 2D values can be considered and in 3D there are small variations only with twist angle at the root and hence there is not much of a difference in the drag values, thus not much change in the fuel being consumed, with the same values of drag being produced. Moreover, going on with the same consideration of the aircraft’s mass and the variation in the cruising velocity, there can be a better estimate of the fuel saving. As the cruise velocity would vary with each of the configurations and cases, the power needed would change as well.
Results
HLFC System Performance Results
Table 7:Drag reduction comparison.

There is drag reduction in the zero-lift drag. This reduction can be seen from the graph shown in the next image. This shows hence that the HLFC system can lower aircraft drag by nearly 31.2 percent as seen from the obtained data (Figure 11 & Table 7). The fuelweight penalties and the fuel-weight reduction were mentioned in the method used, but the final tabulated results are as follows (Table 8).
Figure 11:Drag comparison with and without HLFC.

Table 8:Fuel weight and system weight penalty reduction (Negative sign indicates reduction).

2D and 3D simulation results
The simulation results for 2D and 3D passive suction method were evaluated using ANSYS FLUENT CFD software, the methodology of which has been already mentioned. The results indicated that case-2 gave optimum results as opposed to other cases, even though a general conclusion is that perforations increased the L/D ratio as opposed to baseline non-perforated aircraft. Similarly, in 3D, the perforated wing had an L/D ratio of 23.175 as opposed to non-perforated configuration. The flow contours and the obtained values are as follows (Table 9) (Figure 12 & 13).
Figure 12:Velocity contour for case-2 (Image on right shows a close-up view).

Figure 13:3D Simulation of perforated wing surface.

Table 9:Comparison of aerodynamic results for three cases vs baseline wing.

Range and drag performance results
The best range is obtained in case-2 when compared to the range of baseline wing and the other cases. The range increases by nearly 1.87 times. Similarly, the drag value lowers a lot in case-2 and the drag performance is bettered as drag power is lowered to 54.4% of baseline aircraft wing (Table 10 & 11).
Table 10:Range performance in comparison to baseline

Table 11:Drag power needed in comparison to baseline wing..

Discussion and Conclusion
The initial literature review looked at various aerodynamic concepts followed by concepts of flow control and the hybrid-laminar flow control methodology and the system’s dependence with other interfaces. Moreover, the next step was introduction of the concept of computational fluid dynamics and investigating the non-porous performance of the blended wing aircraft. Thus, after 3D modeling of the aircraft in CATIA, it was then studied in Ansys for the fluent behavior. The 3D results were obtained at different AoA’s together with 3D simulation of symmetric aircraft section. The aircraft was simulated in two different conditions one at sea-level and the other at 40,000 ft altitude. Both of these altitudes were then compared for results with various angle of attacks. Moreover, after initial simulations, mesh was refined and refined mesh simulations were finally done for 2D aircraft and symmetric aircraft section. The next step was to start with design parameters for the HLFC system. The most important step before designing the HLFC system was based on looking at limitations and calculating certain system-relevant parameters. The suction power was then estimated, followed by choosing a type of turbo-compressor and then structural design and CAD modelling of the system in CATIA. The necessary kinds of hoses were selected for the system with Hyper-line FX types chosen. The performance of the system was henceforth analyzed and the main conclusions were drawn from the fact that the HLFC suction system reduced zero-lift drag by 31.2 percent and hence improved aerodynamic performance substantially. Fuel weight penalties were also calculated and hence the calculations showed that the aircraft could save close to 5% weight if it uses such an HLFC system. Thus, it can give better performance and range. The analytical results were backed-up by further results found out by CFD simulation in 2D and 3D. The simulations were carried out on passive suction systems and hence the results showed that aircraft surfaces with optimum perforations and adequate suction can lower drag, improve the L/D ratio and improve hence aircraft performance. This is backed up by flight performance calculations which show better performance on perforated wing surfaces. There are certain future improvements that can be made. One of them is better structural designing from a manufacturing viewpoint. Better spacing between stringers and much deeper structural design/CAD can be made looking at intricate aspects. Also, further work can also be done on the water-drain methods and thermal management of the system. Moreover, CFD simulation could be carried out with the turbo-compressor so as to see the actual effect of its functioning and hence detailed designing of the turbo-compressor would have to be done, but this is quite an extensive study.
Competing Interests
The authors declare that they have no competing interests
Author’s Contribution
Both MF Pathan and Dr. Amir participated in the project. MF Pathan was involved in the research and analysis work. Dr. Amir had backed the co-author at each step in the research and provided the necessary guidance. Dr Amir provided special guidance in CFD Simulations and modelling HLFC system. The final manuscript was read and approved by both the authors.
Acknowledgement
We would like to thank our fellow colleagues and researchers at Cranfield University for their co-ordination and support whenever required. Special acknowledgement to the respective family members and close friends for the motivation and drive to carry out the research.
References
- Kalarikovilagam Srinivisan G, Oliver B (2019) Preliminary design and system considerations for an active hybrid laminar flow control system. MDPI.
- Mr Alasdair MacBean DA (2015) Hybrid laminar flow control to delay a transition to turbulent flow. Cranfield University, UK.
- Sellars N (1999) A Study to indicate the number of plenum chambers required for a HLFC system on a military delta wing canard configuration.
- PDIA (1992) The aerodynamic performance of laser drilling sheets.
- Hose A (2016) Hyper-line FX, Aflex Hose, Sowerby Bridge.
- Sadraey M (2009) Aircraft performance analysis.
- NASA (1999) High reynold’s number Hybrid Laminar Flow Control (HLFC) flight experiment IV.
- Wood A (2003) Design study on the use of distributed pumping with a hybrid laminar flow control system. Cranfield.
- Cavcar M (2001) The International Standard Atmosphere (ISA).
- Wang B (2014) CFD simulation for a laminar flow wing. Cranfield University, UK.
- Joslin RD (1998) Overview of laminar flow control.
- Naranoot W (1999) A design study of long-range subsonic transport aircraft using hybrid laminar flow control on the wing.
- Sturgeon RF, Bennett JA, Etchberger FR, Ferrill RS, Meade LE (1976) Study of the application of advanced technologies to laminar flow control systems for subsonic transports, NASA CR-144975. NASA United States, USA.
- Versteeg HK, Malasekara W (2007) An introduction to computational fluid dynamics. The finite Volume method. (2nd edn), Pearson, Glasgow,
- Anderson JR, John D (1991) Fundamentals of aerodynamics. (2nd edn), Inc, McGraw- Hill, United States.
- MacBean A (2012) Design and integration of hybrid laminar flow control systems and powerplants for a flying wing civil aircraft. Cranfield University, UK.
- Joslin RD (1998) Overview of laminar flow control. NASA/ TP- 1998-208705. Virginia: NASA, USA.
- Feziger JH, Peric M (2002) Computational methods for fluid dynamics (3rd edn), Springer, Berlin, Germany.
- Shlichting H (1995) Boundary layer theory. (1st edn), Pergamon Press Ltd, Great Britain, United Kingdom.
- Kundu PK, Cohen IM (2008) Fluid mechanics. (4th edn), Elsevier, San Diego, California, USA.
- White F (2006) Viscous Fluid Flow. (3rd edn), McGraw-Hill, New York, USA.
- Popov AV, Botez RM, Labib M (2008) Transition point detection from the surface pressure distribution to controller design. Journal of Aircraft, 45(1): pp. 23-28.
- Biswas G, Eswaran V (2002) Turbulent flows, fundamentals, experiments and modelling. (1st edn), Alpha Science, New Delhi, India.
- Aldheeb M, Asrar W, Sulaeman E, Omar AA (2018) Aerodynamics of porous airfoils and wings. Acta Mechanica 229, pp. 3915-3933.
- CaiHong S (2012) The reliability of the improved e-N method for transition point prediction of the boundary layers on a flat plate. Science China 55(5): pp. 837-843.
- Bushnell DM and Tuttle MH (1979) Survey and bibliography on attainment of Laminar flow control in air using pressure gradient and suction. NASA- 1035.
- Li J (2017) CFD for a laminar flow wing at M<0.6. Cranfield University, UK.
- White F (2003) Fluid Mechanics. (5th edn), McGraw-Hill, New York, USA.
- Gudmundsson S (2014) General aviation aircraft design applied methods and procedures. (1st edn), Oxford, Elsevier,
- BAREAS LX (2018) CFD Simulation for laminar flow wing< M 0.6. Cranfield.
© 2022 Amir Zare Shahnehb. This is an open access article distributed under the terms of the Creative Commons Attribution License , which permits unrestricted use, distribution, and build upon your work non-commercially.
Editor In Chief


.jpg)


Signup for Newsletter

Quick Links
 Editorial Board Registrations
 Submit your Article
 Refer a Friend
 Advertise With Us
Our Recent Edition

.jpg)


Top Editors


.jpg)


.bmp)
.jpg)
.png)
.jpg)


.jpg)


.png)

.png)


.png)


Financial Support

Sponsors

Latest e-Books

Latest Video

 a Creative Commons Attribution 4.0 International License. Based on a work at www.crimsonpublishers.com.
Best viewed in
a Creative Commons Attribution 4.0 International License. Based on a work at www.crimsonpublishers.com.
Best viewed in