
- About Us
- Information
-

The Author ensures that the research has been conducted responsibly and ethically with adherence to all relevant regulations. read more..
- For Authors
- For Reviewer
- Manuscript Guidelines
- Membership
- Publication Ethics
-
- Journals
- Reprints
- e-Books
- Videos
- Policies
- Contact Us
 COVID-19
- Submissions


Full Text
Novel Research in Sciences
A Simulation Study on the Reflectivity Characteristics of Dual Frequency Radar for Precipitation of Different Phases
Danqing Huang, Nan Li* and Yuzhen Song
School of Atmospheric Physics, Nanjing University of Information Science & Technology, Nanjing, China
*Corresponding author: Nan Li, School of Atmospheric Physics, Nanjing University of Information Science & Technology, Nanjing, China
Submission: April 01, 2022;Published: April 14, 2022
.jpg)
Volume10 Issue5April, 2022
Abstract
In this paper, the scattering characteristics and the reflectivity factors of dual frequency radar at Ku and Ka band are simulated for precipitation in different phases states by the T-matrix method. By setting the gamma raindrop size distribution and the scattering direction of precipitation particles, the radar reflectivity of solid, liquid and mixed particles is obtained. The results show that the temperature has a almost negligible influence on ZeKu and DFR of liquid particles; the influence of the mixing ratio on ZeKu and DFR cannot be ignored for mixed particles; and the DFR with a mixed ratio of 0.2 has large difference from that with other mixing ratio values.
Keywords: Keywords: T-matrix; Phase state; Reflectivity factor; Dual frequency radar
Abbreviations: GPM: Global Precipitation Measurement; DPR: Dual-frequency Precipitation Radar;
EBCM: Extended Boundary Condition Method; DFR: Dual-Frequency Ratio
Introduction
The identification of phase states of precipitation particles by radars is important because properties of precipitation particles (size, phase, shape, number density, etc.) can change the echo intensity of the precipitation. Space-borne radar can give high-precision and quantitative observation of clouds and rain with a wide scope [1,2]. The GPM (Global Precipitation Measurement) is a new generation satellite of global precipitation observation plans proposed by the United States and Japan. For the first time, it is equipped with DPR (Dual-frequency Precipitation Radar) at Ku-band (KuPR) and Ka-band (KaPR) [3]. The scattering of precipitation particles is very complex as it varies with not only particle size, geometry and phase, but also spatial orientation and distribution. In order to describe these complex changes, there is a need to theoretically study the scattering characteristics of precipitation particles. Zhang[4] derived the scattering energy flux density function and the scattering cross section of the precipitation particles in different states of rotation axis, according to the scattering of the polarization of small spheroid precipitation particles using linearly polarized incident waves from different directions. They obtained curves of the scattering cross section changing with the states of the precipitation particles and the wavelength of the incident wave, and these curves can be used for inversion calculations of remote sensing. Xu et al[5] used both the DDA and the T-matrix methods to calculate the backscattering cross-sections of the oblate ellipsoid and the spherical cone oblate ellipsoid particles. In this paper, the reflectivity factor and Dual-Frequency Ratio DFR of precipitation are simulated using T-matrix method based on the particle model and the raindrop size distribution, and the scattering characteristics of the precipitation particles in different phases are studied.
Theory
T-matrix method
The T-matrix method is also known as the Extended Boundary Condition Method (EBCM). The T-matrix method is an accurate and powerful method for calculating the scattering of particles of any shape based on Maxwell’s equations.
The modeling of particles
Liquid particles are set as pure liquid particles, mixed particles are set as uniformly mixed particles of ice and water, and solid particles are set as uniformly mixed particles of ice and gas. The parameters of the particle model are as follows [6]:
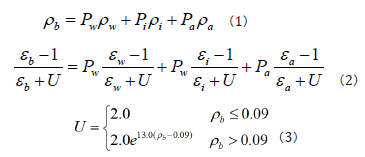
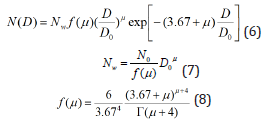
where Pw, Pi and Pa represent the volume percentage of water, ice and air in the particle, respectively. ρw, ρi and ρa represent the density of water, ice and air and they usually take fixed values of 1g/ cm3,0.92g / cm3 and 0g/cm3, respectively. εw, εi and εa represent the dielectric constants of pure water, pure ice and pure air, respectively. The dielectric constant of pure air is 1. The dielectric constants of pure water and pure ice need to be calculated. In this study, the wavelength of the Ka band is 8.45mm and the wavelength of the Ku band is 22mm. The complex refraction index and K value of pure liquid particles at different temperatures in the Ku-band and Ka-band are calculated as
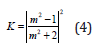
The particle temperature is set to -5, 0, 5, 10, 15 to calculate the K value. It is noted that both the complex refractive index is a constant 1.78 which is independent of the radar wavelength and the temperature of pure ice particles, and the K value is also a constant 0.176. For ice-water mixed particles, the temperature is set as 0°C and the mixing ratio (water content) is set as 0.2, 0.4, 0.6, and 0.8, respectively. The complex refractive index and K value of ice-water mixed particles at the Ku-band and the Ka-band increase as the mixing ratio increases. When the mixing ratio is constant, the complex refractive index and the K value at the Ku band are larger than those at the Ka band. With the increase of the density of 0.2, 0.4, 0.6 and 0.8, the complex refractive index and the K value of the ice-air mixture particles at the Ku- and Ka-bands almost remain unchanged. The shape of the particles also needs to be determined. As precipitation particles are affected by gravity, buoyancy and resistance in the process of falling, their shapes will change while are usually in the form of oblate ellipsoids [6]. In this study, the shape of precipitation particles is uniformly set as oblate ellipsoid. The relationship between the axis ratio and the equivalent diameter follows the results of wind tunnel test by Pruppacher [7].
Raindrop Size Distribution (DSD)
The Drop Size Distribution (DSD) of precipitation particles needs to be assumed when simulating the reflectivity factor. DSD refers to the particle number density with particle diameter in unit volume. Commonly used DSD includes the MP distribution, the gamma distribution, the power exponential distribution, etc. [8-10]. Studies have shown that the gamma distribution can fully represent the DSD characteristics of precipitation particles and it is used in this study [11]
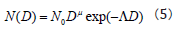
where D is the raindrop diameter, and N0, μ and Λ are intercept, shape factor and slope respectively, which determine the shape of the DSD function [12]. In this study, we use the gamma distribution model in the form of the three-parameters [13]:
where D0 is the volume median diameter, Nw is the number of precipitation particles in unit volume, μ is the spectral type parameter and Γ is the gamma function.
DFR (Dual-Frequency Ratio)
The reflectivity factors measured by KuPR and KaPR are both affected by attenuation and non-Rayleigh scattering effects. In order to describe the difference in the attenuation-corrected equivalent radar reflectivity factor Ze between the two frequencies, The Dual- Frequency Ratio (DFR) is defined as:
Simulation
The effect of temperature on the reflectivity factor of liquid particles
According to the three-parameter gamma distribution model, the value of Nw is set to 103 ~ 104, the value of D0 is set to 0.5mm~5 mm, and for liquid particles μ=3. For solid particles and mixed particles μ=0 [14] and the relationship between ZeKu and DFR at the Ku band and the Ka band is simulated by T-matrix method. For liquid particles, because the complex refractive index is affected by temperature, the effect of temperature on the reflectivity factor must be considered. Figure 1 shows the relationship between ZeKu and DFR of liquid particles for different temperatures. Figure 1a shows the relationship between ZeKu and DFR with Nw=5600 and D0 of 0.5~5mm; Figure 1b shows the relationship between ZeKu and DFR with D0=3.0mm and NW of 103~104. It can be seen from Figure 1a that, for a given Nw, DFR first decreases and then increases as ZeKu increases. A minimum value is obtained when ZeKu = 22dBZ and a negative value is obtained when ZeKu<35dBZ. For different temperatures, the maximum difference in DFR is very small, less than 0.3dBZ. It can be seen from Figure 1b that, for different temperatures, DFR almost remains unchanged with the increase of ZeKu. Therefore, the effect of temperature on ZeKu and DFR can be ignored.
Figure 1: The relationship between the ZeKu and DFR of liquid particles for different temperatures when Nw=5600 (a) and and when D0=3.0mm(b).

Figure 2: The relationship between the ZeKu and DFR of mixed particles with different mixing ratios when NW = 5600 (a) and when D0 = 3.0mm (b)

For mixed particles, because the complex refractive index is affected by the mixing ratio, the influence of the mixing ratio on the reflectivity factor must be considered. Figure 2 shows the relationship between ZeKu and DFR for different mixing ratios of mixed particles. It can be seen from Figure 2a that, for a given mixing ratio, DFR gradually increases as ZeKu increases. For different mixing ratios, DFR with a mixing ratio of 0.2 is quite different from that with other values. The influence of s D0 of mixed particles on DFR is greater than that of liquid particles. It can be seen from Figure 2b that, for a given D0, DFR gradually decreases and ZeKu gradually increases as the mixing ratio increases. For different mixing ratios, the maximum difference of DFR and ZeKu can reach 2.5dBZ and 4dBZ respectively. The influence of NW of mixed particles on ZeKu is greater than that of liquid particles. Therefore, the influence of the mixing ratio on ZeKu and DFR cannot be ignored.
The effect of density on the reflectivity factor of solid particles
For solid particles, because the complex refractive index is affected by density, the influence of density on the reflectivity factor must be considered. Figure 3 shows the relationship between ZeKu and DFR for different densities. It can be seen from Figure 3a that, for a given density, DFR gradually increases as ZeKu increases. For different densities, the DFR with a density of 0.2g/cm3 is higher than that with other densities. It can be seen from Figure 3b that the differences of DFR for different densities is very small while the difference of ZeKu is large. for a given D0 and the increase of Nw, ZeKu increases as density increases, and the maximum difference of ZeKu for different densities can reach 10dBZ. Therefore, the effect of density of solid particles on ZeKu and DFR cannot be ignored.
Figure 3: The relationship between ZeKu and DFR of solid particles for different densities when Nw = 5600 (a) and when D0 = 3.0mm (b)

Summary
In this article, models of precipitation particles with different phases were established and some parameters related to precipitation, such as temperature, mixing ratio, density and complex refractive index were given. Assuming that the particles follow the gamma distribution model of three parameters, the reflectivity factors of a randomly and uniformly oriented particles with different phases at the Ku band and the Ka band are calculated by T-matrix, and the effects of the temperature, mixing ratio, effect of density and different spectral parameters on the reflectivity factor is studied. The results show that the effect of temperature on ZeKu and DFR for liquid particles is almost negligible. The influence of the mixing ratio on ZeKu and DFR of mixed particles cannot be ignored. The DFR of particles with a mixing ratio of 0.2 is quite different from that with a mixing ratio of other values. For different mixing ratios, the maximum difference of DFR can reach 2.5dBZ, and the maximum difference of ZeKu can reach 4dBZ; The effect of density on ZeKu and DFR of solid particles cannot be ignored. The DFR with a density of 0.2g/cm3 of solid particles is higher than that with other density values. For different densities, the maximum difference of DFR is close to 1dBZ, and the maximum difference of ZeKu is up to 10dBZ.
Figure 1: Issuarnce of social bonds and stakeholder dominance.
-->
References
- Cao J, Liu L (2007) The sensitivity study for classification of precipitation particle types based on dual-linear polarimetric radar. Plateau Meteorology 26(1): 116-127.
- Liu L (2002) A Theoretical Study of estimation rain and hail rates in mixed-phase areas with dual linear polarization doppler radar. Chinese Journal of Atmospheric Sciences 26(6): 761-772.
- Liao L, Meneghini R (2011) A Study on the feasibility of dual-wavelength radar for identification of hydrometeor phases. Journal of Applied Meteorology and Climatology 50(2): 449-456.
- Zhang P, Yin X (2000) Characteristics of microwave scattering for groups of small rotating spheroid particles. Acta Meteorologica Sinica 58(2): 250-256.
- Xu X, Wang Z, Wang Q, Chao Z (2002) Assessment of DDA for computing the backscattering by oblate spheroidal particles with experimental data. Plateau Meteorology 21(1): 31-36.
- Bohren C, Battan L (1980) Radar backscattering by inhomogeneous precipitation particles. Journal of Atmospheric Sciences 37(8): 1821-1827.
- Pruppacher HR, Beard KV (1971) A wind tunnel investigation of the internal circulation and shape of water drops falling at terminal velocity in air. Quarterly Journal of the Royal Meteorological Society 96(408): 247-256.
- Haddad S, Salman M, Jha R (1983) Effects of dust/sandstorm on some aspects of microwave propagation. In ESA Wave Propagation and Remote Sensing: 153-162.
- Testud J, Oury S, Black R (2001) The concept of “Normalized” distribution to describe raindrop spectra: a tool for cloud physics and cloud remote sensing. Journal of Applied Meteorology 40(6): 1118-1140.
- Zheng J, Chen B (2007) Comparative study of exponential and gamma function fits to observed raindrop size distribution. Scientia Meteorologica Sinica 27(1): 17-25.
- Ulbrich C (1983) Natural variations in the analytical form of the raindrop size distribution. Journal of Climate and Applied Meteorology 22(10): 1764-1775.
- Chen X, Liu X (2019) Combining GPM DPR with S-B and radar to retrieve RSD. Acta Scientiarum Naturalium Universitatis Pekinensis 55(2): 227-236.
- Laroche S (2002) Polarimetric doppler weather radar: Principles and applications. Atmospheric Research 63(1-2): 159-160.
- Liao L, Meneghini R, Tokay A (2016) Retrieval of snow properties for Ku- and Ka-band dual-frequency radar. Journal of Applied Meteorology and Climatology 55(9): 1845-1858.
© 2022 Nan Li. This is an open access article distributed under the terms of the Creative Commons Attribution License , which permits unrestricted use, distribution, and build upon your work non-commercially.
Editor In Chief


.jpg)


Signup for Newsletter

Quick Links
 Editorial Board Registrations
 Submit your Article
 Refer a Friend
 Advertise With Us
Our Recent Edition

.jpg)


Top Editors


.jpg)


.bmp)
.jpg)
.png)
.jpg)


.jpg)


.png)

.png)


.png)


Financial Support

Sponsors

Latest e-Books

Latest Video

 a Creative Commons Attribution 4.0 International License. Based on a work at www.crimsonpublishers.com.
Best viewed in
a Creative Commons Attribution 4.0 International License. Based on a work at www.crimsonpublishers.com.
Best viewed in