
- About Us
- Information
-

The Author ensures that the research has been conducted responsibly and ethically with adherence to all relevant regulations. read more..
- For Authors
- For Reviewer
- Manuscript Guidelines
- Membership
- Publication Ethics
-
- Journals
- Reprints
- e-Books
- Videos
- Policies
- Contact Us
 COVID-19
- Submissions


Full Text
Novel Research in Sciences
Market Specific Projection and Adoption of a New Technology: A Case Study for Tera Spectra
Rahman A*
Applied Research & Photonics, USA
*Corresponding author: Anis Rahman, Applied Research & Photonics, 470 Friendship Road, Suite 10, Harrisburg, PA 17111, USA
Submission: March 18, 2022;Published: April 14, 2022
.jpg)
Volume10 Issue5April, 2022
Abstract
A novel and complex technology competing against established standards, even with new and critical useful capabilities, will always find itself very difficult to gain traction. However, as the history of technology-progress overwhelmingly stipulates, when bigger risks meet with success, it not only solves the outstanding problem but also brings a bigger reward for the pioneers and the investors. In this report the general aspects of a new technology adoption are discussed in terms of the diffusion model. While diffusion of knowledge among the knowledge-worker once depended only on media advertisement and word of mouth, the effect of present-day Internet changes previous norms, as discussed. In addition, the effect of very recent pandemic on a new technology is also touched. A case for a new camera-less imaging modality and spectrometer instrument, Tera spectra, has been outlined.
Keywords: Keywords: Tera spectra; Bass diffusion model; Adoptability of a new technology; Internet effect
Abbreviations: TNS3DI: Terahertz Nanoscanning Spectrometer and 3D Imager
Introduction
When a new product is introduced by a company, an estimate for its future sales, profits, and other impacts on objectives are important. The appropriate sales-forecasting model varies with the type of the new product and situations such as the degree of novelty of the product and the degree of product repurchase ability. Frequency of purchase is low for high-cost products such as a piece of capital equipment for the semiconductor industry. As such all new products must be adopted by a purchasing population who initially would not know about them. The adoption process for new products (e.g., a capital equipment) is a complex process, especially for big manufacturers who are the main users of such complex machineries. The purchasing process depends mainly on the following: (1) The diffusion of innovations: i.e., how a new idea, goods, or services, are assimilated into a social system comprised of knowledge workers such as the scientists, engineers, technicians, researchers, etc. (2) The diffusion process of knowledge is the spread of an idea or the market penetration of a new product from its source of creation to its ultimate users or adopters. (3) The new technology adoption process involves the steps an individual goes through from the time she/he learns about an innovation until final adoption (the decision to use an innovation regularly). In case of a capital equipment, multiple individuals are involved who represent the institution. In what follows, we consider a case for a new and complex capital equipment, the Tera spectra which is a terahertz nano scanning spectrometer and 3D imager (TNS3DI) from Applied Research and Photonics, Inc. The main capabilities of the TNS3DI include high resolution imaging down to lattice resolution, volume (3D) imaging, layer by layer imaging, and a high sensitivity spectrometer, all embodied in a single platform. Thus, the Tera spectra complements and/or replaces an AFM, an SEM and a TEM (except for elemental analysis) and adds a new dimension for time-domain spectroscopy, among others. The reader is encouraged to review the capabilities of this new mode of volume imaging and spectroscopy elsewhere [1-6].
As a new concept, it is not obvious to figure out what percentage of each of the above-mentioned instrument market segment could be claimed by the new Tera spectra. Therefore, a “what-if” scenario is formulated based on target usages in specific or collective areas. Given that there is significant interest in utilizing the Tera spectra’s capabilities in semiconductors, nanotechnology, and biomedical areas, it is expected to be an able competitor in the aforementioned market segments. However, the tera spectra will also compete in other markets such as analytical instruments and medical imaging. As such a more rigorous investigation should be attempted which is outside the scope of this report.
What-If Model Forecast
Figure 1: Timeline of adaptation of a new technology by various groups of users.

Based on the foregoing, one can formulate a forecast of the “adopters” of a new technology such as the Tera spectra by different groups of end users. Social scientists have studied the adoption of new ideas by many of such end-user groups. For example, they have studied how a group of doctors adopt a new treatment technique, or how the farmers accept a new farming idea, and other examples of the process of groups of people absorbing innovation. Most of these studies show a common trend in adoption of new ideas. They are accepted first by the innovators, who seldom make up more than 2-3 percent of the larger group. The timeline of adaptation by different groups is depicted in Figure 1. The main groups are the innovators, the early adopters, the early majority, the late majority, the late adopters, and the laggards (Figure 1).
Diffusion Model
The Bass diffusion model was developed by Frank Bass [7] and describes the process of how new products get adopted as an interaction between the current users and other potential users. It has been described as one of the most famous empirical generalizations in marketing. A diffusion model produces a life-cycle sales curve based on a small number of parameters. The parameters may be estimated by analogy to the histories of similar new products introduced in the past and by early sales returns as the new product enters the market. Bass model is designed to answer the question: “How many customers will eventually adopt the new product and when?” This is indeed a crucial question to answer before launching a new product that requires a lot of investment during the development phase, before any profit can be realized. More important, investors must know in advance that if their investment will result into something good for people. It is appropriate for forecasting the first purchase of a new product for which no closely competing alternatives exist in the marketplace. Managers need such forecasts for new technologies or major product innovations before investing significant resources in them. The Bass model offers a good starting point for forecasting the long-term sales pattern of new technologies and new durable products under two types of conditions. (1) The firm has recently introduced the product or technology and has observed its sales for a few time periods; or (2) The firm has not yet introduced the product or technology, but it is similar in some way to existing products or technologies whose sales history is known.
Assumptions of the Bass Diffusion Model
i. The Bass model of 1969 make the following assumptions
(implicit and explicit):
ii. Adoption process is binary (consumer either adopts, or
waits to adopt)
iii. Constant maximum potential number of buyers (m)
iv. Eventually, all m will buy the product
v. No repeat purchase, or replacement purchase
vi. The impact of the word-of-mouth is independent of adoption
time
vii. Knowledge diffusion is considered independent of substitutes
viii. The marketing strategies supporting the innovation are
not explicitly included
As such the basic Bass model leaves out the effects of Influence of mass-media communication and the recent Internet. Consequently, a modified model is presented below following the description of the basic Bass model.
According to this model [7], sales S(t), is the rate of change of installed base (i.e., adoption) f(t), multiplied by the ultimate market potential m:
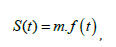
or
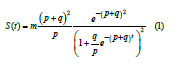
Figure 2: Increase of knowledge worker population among which new technology knowledge will diffuse.

The coefficient p is called the coefficient of innovation, external influence, or advertising effect. The coefficient q is called the coefficient of imitation, internal influence, or word-of-mouth effect. The average value of p has been found to be 0.02 and is often less than 0.01. The average value of q has been found to be 0.38, with a typical range between 0.3 and 0.5. While the market potential m is a parameter determined for each market space, it is worth noting that this factor is also time dependent (a slight deviation on our part from Bass’s original hypothesis). In effect, the ultimate market potential, m is the factor that depends on a population of knowledge worker among which an early adopter may be found. Diffusion theory assumes that the knowledge of a new technology will “diffuse” among this population as a function of time as depicted in Figure 2. Given that there are thousands of government labs and establishments who will be interested in the robust capabilities of Tera spectra, the population represented in Figure 2 is a conservative estimate of the knowledge workers. Notable that, similar population exists in other market segments where Tera spectra will be a contender. Utilizing the foregoing, it is possible to estimate the sales, S(t), given by Eq. (1). Figure 3 shows a chart of annual estimates of adopters that are likely to adopt the new technology. Bass found that his model fit the data for almost all product introductions, despite a wide range of managerial decision variable, e.g., pricing and advertising. This means that decision variable can shift the Bass curve in time, but that the shape of the curve is always similar. Total sales Dollars are simply a multiplicative factor of the adopters and unit price. Figure 3 is a straightforward representation of the diffusion model. There are a few factors that must also be considered. Eq. (1) does not consider the fact that some adopters may want to procure multiple units for a single facility. Also, technology products succeed one another in generations. Norton and Bass extended the model in 1987 for sales of products with continuous repeat purchasing. The formulation for three generations is as follows:
Figure 3: A fraction of the knowledge worker (Fig. 2) will be the adopters of the new technology.

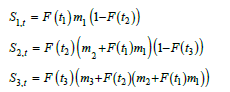
Where
mi = aiMi,
Mi is the incremental number of ultimate adopters of the ith generation
product, ai is the average (continuous) repeat buying rate
among adopters of the ith generation product, ti is the time since the
introduction of the ith generation product, and
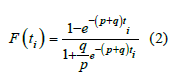
Figure 4: Re-rendering of Eq. (1) for three different market segments. Although it is unlikely that all market segments can be addressed in the initial years, however, year 3 and onward the potential can be realized with proper investment and management.

One would be able to evaluate Eq. (2) as more data become available in the future. For the present, it is important to recall that Eq. 1 can be extended for other market segments with varying knowledge worker population. The net effect may be expressed by means of a weighted sum of Eq. (1) for all market segments. This “what-if” will result into Figure 4 that shows overall market potential of Tera spectra. Although it is unlikely that all market segments can be addressed in the initial years, however, year 3 and onward the potential can be realized with proper investment and management.
The Internet Effect
Often the concluding section is named: “discussion and
conclusion”, rather than the “discussion” being attached to the
“results” section. In either case, this section includes the restating
of the objectives of the current study in relation to the background
of the field. Just as in the introduction, one reminds the reader of the
weaknesses in previous research and how this present study “fills
the gap”, in the context of the methods employed to see if indeed
new knowledge or an expansion of knowledge may be garnered.
Then one summarizes the results. Now one is able to evaluate what
one can learn from this, indicating the future necessary direction of
research; what is yet to be determined or made known and perhaps
suggesting conceivable ways to solve such problems.
This reader should now get a sense of the significance of the
research paper and its overall contribution, inspiring him/her to
attach importance to the findings and at best, a kind of revelation
at what has now been discovered, approaching certainty in
the validity and truth of the results or findings. The abstract
should consolidate all the sections in a seamless paragraph that
summarizes accurately the purpose, procedure and results of the
study within the designated area of research, further simplified
with the use of 4-7 keywords. This in essence describes a scientific
research paper, both in structure and method.
Figure 5: Growth of the Internet from 1995 till March 2021. The growth data fit well with a 3rd order polynomial shown [8].

Figure 6:(a) Market potential and (b) Adaptability as influenced by the Internet based knowledge propagation.

The adaptability of a new technology is immensely enhanced by a global awareness propagated by the Internet. The increasing trend of the Internet proliferation is shown in Figure 5, where the trend is fitted by a 3rd order polynomial. However, the number of actual adapters will still depend on other factors as usual. Especially, for an expensive piece of capital equipment, the market penetration will remain very slow despite the knowledge propagation via the Internet. Nonetheless, the advent of the Internet is immediately realized for the diffusion of product specific knowledge among the knowledge workers. To incorporate the effect of the Internet for the diffusion of knowledge among the knowledge workers, we assumed a trend for m′ (t) represented by the same polynomial as the growth of the Internet (Figure 5). In order to scale down the Internet users to a reasonable population of the pertinent knowledge workers, a damping factor of 0.1 was assumed. This scaled trend, m′ (t) , is shown in Figure 6(a). Utilizing this new m′ (t) , the number of the new adopters (Users) was recomputed, as shown in Figure 6(b).
The Pandemic Effects
At this time of worldwide corona virus crisis, the above model must be reevaluated for the effects of potential worldwide pandemic. During the current coronavirus crisis of 2020-2021, people had to adapt social distancing that caused the shutdown of the economy except for the essential services like the hospitals, grocery stores, laboratories, pharmaceutical companies, etc. However, the semiconductor industry is actually facing much pressure because of the increased demands for chips. Hence the semiconductor fabs are very active, and because of their cleanroom environment where the workers are always required to be wearing the cleanroom suits with facial musk and headcover, there will be a higher demand of instrument like the Tera spectra described herein. This is because the Tera spectra will help combining the semiconductor metrology functionalities for both process development and post-process testing, as well as for failure analysis [8,9].
Conclusion
In conclusion, a novel and complex technology competing against established standards will always find itself very difficult to gain traction. However, this bigger risk will also bring a bigger reward for the pioneers and the investors. The modified Bass model discussed herein indicates that the Internet plays a big role in spreading the benefit of a new technology among the knowledge- workers, which in turn may increase the adoptability. In fact, this the most important factor of the model. The real adoptability will depend on other factors such as the affordability, alleviation capacity of the pain points of the potential adopters, degree of complexity for the end users and their training, user friendliness and availability. Therefore, further modifications of the original Bass model are in order and will be dependent on the nature of the durables.
References
- Rahman A (2011) Dendrimer based terahertz time-domain spectroscopy and applications in molecular characterization. Journal of Molecular Structure 1006(1-3): 59-65.
- Rahman A, Tomalia DA (2018) Terahertz-based nanometrology: Multispectral imaging of nanoparticles and nanoclusters in suspensions. J Nanopart Res 20(297): 1-8.
- Rahman A, Rahman AK (2019) Nanoscale metrology of line patterns on semiconductor by continuous wave terahertz multispectral reconstructive 3D imaging overcoming the abbe diffraction limit. IEEE Transactions on Semiconductor Manufacturing 32(1): 7-13.
- Rahman A, Rahman AK, Ghann W, Kang H, Uddin J (2018) Terahertz multispectral imaging for the analysis of gold nanoparticles’ size and the number of unit cells in comparison with other techniques. Int J Biosen Bioelectron 4(3): 169-174.
- Rahman A, Rahman AK, Yamamoto T, Kitagawa H (2016) Terahertz sub-nanometer sub-surface imaging of 2D materials. Journal of Biosensors & Bioelectronics 7(3): 1-8.
- Rahman A (2020) Spectroscopic terahertz imaging probes the inner structures of 0D-3D nanomaterials. Laser Focus World 56(4): 23-28.
- Frank MB (1969) A new product growth model for consumer durables. Management Science 15(5): 215-227.
- Bass diffusion model.
- Internet growth statistics. Internet World Stats.
© 2022 Rahman A. This is an open access article distributed under the terms of the Creative Commons Attribution License , which permits unrestricted use, distribution, and build upon your work non-commercially.
Editor In Chief


.jpg)


Signup for Newsletter

Quick Links
 Editorial Board Registrations
 Submit your Article
 Refer a Friend
 Advertise With Us
Our Recent Edition

.jpg)


Top Editors


.jpg)


.bmp)
.jpg)
.png)
.jpg)


.jpg)


.png)

.png)


.png)


Financial Support

Sponsors

Latest e-Books

Latest Video

 a Creative Commons Attribution 4.0 International License. Based on a work at www.crimsonpublishers.com.
Best viewed in
a Creative Commons Attribution 4.0 International License. Based on a work at www.crimsonpublishers.com.
Best viewed in