- Submissions

Full Text
Novel Research in Sciences
Simulation of Flowfields for Polymer Electrolyte Membrane Electrolyzers
Hickmann T* and Venkatesan P
Eisenhuth GmbH und Co. KG, Germany
*Corresponding author: Hickmann Thorsten, Eisenhuth GmbH und Co. KG, Friedrich-Ebert-Str. 203, D-37520 Osterode, Germany
Submission: January 17, 2022;Published: January 21, 2022
.jpg)
Volume10 Issue3January, 2022
Abstract
Keywords: Simulation; Polymer electrolyte; Renewable energies; Planet; Fossil fuels; Photovoltaic
Abbreviations: PEMEL: Polymer Electrolyte Membrane Water Electrolysis
Introduction: Hydrogen Production-The New Mega-Topic
An almost abrupt change in attitude towards applications in the field of renewable energies has emerged in recent months, both among decision-makers in politics and in companies [1]. It has been recognised both on the part of the European Union and on the part of national governments [2] that a meaningful future for our planet is only available if we consistently follow the path of getting off fossil fuels [3]. It is clear that this will be a very long and arduous path and that setbacks are to be expected. In particular, the topic of hydrogen production by electrolysis plays an eminently important role. In water electrolysis, water is split into its constituent parts hydrogen and oxygen using electrical energy. The resulting hydrogen is of interest to future energy systems for a number of reasons, including the fact that hydrogen can serve as a storage medium for electrical energy from renewable energy conversion systems such as photovoltaic or wind turbines [4]. Polymer Electrolyte Membrane Water Electrolysis (PEMEL) is considered particularly suitable for this type of application. In PEMEL, the water to be split is fed via so-called porous transport layers to the catalyst layer where the water splitting takes place. These porous transport layers must ensure the outward transport of the water, the outward transport of the produced gas, and the electrical contacting of the electrode [4]. However, a good Porous transport layer needs a good flowfield. For a good reason of performance it iss necessary to have a closer look at the flowfields. This is done by simulation.
Research Activities and the Simulation Approach
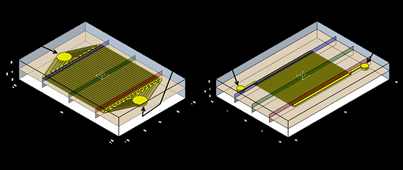
Since 2015, different research institutions in Germany work together with Eisenhuth on the idea of a better performance of PEM-EL. In this context the simulation work has been developed. The starting point is here the flowfield by looking at the velocity and the presure velocity. The velocity and pressure contour of all the eight designs are displayed from (Figures 1-4). These contours are applied on the XY plane located at a distance of 0.6mm from the origin of z axis. The origin is located at the center point of all the designs as shown in (Figure 5). From the pressure contours we can easily interpret that all the circular configurations have the pressure drop along the flow direction from inlet to outlet as almost parallel in all the flow fields while in the rectangular configuration, the pressure drop variation is almost diagonal along the flow through the flow fields. This shows that the pressure variation is directly dependent on the location of the inlet and outlet manifold irrespective of the flow field designs. This pressure distribution represents only the relative pressure and the change in the dimensions of the distribution channels and flow area near the inlet and outlet causes higher pressure drop. But this is not the case with the velocity because a proper conclusion cannot be achieved from the velocity contours. To better understand the velocity flow, instead of velocity contours, velocity profiles on each flow fields will provide a superior view on how the flow occurs on each design configurations. To do so, the XY plane has been intersected with XZ plane at three different locations on each configuration namely near the flow field inlet and outlet which is at a distance of -32mm and 32 mm respectively for circular configuration and at a distance of -24mm and 24mm respectively for rectangular configuration from the origin of Y-axis and at the Y-axis origin. The XY plane is represented in brown. The red, green and blue XZ planes represent the inlet, middle and outlet portions of the flow fields respectively. The intersection points of the XY and XZ plane provides the values for the velocity profile. For better implementation of the boundary conditions on the walls of the flow fields, hybrid option was chosen as opposed to default conservative option as the latter does not provide the proper required values for the creation of velocity profile on the chart in CFX post.
Figure 1: Pressure contour for circular configuration with different flow field designs - 1) Parallel, 2) Serpentine, 3) oken serpentine, 4) Pin-flow.
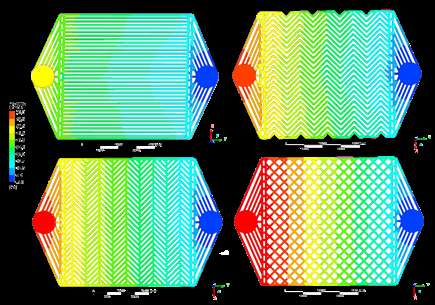
Figure 2: Velocity contour for circular configuration with different flow field designs 1)Parallel, 2) Serpentine, 3) Broken serpentine, 4) Pin-flow.
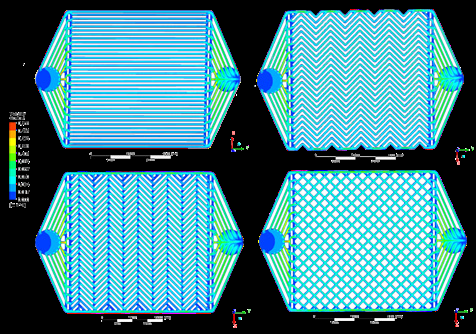
Figure 3: Presure contour for rectagular configuration with different flow field designs 1)Parallel, 2) Serpentine, 3) Broken serpentine, 4) Pin-flow.
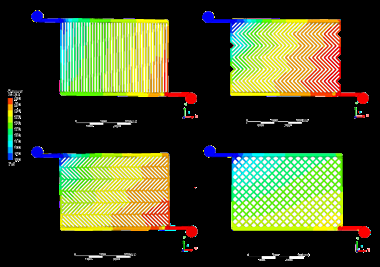
Figure 4: Velocity contour for rectagular configuration with different flow field designs 1)Parallel, 2) Serpentine, 3) Broken serpentine, 4) Pin-flow.
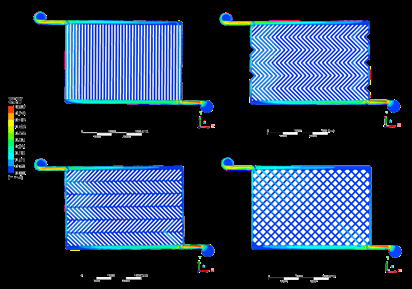
Figure 5: Distribution of planes for attaining the velocity profle of water.
Summary
The existing investigations already show that the flowfield arrangements have a significant influence on the distribution of the media. A good distribution in the system also means good performance, because the media are then almost evenly distributed in the flowfield at all times. Based on the available results, it appears that the pin flowfield performs well in terms of pressure and speed. Further investigations will now also take into account aspects such as the channel cross-sections and the temperature.
Acknowledgement
The authors would like to thank the State of Lower Saxony. The expenses incurred here were incurred as part of the „Titanium- Porous-Hybrid“ project. The project is funded by the state of Lower Saxony via the N-Bank under the funding code ZW 3 85116052, for which the project partners would like to express their thanks.
References
- (2019) Communication from the Commission to the European Parliament, the European Council, the Council, the European Economic and Social Committee and the Committee of the Regions. The European Green Deal, Brussels.
- (2018) Federal Government of Germany, (7th edn), Energy Research Program of the Federal Government, Berlin.
- Myles McCormick (2021) Urgency Over Net Zero Sparks Climate Tech Investment Boom. Financial Times, USA.
- Höh M (2017) Porous Transport Layers for Polymer Electrolyte Membrane Water Electrolysis. Germany, p. 3.
© 2022 Hickmann Thorsten. This is an open access article distributed under the terms of the Creative Commons Attribution License , which permits unrestricted use, distribution, and build upon your work non-commercially.
 a Creative Commons Attribution 4.0 International License. Based on a work at www.crimsonpublishers.com.
Best viewed in


.jpg)


 Editorial Board Registrations
 Submit your Article
 Refer a Friend
 Advertise With Us
.jpg)


.jpg)


.bmp)
.jpg)
.png)
.jpg)


.jpg)


.png)

.png)


.png)


