
- About Us
- Information
-

The Author ensures that the research has been conducted responsibly and ethically with adherence to all relevant regulations. read more..
- For Authors
- For Reviewer
- Manuscript Guidelines
- Membership
- Publication Ethics
-
- Journals
- Reprints
- e-Books
- Videos
- Policies
- Contact Us
 COVID-19
- Submissions


Full Text
Novel Research in Sciences
Entropy Dynamics of S-Curves
Korablev GА*
Doctor of Science in Chemistry, Professor of Physics Department at Izhevsk State Agricultural Academy, Russia
*Corresponding author: Korablev GА, Doctor of Science in Chemistry, Professor of Physics Department at Izhevsk State Agricultural Academy, Udmurt Republic, Izhevsk, Russia
Submission: July 12, 2021;Published: August 03, 2021
.jpg)
Volume8 Issue5August, 2021
Abstract
The graphs of S-curves characterize the general dynamics of change of entropic components depending on the process main parameters. At the same time, their sum is equal to the maximum value of each of them in this interaction. The condition of the system stationary state is the equality or constant of the correlation between its entropy and negentropy (equilibrium dynamics). Such regularities are found in many phenomena and conformational interactions in physical chemistry, nature, engineering and even economy. The examples of their functional contribution are given. The possibility of objective analysis of the coronavirus regional scenario is demonstrated based on the Russian data.
Keywords:S-curves; Their diversity; Entropy; Negentropy; System stabilization; Physical and chemical regularities; Coronavirus scenario
Introduction
Figure 1: Dependence of steel specific strength on time.

In the last century some general regularities in the development of some biological systems depending on time (growth in the number of bacteria colonies, population of insects, weight of the developing fetus, etc.) were already found [1]. The curves reflecting this growth were similar, first of all, by the fact that three successive stages could be rather vividly emphasized on each of them: slow increase, fast burst-type growth and stabilization (sometimes decrease) of number (or another characteristic). Later it was demonstrated that various engineering systems go through similar stages during their development. The curves drawn up in coordinate system where the numerical values of one of the most important operational characteristics (for example, aircraft speed, electric generator power, etc.) were indicated along the vertical and the “age” of the engineering system or costs of its development along the horizontal, were called S-curves (by the curve appearance), or they are sometimes also called “lifelines”, and as applicable to engineering systems-curves of engineering system development. As an example, the graph of the changes in steel specific strength with time is demonstrated [1] (Figure 1). “It is considered that the law of S-curves does not reflect the essence of changes in the systems, it just demonstrates their result expressed in the changes of main indexes. But in reality it, without getting into technical details, allows seeing the process regularities and future tendencies in time and drawing the corresponding conclusions. S-curve is an indicator, which describes the system state and contributes to timely making decisions on finding new trends of its development. It allows shortening the technological gap, and, in case of lacking solutions, stimulating their search” [2]. Thus, S-curves are the nomograms of changes in the process main parameters. And, therefore, they are widely applied, for example, Lorentz curve. In Lorentz curve [3] the space-time graphic dependence of the velocity parameter (Ɵ) on the velocity itself (β) is given (Figure 2).
Figure 2:Nomogram of structural interaction degree dependence (ρ) on coefficient 1/α (negentropic curve).

Similar examples of such nomograms in biophysics:
a. Surface-diffusive processes during nanostructure carbonization.
b. In kinetics of fermentative processes.
c. Dependence of biophysical criteria on their frequency characteristics.
d. Fluctuations of bio-membranes conductivity depending on their frequency.
e. Dependence of the electron transport rate on the diffusion time of ions.
As it is known, the notion of entropy can be the criterion of directedness of thermodynamic processes. Therefore, to explain the unique properties of S-curves this property is used in this investigation from the position of changes of entropy and negentropy. In addition to such terms, often, especially in mathematical statistics, the following are used: “entropy production”, as a derivative of entropy with respect to time, and “information”, as a derivative of negentropy with respect to time.
Initial data
After analyzing the first law of thermodynamics, we have the following [4]:
a. In the systems in which the interaction proceeds along the potential gradient (positive work), the resultant potential energy, as well as the reduced mass are found based on the principle of adding reciprocals of corresponding values of subsystems. This is the corpuscular process, in which entropy can serve as the theoretical concept.
b. In the systems in which the interactions proceed against the potential gradient (negative work) the algebraic addition of their masses, as well as the corresponding energies of subsystems is performed. This is the wave process, in which negentropy can serve as the theoretical concept.
c. The resonance stationary state of the systems is fulfilled under the condition of equality of degrees of their corpuscular and wave interactions. The entropy products in stationary state are completely compensated by the negentropy flow.
Coulomb interactions and their varieties are widely applied in classical physics and quantum mechanics to evaluate the structural interactions in simple and complex systems. Thus in [5] Vander Waals, orientation and charge-dipole interactions are referred to electron-conformation interactions in biosystems. And as a particular case-exchange-resonance transfer of energy. But biological and many cluster systems are electroneutral in structural basis. And non-Coulomb equilibrium-exchange energy interactions, i.e. non-charge electrostatic processes, are mainly important for them. The structural interactions of summed electron densities of valence orbitals of the corresponding conformation centers take place-processes of equilibrium flow of electron densities due to overlapping of their wave functions. The closer are the values of their energy characteristics, the easier is the equalizing of electron densities. Heisenberg and Dirac [6] proposed the exchange Hamiltonian derived in the assumption on direct overlapping of wave functions of interacting centers:
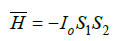
where: H –spin operator of isotropic exchange interaction for the pair of atoms; Io –exchange constant; S1 and S2 -overlapping integrals of wave functions. Such equilibrium-exchange conformation interactions regulate the stabilization of many organic systems (clusters, polypeptide chains, etc.). Therefore, in such approach the overlapping integrals of wave functions are modeled through the value of relative difference of energy parameters of interacting centers-coefficient α [7,8]. Applying the reliable experimental data we obtain the nomogram of structural interaction degree dependence (ρ ) on coefficient α, the same for a wide range of structures (Figure 3). This type of nomogram, as well as its dissymmetric variant (Figure 2) give the possibility to evaluate the degree and direction of the structural interactions of phase formation, isomorphism and solubility processes in multiple systems, including molecular ones [7,8]. The less is α, the higher is the interaction wave component degree according to (Figure 2) (negentropic curve-scale number 1). The scale number 2 evaluates the degree of reduction of the corpuscular component. And in (Figure 3) the increase of α characterizes the increase in corpuscular and electrostatic properties in microsystems (entropic curve - scale number 2). The decrease in wave properties is determined by the scale number 1. Thus, the notion of entropy is numerically modeled via coefficient α and negentropy–via 1/α.
Figure 3: Nomogram of structural interaction degree dependence (ρ) on coefficient α (entropy curve).

Conditions of Equilibrium and Correlations of Entropic Parameters
The execution of par. 3 of initial data is classified depending
on the peculiarities of process dynamics. Thus, in electromagnetic
wave the difference in the path of vector components is 90°. In
general case, during the rotational motion of the system of two
similar vectors  with the phase difference of 90° their resultant:
 where for the given angle tg45°=1 (1)
If such process is complemented by the movement along the
spiral dynamics, the vector
where for the given angle tg45°=1 (1)
If such process is complemented by the movement along the
spiral dynamics, the vector  becomes the tangent vector and
forms the spiral rotation angle, for which:
becomes the tangent vector and
forms the spiral rotation angle, for which:
 where geodesic angle φ equals 54.733° (2)
At this angle a silkworm winds the silk thread onto a base. Thus,
during purely rotational motion the condition of equilibrium of
vector components of entropic characteristics is fulfilled, and during
the spiral one the ratio equals  . During the translational motion
the conditions of either equilibrium or constant ratio of values
of their components are fulfilled. At the same time, exponential
dependencies are revealed in statistic processes. Such approach
determines general principles of many physical regularities.
. During the translational motion
the conditions of either equilibrium or constant ratio of values
of their components are fulfilled. At the same time, exponential
dependencies are revealed in statistic processes. Such approach
determines general principles of many physical regularities.
1) Characteristic of spin-orbital interaction-fine structure
constant  , where r-electron classical radius, λ-its Compton
wavelength.
, where r-electron classical radius, λ-its Compton
wavelength.
2) π equals the ratio of circumference length (l) to its diameter (2r).
3) In [9,10] the concepts of breaking point during the extension of thread plastics by its winding pitch are used: σα -axial, σβ -circumferential stresses, which are replaced by value Nα-axial “strain” proportional to them and Nβ -circumferential “strain” by the following equation:
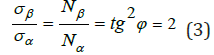
“This condition allows obtaining the stress-ration system of threads with the minimum weight of the item” [10]. In harmonic oscillations of the body the potential energy ratio conditioned by quasi-elastic force to kinetic energy equals tg2δ, i.e.
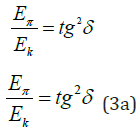
where δ -Angular characteristic of oscillations.
The sum of both types of energies is equal to the maximum value of each of them.
If δ =ϕ , the system gets the entropic equilibrium state.
4) In quantum mechanics the ratio of magnetic moment of the particle to its mechanical moment is called the gyromagnetic ratio –g. Here gs=2, if the electron magnetic moment is conditioned only by the spine component and g=1, if it is formed by the orbital motion of electrons. Such g values and their ratios characterize the corresponding entropic dependencies.
5) Planck’s equation (quantum transition):  where Е
-orbital energy, constant in stationary state, the process proceeds
along the field gradient (entropy), v -electromagnetic wave
frequency (negentropy), h- Planck’s constant.
where Е
-orbital energy, constant in stationary state, the process proceeds
along the field gradient (entropy), v -electromagnetic wave
frequency (negentropy), h- Planck’s constant.
6) Movement rate equation  where S–way during the
mechanical motion with energy consumption (negentropy), t-time,
always increases and is directed along the gradient (entropy).
Lorentz curve (Figure 4) also indicates the availability of spacetime
dependence. In these cases, the constant motion rate is the
condition of stationary state, which is found both in the microcosm
of atoms and molecules and in the macrocosm during the movement
of planets.
where S–way during the
mechanical motion with energy consumption (negentropy), t-time,
always increases and is directed along the gradient (entropy).
Lorentz curve (Figure 4) also indicates the availability of spacetime
dependence. In these cases, the constant motion rate is the
condition of stationary state, which is found both in the microcosm
of atoms and molecules and in the macrocosm during the movement
of planets.
Figure 4: Connection between the velocity parameter and velocity itself .

7) Microstructural interactions [11]: The following equation is obtained by ρ and α values in the equilibrium state based on the initial nomogram (Figure 3):
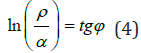
Where ϕ -geodesic angle, α relative difference of energy parameters of interacting systems, ρ –structural interaction degree.
8) During the rotational motion of the charged particle in gravitation field [11]:
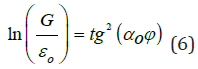
Where εo -electric constant, G-gravitational constant, αo = 1.00233 –quantum correction to electron gyromagnetic ratio in an atom, which may, in this case, characterize the influence of particles motion precession.
9) From the thermodynamic definition of entropy it follows:
 where dw is thermal energy, therefore the average
temperature (T) is a constant value, both in biological systems and
for planets.
where dw is thermal energy, therefore the average
temperature (T) is a constant value, both in biological systems and
for planets.
10) In chemical kinetics Le Chatelier principle is fulfilled: “At the external action upon the equilibrium system, the equilibrium will shift in the direction of the process, which resists this action”.
11) The initial conditions are in accordance with N. Bohr’s principle of complementarity: for a complete description of quantum-mechanical phenomena, it is necessary to use two mutually exclusive (additional) sets of classical concepts, the combination of which provides comprehensive information about these phenomena as integral. For example, describing an object as particles and as waves.
In such examples:
a. If the processes proceed along the gradient (entropy), the parameters are as follows: t, α , E, ασ , r, 0 ε , EΠ ; If the processes proceed against the gradient (negentropy), the parameters are as follows: S, ρ , ν, σβ , λ , μ, G, k E , l.
S-curves in Economy
Figure 5: Graph of demand and supply

S-curves are often used in economic investigations, for instance, GDP dynamics, amount and volume of products, forecast of innovation potential, etc. Thus, the graphs of demand line (entropy analogy) and supply line (negentropy analogy) are used to evaluate the rational market price (Figure 5) [12]. From the graph it is seen that the rational market price is fixed if the demand and supply lines are in equilibrium. The diagram of GDP world dynamics is demonstrative, which almost corresponds to the negentropy graph (Figure 6) [13]. The main decrease in GDP growth has started since 2018 and it becomes very significant during the coronavirus pandemic. At the same time, GDP of China has been constantly increasing, though with delay, even in 2020. In order to avoid GDP stagnation, some negentropic economies should probably get some addition of entropic component. The Chinese experience and coronavirus busting experience already exist in the world. Thus, the countries with rather small percentage of state companies took in the situation faster and are better managing this problem.
Figure 6: Graph of world GDP.

S-curves and COVID-19
Similar dynamics can be also demonstrated in virus etiology, which can be interpreted as smooth transition from atomicmolecular interactions on the microlevel to formally similar process in macrosystems. This analogy is confirmed by quantitative calculations for the coronavirus scenario. Let us consider this on the example of the Russian coronavirus scenario for the number of diseases in the given time period (ρ ) in (Figure 7) [14]. Such graphs demonstrate the interaction of the process entropic components: the negentropic curve gradually transforms into the entropic one. In the initial nomograms there is a point, which splits each graph into two symmetrical parts at ρ =50%. The data detalization near this value Figure 7 provides other values close to it. Thus, for the first wave this situation corresponds to the dates from 21.04.2020 to 25.04.2020 and provides the average value ρ = 5493 . This means that at ρ = 100% there must be the plateau with the numerical value two times greater, i.e. 10987. Actually, within 13 days -from 03.05.2020 to 15.05.2020 -the average value of ρ equalled 10661 [15]. For the second wave of the pandemic, the point of symmetric change of such graph equals approximately the half of its maximum value. If we make the correlation between the pandemic time in Figure 7 and coefficint ɑ in the initial nomogram (Figure 3), we can evaluate the duration of the graph top plateu. Such calculation correlates with actual results [15]. The application of this technique in other regions and countries would allow analyzing and forecasting some important stages of coronavirus scenario. But in these cases it is necessary to preliminary evaluate the regional correlation coefficient.
Figure 7: Number of diseases in the given time period.

Conclusion
This approach is not conceptually new and the given examples are not singular. Thus, thousands of years ago it was found: “All phenomena of the world around us, including a human and nature, are interpreted by Chinese medicine as the interaction between two origins “Yin” and “Yang” representing opposite aspects of unified reality” [16]. From the point of these notions, physiotherapy and reflex therapy can be considered as the technique for equalizing the potentials of two manifestations of energy origins, which, according to modern concepts, are entropy and negentropy (par. 3 of the initial data). In this pandemic situation the collective immunity acts against the virus and even cold winter contributes to forced self-isolation. In 20 century, the century of wars, epidemics and revolutions, there were huge human losses. But the coefficient of population growth was the highest during the whole humanity history. In postwar period in Russia the birth rate of boys was much higher than before the 2nd World War. At present, in the time of ecological problems, there is an important principle: all carbon dioxide produced must be absorbed. All these are the phenomena of parity correlation between entropy and negentropy.
Concluding Observations
a. The graphs of S-curves characterize the general dynamics of change of entropic components depending on the process main parameters. Moreover, their sum is equal to the maximum value of each of them in this interaction.
b. The condition of the system stationary state is the equality or constant of the correlation between its entropy and negentropy (equilibrium dynamics).
c. Such regularities are found in many phenomena and conformational interactions in physical chemistry, nature, engineering and even economy. The examples of their functional contribution are given.
The possibility of objective analysis of the coronavirus regional scenario is demonstrated based on the Russian data.
References
- Kynin АТ, Lenyashin VA (2008) Estimation of parameters of technical systems using growth curves.
- http://www.electrosad.ru/Jornal/SCur.html
- Taylor E, Wheeler J (1987) Spacetime physics. pp. 1-320.
- Korablev GА (2019) On problematic issues of physical chemistry. JMEST 6(6): 10320-10324.
- Rubin AB (1987) Biophysics, Theoretical biophysics. Vysshaya shkola M, pp. 1-319.
- Dirac PA (1935) Quantum mechanics. UK.
- Korablev GA, Petrova NG, Osipov AK, Zaikov GE (2013) Diversified demonstration of entropy. New Book Announcement. Nanotechnologies to Nanoindustry, USA, pp. 120-130.
- Korablev GA, Zaikov GE (2012) Bio-structural energy criteria of functional states. News of HEIs. Applied chemistry and bio-engineering 1(2): 118-124.
- Pidgainy Yu M, Morozova VM, Dudko VA (1967) Mechanics of polymers. 6: 1096-1104.
- Kodolov VI (1992) Polymeric compositions and technology of producing aircraft engines from them. Russia, pp. 1-200.
- Korablev GA (2020) On the mechanism of gravitation processes. JMEST 6(9): 10591-10594.
- https://businessideas.com.ua
- https://wiki2.org/ru/Gross domestic product
- https://en.wikipedia.org/wiki/COVID-19_pandemic_in_Russia
- Korablev GA (2020) Virus entropic characteristics. JMEST Journal 7(6): 12084-12088.
- Traditional Chinese medicine. Wikipedia.
© 2021 Hasan N. This is an open access article distributed under the terms of the Creative Commons Attribution License , which permits unrestricted use, distribution, and build upon your work non-commercially.
Editor In Chief


.jpg)


Signup for Newsletter

Quick Links
 Editorial Board Registrations
 Submit your Article
 Refer a Friend
 Advertise With Us
Our Recent Edition

.jpg)


Top Editors


.jpg)


.bmp)
.jpg)
.png)
.jpg)


.jpg)


.png)

.png)


.png)


Financial Support

Sponsors

Latest e-Books

Latest Video

 a Creative Commons Attribution 4.0 International License. Based on a work at www.crimsonpublishers.com.
Best viewed in
a Creative Commons Attribution 4.0 International License. Based on a work at www.crimsonpublishers.com.
Best viewed in