
- About Us
- Information
-

The Author ensures that the research has been conducted responsibly and ethically with adherence to all relevant regulations. read more..
- For Authors
- For Reviewer
- Manuscript Guidelines
- Membership
- Publication Ethics
-
- Journals
- Reprints
- e-Books
- Videos
- Policies
- Contact Us
 COVID-19
- Submissions


Full Text
Novel Research in Sciences
The Investigation of the Effects of N2 Injection on Oil Productivity in Cornea Field, Western Australia
Abdullah N1, Hasan N1*, Eissa M2 and Parvez MA3
1PCE, Universiti Teknologi Brunei, Brunei
2Petroleum Engineering Department, Universiti Teknologi PETRONAS, Malaysia
3Chemical Engineering Department, University of Hafr Al Batin Hafr Al Batin, Saudi Arabia
*Corresponding author: Nurul Hasan, PCE, Universiti Teknologi Brunei, Brunei Darussalam, Brunei
Submission: July 13, 2021;Published: August 02, 2021
.jpg)
Volume8 Issue5August, 2021
Abstract
Oil recovery from reservoir usually leads to a reduction in reservoir pressure, reduction in recovery efficiency and thus production rate. Hence, EOR methods has been used as an efficient technique for improving oil recovery efficiency. One of the techniques is nitrogen N2 injection. For miscible or immiscible gas injection, N2 is a suitable gas to be used other than carbon dioxide. N2 is a good reservoir pressure maintenance when compared to carbon dioxide. From past studies, N2 injection was proved to be able to recover up to 45-90% of initial reserves. Therefore, the aim of this study is to determine the effect and productivity of nitrogen injection on oil production in the Cornea Field. This study was conducted because there was no investigation on the effectiveness of N2 injection to improve oil production in the Cornea Field. The model was validated by comparing MMP obtained from the result with MMP correlation methods. Correlations were used because it was more time saving and easier method despite its accuracy. From the correlation calculation, the closest MMP is 27 bar and MMP from simulation of this reservoir is at 30 bar. Therefore, the model is proved valid. Sensitivity analysis were conducted by varying different reservoir properties such as initial reservoir pressure, reservoir temperature and N2 injection rate. From the result, oil production increased with decreased in pressure and increased in temperature. On the other hand, oil production fluctuated with increased in injection rate.
Keywords:Pressure maintenance; Nitrogen injection rate; Reservoir temperature; Minimum miscibility pressure; Reservoir simulation
List of Abbreviations
Table 1: List of symbols (Abbreviations Descriptions).

Nomenclature
Table 2: Symbol descriptions and units.

Introduction
Oil production from hydrocarbon reservoir usually leads to a reduction in reservoir pressure thus reduction in recovery efficiency and production rate. Enhanced Oil Recovery (EOR) methods has been used as an efficient technique for improving oil recovery efficiency. One of the method that has been used successfully is nitrogen injection [1]. Nitrogen (N2) is one of the most abundant non-hydrocarbon gases that is easy to obtain and cheaper than other non-hydrocarbon gases available. It is an inert gas that has no reaction to oil and no impurity produced when injected into oil reservoir. N2 for EOR can be taken from air, flue gas and gas reservoir with high N2 content. N2 can also form a miscible slug if injected in high pressure and has good injectivity in low permeable reservoir. In addition, N2 also a good reservoir pressure maintenance when compared to carbon dioxide [2-6]. For miscible or immiscible gas injection, N2 is a suitable gas to be used other than carbon dioxide. The gas injected at or above the Minimum Miscibility Pressure (MMP) and become miscible with oil is called miscible gas injection. While gas injected below MMP is known as immiscible gas injection. The factors affecting miscibility are composition, fluid characteristic, pressure and temperature [7]. From past studies, N2 injection was proved to be able to recover up to 45-90% of initial reserves [8]. Therefore, the aim of this study is to determine the effect of nitrogen injection on oil production in the Cornea Field (Figure 1). The Cornea Field is located in Browse Basin, Western Australia. It is a simple trap structure which is elongated and formed by unfaulted drape anticline over eroded high basement [9]. This study is done because there was no investigation on the effectiveness of N2 injection to improve oil production in the Cornea Field.
Many investigations on nitrogen injection has been undergone in many fields (Figure 2). Study by [10] showed that N2 injection were targeted in a fractures cavity unit in Tahe oilfield in northwestern China. The Tahe oilfield in Tarim basin was a marine carbonate oilfield with largest reserves and highest production expected. After secondary recovery, waterflooding still recovered lower oil production due to oil flow and residual distribution uncertainty. Later, N2 injection were introduced into fractured cavity carbonate reservoir due to its high oil sweep efficiency. The aim of the research was to evaluate the feasibility and oil recovery efficiency of N2 injection in multi-well fractured cavity reservoir. A 2D fractured cavity model and 3D pressure resistant model were constructed to foresee the mechanism of remaining oil and production performances. Four wells were positioned in 2D and 3D model involving bottom water depletion, water injection and N2 injection. The 2D model showed that the main mechanism for N2 injection to produce remaining oil was to occupy the high position and replace the attic oil due to gravitational differential. The study also discovered that higher oil recovery of 71.6% can be obtained from both 2D and 3D model when N2 was injected through high positional wells. The 3D model was closely representing the real reservoir; therefore, it can be used as a pilot to reflect the production performance of the real field production. In conclusion, N2 injection was confirmed to be efficiency flooding and can be implemented in this field [11]. Research on naturally fractured carbonate field was also studied by [11] in Cantarell complex, located on off- shore of Mexico. There were five fields in Cantarell complex, and the largest oil field was Akal field with 32 billion STB and 86% of OOIP in the complex. N2 injection has been conducted in the Cantarell Complex in 2000 which has been an important pressure maintenance project around the world in regard with incremental oil, production rate, N2 injection rate and investment. The pressure maintenance program started with injection of 300 MMSCFD of nitrogen in May 2000 and reached the maximum programmed injection rate of 1.2 BSCFD by December 2020. N2 were injected into the top gas cap of Akal field through seven wells. The response of the field was monitored through a designed program to monitor pressure, N2 concentration and gas-oil contact movement. A cumulative volume of 1400 BSCF of nitrogen has been injected after four years and the pressure in the oil column has been kept at 1455 psi. The pressure were estimated to drop to 1220 psi if nitrogen injection was not constantly injected. On the other hand, gas-oil contact stayed at a flat surface at a rate of 230ft/yr. Monitoring program showed that the nitrogen were not dissolved into the gas cap and its concentration in oil column stayed the same. From the results, it shows that N2 injection contributed to the oil production as of beginning of 2004 was estimated to be 628 MBPD. Therefore, this study has proven the pressure maintenance by N2 injection was successfully technically and economically [12,13].
Figure 1:Enhanced Oil Recovery (EOR) method.

On the other hand, an overpressred naturally fractured Ekofisk field in the Norwegian sector of North Sea were also studied by [14]. The purpose of this study was to accelerate gas sales and to increase recovery factor by injecting 200 MMSCFD of N2 into the reservoir. The OOIP of Ekofisk field was observed to be 6.7×10⁶ BBL and gas saturation was at 10.3 TSCF and forecast to be 24% of OOIP assuming 1 BBL oil equals to 6 TSCF. The proposed N2 injection wells were located in the crest of the field. Model were developed with PVT model where pressure and nitrogen composition, mass transfer by diffusion and gas oil capillary pressure as a function of pressure N2 concentration and the rock compressibility as a function of net overburden pressure were taken into account. The experiment data of depletion studies, swelling and vaporization experiment on mixtures of reservoir oil, dry gas and N2 were matched with the Soave-Redlich-Kwong Equation of State (EOS) and a nonlinear regression PVT -correlation program. Fine- grid simulation with wells producing from this field were matched with 2D coarse grid and 3D models. From N2 injection into the upper part of Ekofisk field, it showed that gas saturation of 30% to 60% were observed and oil production of 165×106 BBL were obtained [14]. A study by [15] was conducted in Ganhar field located in India on GS-4 reservoir and most of the reservoir volume was located by the gas cap. The GS-4 reservoir was initially estimated to have 48.8 MBBL of OOIP and gas cap of rich gas condensate of 307 BSCF. The reservoir produced 9.77 MBBL during the first oil production. The reservoir pressure was at 4280 psi when discovered and a five spot pattern water flood was initially implemented to maintain the reservoir pressure and recovery factor of 40.2% were obtained. The aim of this research was to determine the feasibility of N2 injection application in this field. A composition model of GS-4 reservoir was constructed using seven component Equation of State (EOS) model to study the N2 injection performance. The model was stationed with one injector, two gas producers, two oil producers and eight water injectors. There were four cases developed where Case 1 represented the current operating scheme and Case 2 and Case 3 included N2 injection while Case 4 only include natural gas injection. In addition, two scenarios were identified where scenario A assumed that N2 to be purchased from a third party while scenario B represented the capital investment of building N2 production facility. Lastly, NPV were also evaluated. From the results it showed that recovery factor was highest in Case 3 scenario B with NPV of 1592 MM$ and recovery factor of 42.2%. Hence, water flood followed by N2 injection helped increased the recovery factor of oil reservoir production [15]. Contrarily, an investigation on Tensleep reservoir located in the Elk Basin on Wyoming-Montana border by [16] aimed to maintain the reservoir pressure in order to maintain high production rates and desirable recovery factor. The oil accumulation was located at approximately 4900 feet below surface and initial saturation pressure was at 1250 psi. Early pressure-production performance showed no active water drive, and the primary recovery mechanism was solution gas. In addition, most of the reservoir in Tensleep performed gas reinjection, therefore, the volume of gas reinjected into the gas cap was not enough to sustain the reservoir pressure. Hence, reservoir pressure eventually dropped with recovery efficiency greatly reduced. With N2 injection implemented in the reservoir, the reservoir pressure started to increase at steady rate. After 15 months of injection, oil production produced at 19000 BBL/D with reservoir pressure reached to almost 1300 psi which was the targeted maintenance pressure [16,17]. On the other hand, a study by [17] on N2 injection in Turner Valley field in Calgary were conducted. After waterflooding of 50 years, the field left with over 1.3 BBL of oil in place and 2% incremental recovery. Therefore, to extract the remaining OOIP, it was achieved through N2 injection. N2 was used due to its abundance. Also, to reach the miscibility for Turner Village field, they utilized N2 injection to achieved 6000 psi. The aim of this project is to model a N2 injection within the Turner Village field and to foresee if nitrogen injection is economically viable. A structural model of a six square mile section of the southern portion of the field were built and characterized with density porosity logs in Petrel seismic interpretation tools section. Solvent model were used to simulate the N2 injection. Three cases were simulated for 30 years using Eclipse simulator: Case 1 injecting single well located at the crest of the gas cap with all gas producers shut in, Case 2 injecting a single well located at the crest of the gas cap with all gas producers open to production injecting at six wells located in the upper portion of the gas cap, lastly Case 3 injecting six wells located in the upper portion of the gas cap with all gas producers shut in. From the results, it shows that Case 1 has a higher cumulative oil production compared to Case 2 and Case 3. However, Case 2 was the best method to be implemented since it has a highest net present value of 59 MM$ and rate of return of 64% and oil price of $40/BBL when compared with Case 1 and Case 3. From the simulation, if the oil price reached $80/BBL, N2 injection investment should be considered in Turner Valley field [17]. AI driven selection criteria is needed to screen all the possibilities [18]. It is important to determine the MMP of the reservoir to ensure successful operation of the miscible flood. There are few known correlations to determine the MMP of nitrogen such as Firoozabadi, Aziz, Glaso and Hudgins et al. correlations. N2 is usually injected in high temperature reservoir and light volatile oil reservoir. The higher the temperature of the reservoir, the higher the MMP. Also, the higher the C7+ molecular weight, the higher the MMP. However, N2 MMP decreases with oil samples with high methane or intermediate components. The amount of decrease is a function of oil composition. N2 become miscible at certain condition of very high pressure and efficiently reduced the oil viscosity and provides efficient miscible displacement [19,20]. A research on the potential of miscible on the potential of miscible N2 injection application injection application by [21] on Southeast assets in Abu Dhabi which included three giant onshore oil fields were studied. MMP for different fields on the potential of miscible N2 injection application -oil injections were determined as a key criterion for screening. The CGM simulation and correlation were implemented and determined to obtain N2 MMP for these fields. Correlation is quick, easy and require few input data and also fast screening of reservoir potential for gas injection. To predict MMP, Peng-Robinson equation of state was used and WINPROP software was utilized. It is a compositional PVT equation of state based programmed for use with CMG simulator. From the results, it showed that N2 injection was the optimum method to be implemented in some of the fields. The MMP correlation were applied to available data sets and comprehensive analysis was performed by comparing the predicted values calculated from published correlations from simulated value from CMG simulation. It showed that the Hudgin and Sebastian correlations were matched with the simulated MMP. From the study, it showed that simulated result indicated positive potential of the fields for pure miscible N2 gas injection, therefore, this motivated the application of N2 injection in these fields to increase recovery factor [21]. Investigation by [22] on N2 injection followed by waterflooding were implemented in the Jay/LEC field, a carbonated oil reservoir in Florida panhandle and South Alabama. A period of gas and water injection for 15 years were undergone until depletion. This field had been known for an ideal miscible displacement candidate because oil was miscible with nitrogen at reservoir condition. This project were implemented in Jay/LEC to recover an additional 47 MMBBL oil. N2 was selected as injection gas over hydrocarbon gas and CO2 [23,24] primarily because N2 was a cheaper gas compared to other gases and due to it availability. A modified version of Exxon’s General-Purpose Simulator (GPSIM) was used to construct 2D and 3D reservoir simulation to obtain reservoir recovery and performance. From the simulation, it showed that gas injection with decreasing water infectivity did not create operational problem as long as trapped gas saturation was at 25% PV or less. A conventional slim tube experiments were conducted to determine MMP for N2 with Jay/LEC crude at reservoir temperature of 285 °F . The MMP were determined at 3600 psi. The ultimate recovery were expected to increase to 47 MMBBL or 6.5% of 728 MMBBL OOIP. From the results, it showed that ultimate recovery was as expected and able to produce 393 MMBBL OOIP [22,25,26].
Figure 2: Structural element of browse basin: Cornea field on the upper right side of the map (black lines represent faults) [10].

Lastly, another naturally fractured reservoir were studied by [27], in Piedemonte (PDM) fields (Pauto and Flo- reña) which was located in the eastern Colombian, Casanare state. Pauto and Floreña fields have been producing since 2001 and it was a folded structures generated from compressive forces of tectonic plates. The aims of the study were to construct the mathematical model for compositional and naturally fractured reservoir using commercial tools, to determine the recovery factor and to see the impact of dual porosity/dual permeability have in recovery efficiency in N2 injection in Piedemonte field using a reservoir simulation model. Due to lack of laboratory data, a set of analogue data were used in order to account for the uncertainty. MMP simulation were conducted using the interaction coefficients from other fields that had laboratory test with N2 injection. At 4000 psi, it showed that the MMP simulation with N2 was immiscible. Therefore, miscibility only achieved at MMP above 4000 psi. A naturally fractured model showed that gas recovery factor of 9% to 14% after N2 injection while lean gas only had recovery factor between 1% and 3% in 10 years. Nitrogen injection also accomplished a net incremental volume between 78 to 110 MMBOE. Also, higher oil saturation in the displacement front were identified when N2 were injected compared to no N2 injected. Lastly, higher sweep efficiency was also observed with dual porosity/dual permeability model due to the improvement in matrix-facture communication where more fluid were allowed to move from reservoir to wells [27]. From the literature review, most of the studies showed that miscible N2 injection was the most efficient way for oil recovery. Therefore, the aim of this paper is to determine production recovery by miscible N2 injection into the reservoir. The objectives of this paper are: a. To implement N2 injection simulation into the Cornea Field b. To determine the Minimum Miscible Pressure (MMP) c. To evaluate the effect of miscible N2 injection on oil production recovery in the Cornea Field for 20 years
Methodology
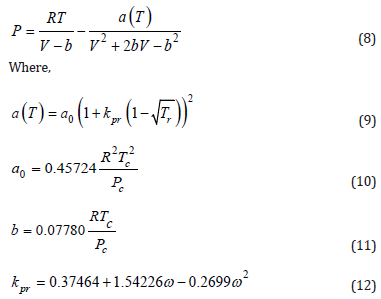
Data was mostly collected from Geoscience Australia, and some were from Occam Technology Company. The model was constructed using the PETREL software by importing data collected. Pressure- Volume-Temperature analysis (PVTi) and ECLIPSE software were used in this research for reservoir simulation. PVTi as an equation of state-based program was used to characterize a set of reservoir fluid samples. This is important because the model need to have a realistic physical model of the fluid sample before input it to the reservoir simulation. The output of the PVT data was then imported into ECLIPSE [28-31]. Table 3 below shows the steps in generating PVT table. Equation (11) to Equation (12) were implemented in the PVTi software to generate the result [32].
Table 3:Symbol descriptions and units.

Equation of state for real fluid

Cubic equation
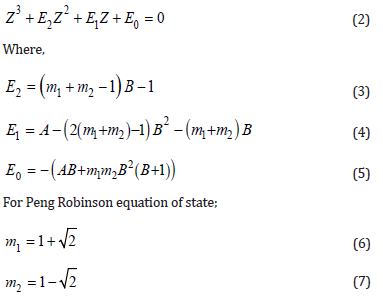
The intensive form of Peng Robinson EOS
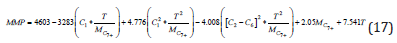
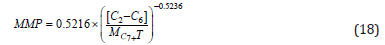
The PVT data was imported into ECLIPSE and used to simulate the N2 injection. The N2 injection keyword WINJGAS was used to implement the gas injection well. MISCIBLE keyword was used for miscible N2 injection reservoir. The model was validated by comparing MMP obtained from the result with MMP correlation methods. Correlations were used because it was more time saving and easier method despite its accuracy. The sensitivity analysis was done by varying different reservoir properties such as initial reservoir pressure, reservoir temperature and N2 injection rate. Below are the correlations used to calculate the MMP [21,33,34]:
Glaso (1985)

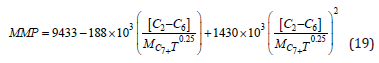
Hudgins et.al (1990)
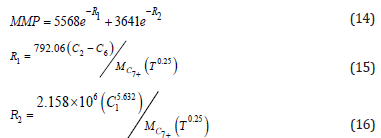
Sebastian & Lawrance (1992)
Hassen (1988)
Firoozabadi & Aziz
Results & Discussion
Two wells were simulated in this reservoir where one acted as an injector and one as a producer. This is to evaluate the effectiveness of the single injector and producer on production. See Figure 3 for the reservoir model with injector and producer wells. Table 4 below shows the model condition imported in PETREL. Table 5 shows component and mole fraction data inputted to PVTi software. From Figure 4, the MMP of this reservoir is at 30 to 40 bar where production started. From the correlation calculation, the closest MMP is 27 bar calculated from Glaso correlation. Hence, the miscibility of the reservoir is assumed to be at 30 bar. Therefore, it is evaluated as a valid model. See Table 6 below. Sensitivity analysis were tested after the model was validated to evaluate the effects of the variable on oil pro- duction.
Table 4:

Table 5:

Table 6:

Figure 3:Cornea field with single injector and producer.

Reservoir pressure
Initial reservoir pressure was tested from 30 Bar to 110 Bar. Other parameters were maintained at constant. From Figure 4, it shows that from 40 bar to 50 bar, oil production started to produce and increased. Then production started to deplete from 60 bar to 110 Bar. As the pressure increased, N2 injection decreased, hence leads to decrease in production. The initial increased in oil production at between 30 to 40 bar indicated the Minimum Miscible Pressure (MMP) where oil production started. Figure 5 shows the field oil production total decreased as pressure increased with time. Figure 6 shows the field water production total.
Figure 4: Cumulative oil production VS Reservoir pressure.

Figure 5:Field oil production total VS years for reservoir pressure

Figure 6: Field water production total VS years for reservoir pressure.

Reservoir temperature
Initial reservoir temperature were tested from 110 °C to 160 °C while maintaining other parameter constant (Figure 7). Figure 8 shows that production increased from 110 °C to 160 °C. At reservoir temperature 130 °C to 160 °C, the reservoir temperature seemed to plateau, however, there were small difference in temperature. Hence, oil production increased with reservoir temperature. This is because molecular activity increases with temperature, producing more interaction between phases. This increased in phase interaction was translated into a faster vaporization process during nitrogen displacement of crude oil and an increase of equilibrium constants with temperature thus increased in oil production. That also means, theoretically, that miscibility can be obtained faster because vaporization is greater at higher temperatures. Figure 9 shows the field oil production total increased as temperature increased with time. Figure 10 shows the field water production total.
Figure 7: Left to right-reservoir simulation of reservoir pressure distribution at 60 Bar, 70 Bar, 90 Bar & 110 Bar.

Figure 8: Cumulative oil production VS reservoir temperature.

Figure 9: Field oil production total VS years for reservoir temperature.

Figure 10: Field water production total VS years for reservoir temperature.

N2 injection rate
Nitrogen injection rate from 500sm3/day to 900sm3/day were conducted to see the effect of the injection rate on oil production in the reservoir (Figure 11). Other parameter were maintained in constant value. Figure 12 shows the oil production fluctuated with increasing in N2 injection rate from 500sm3/day to 900sm3/day. It shows that production increased from 500sm3/day to 600sm3/day. This is because as the N2 injection increased, more N2 molecules continued to penetrate the void in the reservoir, which result in more interaction with the residual oil in the reservoir, thus increased in oil production. However, from 600sm3/day to 800sm3/ day it started to deplete, then increased again at 900sm3/day. From the graph, it shows that the highest production was produced at 600sm3/day. Hence, the ideal injection rate is at 600sm3/day. Figure 13 shows the field oil production total increased as temperature increased with time. Figure 14 shows the field water production total.
Figure 11:Left to right-reservoir simulation of pressure distribution at reservoir temperature 110 °C, 130 °C, 150 °C & 160 °C.

Figure 12: Cumulative oil production VS N2 injection rate.

Figure 13:Field oil production total VS years for N2 injection rate.

Figure 14:Field water production total VS years for N2 injection rate.

Conclusion
This concludes few crucial findings:
a. It shows that the sensitivity variables such as reservoir pressure, reservoir temperature and injection rate can affect the oil production.
b. Oil production increased with decreased in reservoir pressure and increased in reservoir temperature. Hence, it shows that these parameters can affect the reservoir productivity.
c. Oil production also affected by N2 injection rate. Hence, N2 injection rate is also a crucial factor that need to be taken into account in order to increase the recovery factor (Figure 15).
d. When compare with naturally drive production, it shows that more oil can be produced with N2 injection. Therefore, it proves that miscible N2 injection is a feasible method to be used in boosting recovery factor.
Figure 15: Left to right-Reservoir simulation of pressure distribution of CO2 injection rate 500sm3/day in 2019, 2025, 2029 & 2038.

Hence, this paper contributes to the gap present in the Cornea Field since no N2 injection simulation were con- ducted before (Table 7). However, it is important to take into account the economic feasibility of the project. Hence, the study on the economic evaluation of this paper is crucial and recommended.
Table 7:

Acknowledgment
The authors would like to thank for the donation of the Petrel E&P software platform and the ECLISPE industry- reference reservoir simulator. This donation of modern computer tools is adding great value to both teaching and research. The authors would like to thank Schlumberger for their valuable support, benefitting both students and staff at the PCE, UTB.
References
- Bazargan M, Broumand P, Gudmundsson A, Meredith P (2019) Numerical modeling of nitrogen gas-assisted gravity drainage to improving oil recovery in a fractured media. Rock Fractures in Geological Processes.
- Alagorni A, Nour A, Yaacob Z (2015) An overview of oil production stages: Enhanced oil recovery techniques and nitrogen injection. International Journal of Environmental Science and Development 6(9): 693-701.
- Kashim MZ (2014) Gas condensate reservoir: A new approach to enhance condensate recovery and improve well productivity.
- Pourhadi S, Fath AH (2020) Performance of the injection of different gases for enhanced oil recovery in a compositionally grading oil reservoir. Journal of Petroleum Exploration and Production Technology 10(2): 641-661.
- (2009) Increased Production through Enhanced Oil Recovery (EOR).
- Siregar S, Hidayaturobbi AD, Wijaya BA, Listiani SN, Adiningrum T, et al. (2007) Laboratory experiments on enhanced oil recovery with nitrogen injection. ITB Journal of Engineering Science 39(1) :20-27
- Al Anazi BD (2007) Enhanced oil recovery techniques and nitrogen injection. CSEG RECORDER 32(8): 29-33.
- Lwisa EG, Abdulkhalek AR (2018) Enhanced oil recovery by nitrogen and carbon dioxide injection followed by low salinity water flooding for tight carbonate reservoir: Experimental approach. IOP Conference Series: Materials Science and Engineering 323: 012009.
- Ingram GM, Eaton S, Regtien JMM (2000) Cornea case study: Lesson learned. APPEA Journal 40(1): 56-65.
- Poidevin SL, Kuske T, Edwards D, Temple R (2015) Australian petroleum accumulations report 7 browse basins: Western Australia and Territory of Ashmore and Cartier Islands adjacent area, (2nd edn).
- Su HW, Zhou J, Xi TY, Cui C (2017) Experimental investigation on continuous N2 injection to improve light oil recovery in multi-wells fractured-cavity unit. Petroleum 3(3): 367-376.
- Sanchez JL, Astudillo A, Rodriguez F, Morales J, Rodriguez A (2005) Experimental investigation on continuous N2 injection to improve light oil recovery in multi-wells fractured-cavity unit. SPE.
- Vicencio OA (2007) Nitrogen injection into naturally fractured reservoirs.
- Thomas LK, Dixon TN, Plerson RG, Hermansen H (1991) Ekofisk nitrogen injection. SPE-19839-PA 6(2).
- Tiwari S, Kumar MS (2001) Nitrogen injection for simultaneous exploitation of gas cap. In: SPE Middle East Oil Show, Manama, Bahrain, SPE.
- Fraher JA (1953) The Elk Basin Embar-Tensleep Reservoir Park County, Wyoming and Carbon County. Montana.
- Koracin I (2015) Investigating the feasibility of nitrogen injection in turner valley, Petroleum Engineering.
- Adasani AA, Bai B (2011) Analysis of EOR projects and updated screening criteria. Journal of Petroleum Science and Engineering 79(1-2): 10-24.
- Saoyleh HR (2016) A simulation study of the effect of injecting carbon dioxide with nitrogen or lean gas on the minimum miscibility pressure.
- Choubineh A, Helalizadeh A, Wood DA (2019) Estimation of minimum miscibility pressure of varied gas compositions and reservoir crude oil over a wide range of conditions using an artificial neural network model. Advances in Geo-Energy Research 3(1): 52-66.
- Belhaj H, Khalifeh A, Abu H, Javid K (2013) Potential of nitrogen gas miscible injection in Southeast assets. Society of Petroleum Engineers.
- Christian LD, Shirer J, Kimbel A, Blackwell EL, J R (1981) Planning a tertiary oil-recovery project for Jay/LEC fields unit. Society of Petroleum Engineers 33(8): 1-535.
- Zhang Y, Yu W, Li Z, Sepehrnoori K (2018) Simulation study of factors affecting CO2 Huff-n-Puff process in tight oil reservoirs. Journal of Petroleum Science and Engineering 163: 264-269.
- Khazam M, Arebi T, Mahmoudi T, Froja M (2016) A new simple CO2 minimum miscibility pressure correlation. Oil & Gas Research 2(3): 432-440.
- Manrique EJ, Muci VE, Gurfinkel ME (2007) Enhanced oil recovery field experiences in carbonate reservoirs in the United States. Center for Energy and Technology of the Americans (CETA) 10(6): 667-686.
- Gottschling JC, Royce TN, Shuck LZ (1985) Nitrogen gas and sand: A new technique for stimulation of devonian shale. Journal of Petroleum Technology 37(5): 901-907.
- Guevara CGH (2016) Simulation of nitrogen injection as an enhanced recovery method in a tight natural fracture sandstone reservoir with compositional fluids.
- Saoyleh HR (2016) A simulation study of the effect of injecting carbon dioxide with nitrogen or lean gas on the minimum miscibility pressure.
- Ying ZH (2013) Evaluation of methods to lower MMP of crude oil in gas miscible displacement.
- Syzdykov M (2014) Evaluating gas injection performance in very low permeability, thick carbonate gas-condensate reservoirs to improve ultimate liquid yield.
- Wang Z, Yao Y, Wang J, Zhou X, Qiao C, et al. (2014) Analysis of nitrogen gas flooding development effect on water-flooding reservoirs. Advanced Materials Research 1010-1020: 1684-1688.
- Schlumberger (2014) Schlumberger, ECLIPSE Pre- and Post-Processing Suite PVTi.
- Adekunle O (2014) Experimental approach to investigate minimum miscibility pressures in the Bakken.
- Khazam M, Arebi T, Mahmoudi T, Froja M (2016) A new simple CO2 minimum miscibility pressure correlation. In: ICCPGE, Al-Mergib University ALKHOMS LIBYA, Libya, pp. 432-440.
© 2021 Hasan N. This is an open access article distributed under the terms of the Creative Commons Attribution License , which permits unrestricted use, distribution, and build upon your work non-commercially.
Editor In Chief


.jpg)


Signup for Newsletter

Quick Links
 Editorial Board Registrations
 Submit your Article
 Refer a Friend
 Advertise With Us
Our Recent Edition

.jpg)


Top Editors


.jpg)


.bmp)
.jpg)
.png)
.jpg)


.jpg)


.png)

.png)


.png)


Financial Support

Sponsors

Latest e-Books

Latest Video

 a Creative Commons Attribution 4.0 International License. Based on a work at www.crimsonpublishers.com.
Best viewed in
a Creative Commons Attribution 4.0 International License. Based on a work at www.crimsonpublishers.com.
Best viewed in