- Submissions

Full Text
Novel Research in Sciences
A Tool for Early Detection of Septoria tritici blotch of Wheat
Vagelas I*
Assistant Professor, Department of Agriculture Crop Production and Rural Environment, Greece
*Corresponding author:Vagelas I, Assistant Professor, Department of Agriculture Crop Production and Rural Environment, Greece
Submission: March 15, 2021;Published: March 25, 2021
.jpg)
Volume7 Issue1March, 2021
Abstract
The detection of Septoria Tritici Blotch (STB) of wheat early infection represents the ultimate sensitivity for early disease diagnosis and management. In this research we are presented evidence that it is possible to perform such measurements in real-time using low-cost infrared thermal imaging, opening up the potential for the importance of STB early diagnosis.
Keywords: Early diagnosis; Rapid diagnosis; Plant diseases
Introduction
Early detection of plant disease infection plays a crucial role in all management and prevention strategies. Most plant diseases are caused by fungal organisms expressed visible disease symptoms on the plant. Symptoms may include a change in color or function of the plant tissue as it responds to the pathogen. For Zymoseptoria tritici (syn. Mycosphaerella graminicola or Septoria tritici) infection, the caused agents of wheat blotch diseases, we are not seeing the disease pathogen nor the early pathogen symptoms, but only the tritici blotch leaf lesion symptoms and the black asexual fruiting bodies (pycnidia) within the blotches at the end of the infection [1,2] (Figures 1 & 2). In detail, the leaves appear healthy and symptomatic plants are found 11-15 days after hyphae infection and pycnidia formation are instated in this stage (Figure 3). At this stage leaf cell death begins. Finally, mature pycnidia (Figure 3) are formed, which produce the multi-cellular macropycnidiospores [1,3].
Figure 1: Effects of Zymoseptoria tritic inoculum and infrared thermal
imaging on wheat leaves where; 0: a healthy wheat leaf,
a) a leaf with spots (halos),
b) elliptical yellowish halos,
c) elliptical, light brown lesions,
d) elliptical, brown lesions with yellow halos.
Wheat leaf area temperature and symptoms were recorded on the 8th,
11th, 14th, and 17th days after inoculation and marked as 1, 2, 3, and 4
respectively. The 1750 value is equal to temperature 17.5 °C, the 1825
value is equal to temperature 18.25 °C, and so on

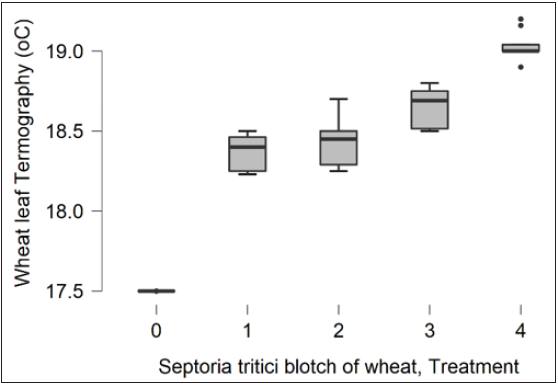
Figure 2:Infrared thermal imaging analysis on the 8th, 11th, 14th, and 17th days after leaves inoculation with Zymoseptoria tritici. Treatments 1, 2, 3, 4 presents the 8th, 11th, 14th, and 17th days after leaves inoculation with Z. tritici and 0 the healthy wheat leaves.

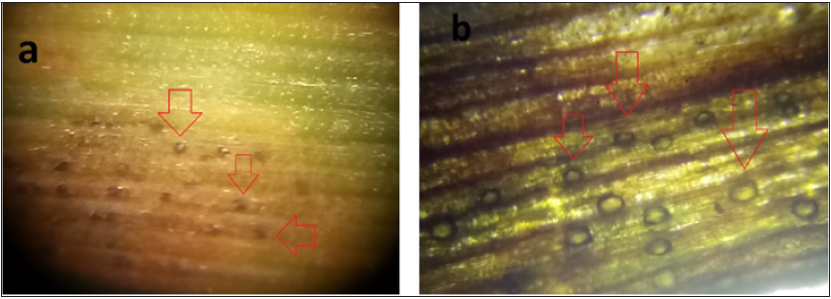
Figure 3: Z. tritici immature pycnidia (a, red arrows) and mature pycnidia (b, red arrows).

This type of infection,
i) the spore germinates on the epidermis,
ii) the fungus enters via stomata,
iii) the fungus colonizes and develops biomass the leaf
mesophyll,
iv) symptoms appear (known as necrotrophic phase) and
v) the fungus produces fruiting bodies, pycnidia were also
identified for P. nodorum leaf infection [1].
So, rapid and accurate identification of the underlying agent Septoria tritici blotch of Wheat was not possible with a diagnostic test and early infection identification for correct control is necessary. This is particularly true for emerging Leaf Blotch Diseases of Wheat such as Septoria tritici Blotch, Stagonospora nodorum Blotch, and Tan Spot. Based on that, assessing the early diagnosis of leaf blotch diseases of wheat caused by Z. tritici via infrared thermal imaging is the aim of this study.
Material and Methods
Development of low-cost thermal imaging system as a screening instrument for early detection of Septoria tritici blotch of wheat
In this research, a low-cost, compact, and portable SparkFun AMG8833 Grind-Eye thermal camera was used. This camera (AMG8833) can accurately measure the temperature distributions without any significant delays and does not require any modelspecific software for analyzing and processing the image [4]. The AMG8833 consists of an array of 8×8 thermal IR sensors from Panasonic and its output are used for temperature calculations. This sensor (AMG8833) is a compact device that detects the heat energy being emitted by an object and converts it into an electronic signal which can be processed further to display a thermal image on a video monitor which is a PC screen [4]. So, the object to be imaged is captured using the AMG8833 thermal camera communicated with a microcontroller (Arduino Uno), and the results of the thermal camera measurement were presented as 64 individual pixels, in a form of an 8x8 matrix. To obtain the corresponding thermal image with the real image, a 1080P web camera with a FULL HD glass lens was connected with the existing thermal imaging system.
Thermography in planta
To generate the plant (wheat) heat map, wheat leaves were inoculated with Z. tritici pycnidia or not as described by Solomon et al. [5]. In infected or not infected wheat leaves we tested our thermal system recorded wheat leaf area temperature on the 8th, 12th, 14th, and 17th days after inoculation.
Statistical analysis
Statistical analyses were performed using JASP Statistical Software [6].
Results and Discussion
Thermography in planta. Results showed that infected wheat leaves exhibit at the inoculation point a significantly higher temperature compared with the healthy leaf area (Figure 1). The temperature of the infected wheat leaves was approximately 18,37 °C (±0,032), 18,43 °C (±0,044), 18,65 °C (±0,035), 19,04 °C (±0,027), on the 8th, 12th, 14th, and 17th days after inoculation respectively, compared to temperature (17.5 °C) of the healthy (non-inoculated) wheat leaf area (Figures 1 & 2). This observation is in agreement with Zhu et al. [7]. Zhu and coworkers [7] presented that i) visual diagnosis of plant disease is possible via infrared thermal imaging and ii) infected plant tissue has an increasing temperature trend. Zhu and coworkers [7] showed that leaf disease ranged from 0.4 to 2 °C. The same results were presented here concluded that thermal imaging for wheat leaves inoculated with Z. tritici showing a significantly higher temperature when visible disease symptoms were observed (Figure 1). Our results demonstrated that in early infection, on the 8th day after inoculation, the fungus probably made changes in photosynthesis. Whereas on the 11th, 14th, and 17th days after inoculation the fungus serves as a necrotrophic fungal pathogen and kills host tissue during colonization (Figure 1). During that period a higher temperature (Figure 2), at the inoculation point was recorded when visible disease symptoms were observed (Figure 1).
Our results demonstrated that in early infection the leaf lost water due to fungus penetration, and the establishment and later fungus made changes in photosynthesis or even cell death. These changes in leaf physiology during Z. tritici development are followed by a temperature increase due to tissue desiccation as Figure 1 & 2 describes. Finally, immature, and mature pycnidia appeared (Figures 3), in the inoculated leaves on the 14th, and 17th day following the cell death of the wheat leaf tissue (Figure 1). Overall, in this research, we demonstrated that thermal image analysis is a promising tool for the early detection of leaf diseases such as Septoria tritici blotch of wheat.
References
- Vagelas I (2021) Latest application technology in wheat crop simulation and disease prediction models. Mod Concep Dev Agrono 7(5), MCDA. 000674.
- Vagelas I (2021) A simple infection model for foliar pathogens of wheat. Nov Res Sci 6(2): NRS. 000635.2021.
- Steinberg G (2015) Cell biology of Zymoseptoria tritici: Pathogen cell organization and wheat infection. Fungal Genet Biol 79: 17-23.
- Haripriya AB, Sunitha KA, Mahima B (2020) Development of low-cost thermal imaging system as a preliminary screening instrument. Procedia Computer Science 172: 283-288.
- Solomon PS, Wilson TG, Rybak K, Parker K, Lowe RG, et al. (2006) Structural characterisation of the interaction between Triticum aestivum and the dothideomycete pathogen Stagonospora nodorum. European Journal of Plant Pathology 114(3): 275-282.
- JASP Team (2021) JASP (Version 0.14.1).
- Zhu W, Chen H, Ciechanowska I, Spaner D (2018) Application of infrared thermal imaging for the rapid diagnosis of crop disease. IFAC-Papers OnLine 51(17): 424-430.
© 2021 Vagelas I. This is an open access article distributed under the terms of the Creative Commons Attribution License , which permits unrestricted use, distribution, and build upon your work non-commercially.
 a Creative Commons Attribution 4.0 International License. Based on a work at www.crimsonpublishers.com.
Best viewed in


.jpg)


 Editorial Board Registrations
 Submit your Article
 Refer a Friend
 Advertise With Us
.jpg)


.jpg)


.bmp)
.jpg)
.png)
.jpg)


.jpg)


.png)

.png)


.png)


