- Submissions

Full Text
Novel Research in Sciences
Investigation of Impact of Consciousness Energy Treatment on Physical, Thermal and Spectroscopic Properties of Sodium Molybdate
Mahendra Kumar Trivedi1 and Snehasis Jana2*
1Trivedi Global, Inc., USA
2Trivedi Science Research Laboratory Pvt Ltd, India
*Corresponding author:Snehasis Jana, Trivedi Science Research Laboratory Pvt Ltd, India
Submission: February 01, 2021;Published: March 10, 2021
.jpg)
Volume6 Issue3March, 2021
Abstract
Molybdenum plays an important role as a mineral in human body as it is main constituent of molybdoenzymes which act in metabolizing the sulfur-containing amino acids. Molybdenum is included in the form of sodium molybdate in various pharmaceutical and nutraceutical supplements. The aim of this study was to investigate the impact of the Trivedi Effect®- Consciousness Energy Treatment on the physical, thermal, and spectral properties of sodium molybdate. For this, sodium molybdate sample was divided in two parts; first part was termed as control sample and kept untreated. Besides, the other part was treated remotely with the Biofield Energy Treatment by the renowned Biofield Energy Healer, Mr. Mahendra Kumar Trivedi and termed as the Biofield Energy Treated sample. The Biofield Energy Healer who was located in the USA, while the test samples and animals were located in the research laboratory in India. Consequently, both the samples were investigated using PSA, PXRD, TGA/DTG, DSC, UV-Vis, and FT-IR analytical techniques. The particle sizes d10, d50, d90, and D values of the treated sample were significantly increased by 7.18%, 7.21%, 6.93% and 7.53%, respectively as compared to the control sample. The surface area of the treated sample was found 5.65% less as compared to the control sample. Similarly, the PXRD analysis of the treated sample showed the significant changes in the relative peak intensities and crystallite sizes from -70.06% to 46.51% and-30.29% to 33.35%, respectively along with 2.73% increase in average crystallite size compared with the control sample. Besides, The TGA/DTG analysis represented 1.94% less weight loss in the treated sample along with slight increase in maximum degradation temperature (Tmax) compared to the control sample. Similarly, the DSC studies revealed minor increase in peak melting temperature (0.85%) of the treated sample along with 5.1% decrease in the latent heat of fusion as compared to the control sample. However, the UV-Vis and FT-IR studies revealed that the structural properties of the control and treated samples were remained same. The overall study represents that the Trivedi Effect®-Consciousness Energy Treatment may help in the production of a polymorphic form of sodium molybdate, which would be better powder flowability and appearance having altered thermal stability compared to the control sample. Moreover, the increased thermal stability of the treated sample may ensure its quality, efficacy, safety and stability during the process of shipment, storage, and handling. Thus, the Trivedi Effect® Treated sodium molybdate would be useful for designing the better nutraceutical and/or pharmaceutical preparations with enhanced stability and efficacy profile, against molybdate deficiency.
Keywords: Sodium molybdate; The Trivedi Effect®; Consciousness energy treatment; Particle size
Introduction
Molybdenum plays their fundamental role as a component of molybdoenzymes in the human body. The examples of these molybdoenzymes are xanthine dehydrogenase (XDH), xanthine oxidase (XO), aldehyde oxidase (AO), and sulfite oxidase (SOX) [1]. These enzymes are known for their role in the metabolism of sulfur-containing amino acids, purines, xanthines, and pyrimidines in those processes that are crucial regarding the health of human beings [2]. For example, SOX helps in converting the sulphite to sulphate; thereby supports in metabolising the sulphur amino acids cysteine and methionine. Also, this process supports the body in reducing the general harmful effects of sulphites [3]. Initially, the molybdenum was considered to play the role of an essential mineral due to being a component of molybdoenzymes; however, the further studies establish its relevancy due to its important role in SOX [1]. The research proves that apart from altered serum biomarkers, the lack of XO may not cause any major clinical abnormalities [4,5], but any impairment in the activity of SOX may be responsible for the neurological abnormalities.
Such impairment also leads to mental retardation in neonates due to changes in sulfate/sulfite kinetics as well as reduced brain mass [6]. Molybdenum is an essential component of iron- and flavin- containing enzymes. It also acts as a cofactor for three groups of enzymes by incorporating itself into molybdopterin molecule, which actually forms the cofactor [7]. Molybdenum deficiencies are considered to possess the similar symptoms as that of the sulfur toxicity [8]. Sodium molybdate is an inorganic ionic salt used as nutritional supplements for source of molybdenum. After entering in the body, the molecule gets cleaved off, thereby releasing the molybdenum from the sodium molecule and shows its positive impact on the health. Besides, the molybdenum can be used in the treatment of some copper deficiencies related rare metabolic diseases. It may also possess the antioxidant and anticancer properties [9]. Although, molybdenum is present in various food resources, however its absorption is limited due to phytic acid. Phytic acid is considered as a storage form of phosphorus and inositol in plants that are generally not bioavailable through ingestion. Similarly, soy also contains molybdenum in large amounts, but its absorption in body is hindered by phytic acid and found to be less than half of the amount ingested [10]. Thus, molybdenum is included in the form of sodium molybdate in various pharmaceutical and nutraceutical supplements. The athletes, bodybuilders, and other trainers take it as supplement; hence, they ingest sodium molybdate in a dietary supplement or in beverages such as energy drinks [2].
The Biofield Energy Treatment is currently known for its impact on altering the solubility, stability, and bioavailability of various compounds. The Biofield science and healing is emerging as frontier in Complementary and Alternative medicine (CAM) and its related therapies that improve the endogenous energy flows. It has been used as an alternative integrative approach, while its acceptance has been increased to promote wellness and quality of life through universal solutions and rectifying the root cause of diseases [11,12]. The Biofield Energy Treatment has been considered as Energy therapy and was accepted by National Center for Complementary and Alternative Medicine (NCCAM) [13-15] against many diseases. NCCAM recommend and accepted various types of Energy therapies under CAM due to several advantages in addition to other therapies, medicines and practices such as natural products, deep breathing, yoga, Tai Chi, Qi Gong, chiropractic/osteopathic manipulation, meditation, homeopathy, progressive relaxation, guided imagery, acupressure, hypnotherapy, healing touch, movement therapy, pilates, rolfing structural integration, mindfulness, ayurvedic medicine, traditional Chinese herbs, naturopathy, aromatherapy, Reiki, cranial sacral therapy and applied prayer (as is common in all religions, like Christianity, Hinduism, Buddhism and Judaism) [16,17]. Later on, the significant outcomes of the Trivedi Effect®-Consciousness Energy Treatment has been reported worldwide in non-living materials and living organisms. Hence, a human has the ability to harness energy from universe and can transmit it to any living organisms or nonliving objects. The object or recipient always receives the energy and responds in a useful way. This process is known as the Trivedi Effect®- Consciousness Energy Treatment [18,19]. The Trivedi Effect® has been widely reported for its impact on various pharmaceuticals [20,21], nutraceuticals [22,23], organic compounds [24-26], altered physicochemical properties of metals and ceramics [27,28], improved productivity of crops [29,30], and skin health [31,32]. The Biofield Energy Treatment (the Trivedi Effect®) has shown significant alteration in physiochemical properties such as particle size, specific surface area, and crystalline, chemical and thermal behavior of an atom/ion possibly through neutrinos [33]. Thus, this study was designed to analyze the effect of the Biofield Energy Treatment on the physical, thermal and spectral properties of sodium molybdate by using various analytical techniques such as, PSA, PXRD, TGA/DTG, DSC, UV-vis spectroscopy, and FT-IR spectrometry.
Materials and Methods
Chemicals and Reagents
Sodium molybdate was procured from Sigma-Aldrich. The other chemicals used in the experiment were of analytical grade available in India.
Consciousness energy treatment strategies
The test compound i.e., sodium molybdate was taken and divided into two parts. In this, one part did not receive the Biofield Energy Treatment and named as control sodium molybdate. Besides, the other part of the test compound received the Energy of Consciousness Treatment by the renowned Biofield Energy Healer, Mr. Mahendra Kumar Trivedi (USA), and it was considered as the Biofield Energy Treated sodium molybdate. In this process, the sample was placed under the standard laboratory conditions and the Healer provided the Trivedi Effect®-Energy of Consciousness Treatment to the sample, remotely, for 3 minutes through the Unique Energy Transmission process. The Biofield Energy Healer who was located in the USA, while the test samples and animals were located in the research laboratory in India. Consequently, the control sample was subjected to a “sham” healer under the similar laboratory conditions, who did not have any knowledge about the Biofield Energy Treatment. Later on, the control and the Biofield Energy Treated samples were kept in similar sealed conditions and characterized with the help of PSA, PXRD, TGA/DTG, DSC, UV-Vis, and FTIR techniques.
Characterization
Particle size analysis (PSA): The particle size analysis involved wet method, which is done using Malvern Mastersizer 3000, UK. The instrument has a detection range between 0.01µm to 3000µm [34], and the method involves the filling of sample unit (Hydro MV) with light liquid paraffin oil, which acts as dispersant medium. Further, it was stirred at 2500rpm. The refractive index values for dispersant medium and samples were 0.0 and 1.47, respectively. The measurement was taken twice after reaching obscuration in between 10% and 20%, and the average of both the measurements were done consequently. The PS analysis provides data in the form of d10μm, d50μm, and d90μm, representing the particle diameter corresponding to 10%, 50%, and 90% of the cumulative distribution. Dμm represents the average mass-volume diameter and SSA is the specific surface area (m2/Kg). The calculations were done by using software Mastersizer V3.50. The percent change in particle size (d) for d10, d50, and d90 was calculated using following equation 1:

Where, dControl and dTreated are the particle size (μm) for d10, d50, d90, and D(4,3) of the control and the Biofield Energy Treated samples, respectively.
Percent change in specific surface area (SSA) was calculated using following equation 2:

Where, SControl and STreated are the surface area of the control and the Biofield Energy treated sodium molybdate, respectively.
Powder X-ray diffraction (PXRD) analysis: The PXRD
analysis of control and the Biofield Energy Treated samples of
sodium molybdate was done using PANalytical X’Pert3 powder
X-ray diffractometer, UK. The copper line was used as the source of
radiation for diffraction of the analyte at 0.154nm X-ray wavelength
that is running at 40mA current and 45kV voltage. The instrument
uses a scanning rate of 18.87°/second over a 2 range of 3-90°
and the ratio of Kα-2 and Kα-1 was 0.5 (k, equipment constant).
The data was collected using X’Pert data collector and X’Pert high
score plus processing software in the form of a chart of the Bragg
angle (2θ) vs. intensity (counts per second), and a detailed table
containing information on peak intensity counts, d value (Å), full
width half maximum (FWHM) (°2θ), relative intensity (%), and
area (cts*°2θ). The crystallite size (G) was calculated by using the
Scherrer equation (3) as follows:
G=kλ/(bCosθ) (3)
Where, k is the equipment constant (0.5), λ is the X-ray
wavelength (0.154nm); b in radians is the full width at half of the
peaks and θ is the corresponding Bragg angle.
Percent change in crystallite size (G) of sodium molybdate was
calculated using following equation 4:

Where, GControl and GTreated are the crystallite size of the control and the Biofield Energy Treated sodium molybdate samples, respectively.
Thermal Gravimetric Analysis (TGA) / Differential Thermogravimetric Analysis (DTG): TGA/DTG thermograms of control and the Biofield Energy Treated sodium molybdate samples were obtained using TGA Q500 themoanalyzer apparatus, USA under dynamic nitrogen atmosphere (50mL/min). It involves the heating rate of 10 ºC/min from 25 °C to 800 °C and uses platinum crucible [35]. In TGA analysis, the weight loss in gram as well as percent loss for each step was recorded with respect to the initial weight of the sample. Later on, in DTG analysis, the onset, endset, peak temperature and integral area for each peak was recorded. The percent change in weight loss (W) was calculated using following equation 5:

Where, WControl and WTreated are the weight loss of the control and the Biofield Energy Treated samples, respectively.
Also, the percent change in maximum thermal degradation temperature (Tmax) (M) was calculated using following equation 6:

Where, MControl and MTreated are the Tmax values of the control and the Biofield Energy Treated samples, respectively.
Differential Scanning Calorimetry (DSC): The DSC analysis of the samples was performed using DSC Q2000 differential scanning calorimeter, USA under the dynamic nitrogen atmosphere with flow rate of 50 mL/min. For analysis, 2-4 mg sample was weighed and sealed in Aluminum pans. Further, it was equilibrated at 30 °C and heated up to 450 °C at the heating rate of 10 °C/min under Nitrogen gas as purge atmosphere [35]. The value for onset, end set, peak temperature, peak height (mJ or mW), peak area, and change in heat (J/g) for each peak was recorded. Later on, the percent change in melting temperature (T) of the control and the Biofield Energy Treated samples was calculated using following equation 7:

Where, TControl and TTreated are the melting temperature of the control and the Biofield Energy Treated sodium molybdate samples, respectively.
Also, the percent change in the latent heat of fusion (ΔH) was calculated using following equation 8:

Where, ΔHControl and ΔHTreated are the latent heat of fusion of the control and treated sodium molybdate, respectively.
Ultraviolet-Visible Spectroscopy (UV-Vis) analysis: The UV-Vis spectral analysis of the control and the Biofield Energy Treated sodium molybdate samples was carried out using Shimadzu UV-2400PC SERIES with UV Probe (Shimadzu, JAPAN). The spectrum was recorded in the wavelength range of 190-800nm using 1 cm quartz cell having a slit width of 0.5nm. The absorbance spectra (in the range of 0.2 to 0.9) and wavelength of maximum absorbance (λmax) were recorded.
Fourier transform infrared (FT-IR) spectroscopy: FT-IR spectroscopy of sodium molybdate was performed on Spectrum ES Fourier transform infrared spectrometer (Perkin Elmer, USA) by using pressed KBr disk technique with the frequency array of 400-4000cm-1. The technique uses ~2mg of control sample and about 300mg of KBr as the diluent to form the pressed disk followed by running the sample in the spectrometer. The same procedure was used for the Biofield Energy Treated sample.
Result and Discussion
Particle size analysis (PSA)
The PSA data revealed the particle sizes (i.e., d10, d50 and d90) of the control and the Biofield Energy Treated sodium molybdate, and the results are presented in Table 1. From the data, it was observed that the particle sizes at d10, d50, d90, and D(4,3) value of the Biofield Energy Treated sample showed a significant increase by 7.18%, 7.21%, 6.93% and 7.53%, respectively, as compared to the control sample. Some previous research reported that particle size may increase along with elevation in thermal energy. Hence, it might be assumed that the Biofield Energy Treatment may act by reducing the thermodynamically driving force that ultimately causes the decrease in nucleus densities and enhances the particle size [36,37]. The analysis also investigated the surface area of both samples and the results are shown in the Table 1. It represents that the surface area of the Biofield Energy Treated sample was observed as 94.26m2/kg, which was 5.65% less as compared to the surface area of the control sample (99.90m2/kg). The reason behind reduced surface area may be due to the increase in particle size of the treated sample after the Biofield Energy Treatment as compared to the control sample. The studies reported the use of increased particle size in the enhancement of the appearance, shape and flowability of the compound [38,39]. Thus, the Biofield Energy Treatment may be used to improve the powder flowability of sodium molybdate.
Table 1: Particle size distribution of the control and the Biofield Energy Treated sodium molybdate d10, d50, and d90: particle diameter corresponding to 10%, 50%, and 90% of the cumulative distribution, D(4,3) : the average mass-volume diameter, SSA : the specific surface area; *denotes the percentage change in the particle size distribution of the Biofield Energy Treated sample with respect to the control sample.

Powder X-ray diffraction (PXRD) analysis
The PXRD diffractograms of control and the Biofield Energy Treated samples of sodium molybdate are given in Figure 1 that showed very sharp peaks, which represents that both samples were of crystalline nature. Also, the PXRD data including Bragg angle (2θ), relative peak intensity (%), and crystallite size (G) for the control and the Biofield Energy Treated sodium molybdate are analyzed from the diffractograms and presented in Table 2. The crystallite size was calculated using Scherer equation. The data revealed that the crystallite sizes of the Biofield Energy Treated sample at 2θ equal to nearly 12.8°, 14.9°, 18.6°, 24.6°, 25.8°, 33.4°, and 54.9° (Table 2), entry 1,2,3,6,7,13, and 20) remained unaltered. However, the crystallite sizes of the control and the Biofield Energy Treated samples of sodium molybdate at 2θ equal to nearly 28.2°, 29.9°, 54.1°, and 69.6° (Table 2), entry 9,11,19, and 21) were significantly decreased from 16.66% to 30.29% with respect to the control sample.
Figure 1:PXRD diffractograms of the control and the biofield energy treated sodium molybdate.
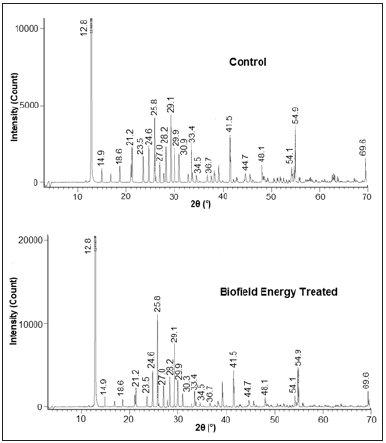
Table 2: PXRD data for the control and the Biofield Energy Treated sodium molybdate.
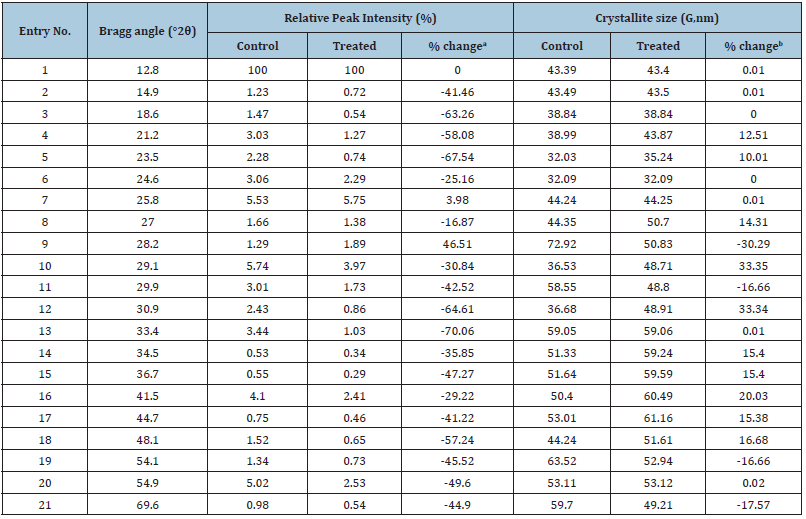
adenotes the percentage change in the relative intensity of the Biofield Energy Treated sample with respect to the control sample, bdenotes the percentage change in the crystallite size of the Biofield Energy Treated sample with respect to the control sample.
Consequently, at position 2θ equal to nearly 21.2°, 23.5°, 27.0°,
29.1°, 30.9°, 34.5°, 36.7°, 41.5°, 44.7° and 48.1° (Table 2), entry 4,
5, 8, and 14-18), the crystallite sizes of the Biofield Energy Treated
sodium molybdate were significantly increased in the range of 10%
to 33.35% as compared to the control sample. Also, the average
crystallite size of the Biofield Energy Treated sample was increased
by 2.73% in comparison to the control sample. It is assumed
that the Biofield Energy might be responsible for inducing the
movement of crystallite boundaries, which causes crystal growth
and thereby increased crystallite size [40]. The PXRD diffractogram
of both samples showed highest peak intensity (100%) at Bragg’s
angle (2θ) equal to 12.8° (Table 2, entry 1), whereas most of the
other peaks of the Biofield Energy Treated sample’s diffractogram
were of less intensity as compared to control sample.
The relative intensity of various peaks of the Biofield Energy
Treated sample was found to be decreased from 16.87% to 70.06%
in comparison to the control sample. This reduction in intensity
suggests that the crystallinity of the Biofield Energy Treated
sample might be reduced as compared to control. The possible
reason behind this alteration might be that the biofield treatment
may create disturbance in the regular pattern of the atoms, thereby
causing less crystallinity in the Biofield Energy Treated sample as
compared to control. Moreover, the relative intensity of peaks at
2θ equal to 25.8° and 28.2° are significantly increased by 3.98%
and 46.51%, respectively in the Biofield Energy Treated sample
as compared to the control sample, which might happen as the
molecules of neighboring plane got oriented in this plane after
the Biofield Energy Treatment. The PXRD analysis revealed an
alteration in the crystal morphology of treated sodium molybdate
as compared to the control sample. The crystal morphology, pattern,
and crystallite size, etc. of any compound plays vital role in various
parameters such as, solubility, dissolution, and bioavailability.
Thus, the Biofield Energy Treatment might be considered a useful
approach in altering the bioavailability of sodium molybdate.
Thermal Gravimetric Analysis (TGA) / Differential Thermogravimetric Analysis (DTG)
The TGA/DTG analysis revealed the thermal stability of the samples through the thermograms of the control and the Biofield Energy Treated sodium molybdate (Figures 2 & 3). Also, the TGA and DTG data for the control and the Biofield Energy Treated samples are given in the Tables 3 & 4. The TGA thermograms of both samples, i.e., control and the Biofield Energy Treated sodium molybdate show three steps thermal degradation (Table 3). The data revealed that in the 1st and 2nd step of degradation, the percentage weight loss was increased by 0.47% and 61.34% in the Biofield Energy Treated sodium molybdate, respectively; while it was significantly reduced by 87.02% in the 3rd step of degradation as compared to the control sample (Table 3). Moreover, the overall weight loss after thermal degradation in the Biofield Energy Treated sample was decreased by 1.94%, compared with the control sample. It revealed that the Biofield Energy Treated sample is thermally more stable as compared to the control sample.
Figure 2:TGA thermograms of the control and the biofield energy treated sodium molybdate.
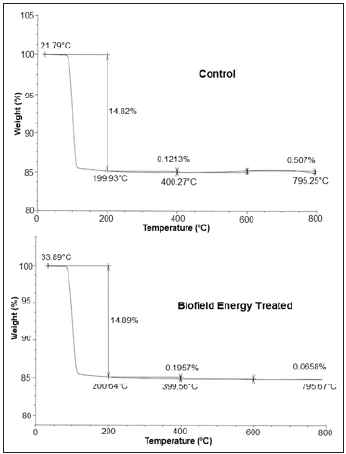
Figure 3:DTG thermograms of the control and the biofield energy treated sodium molybdate.
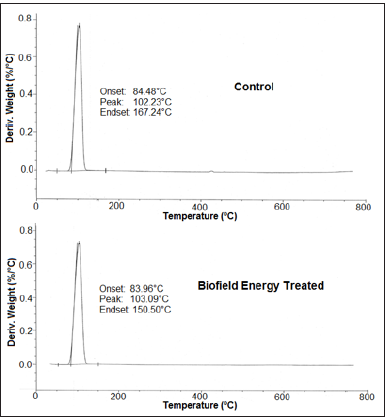
Table 3: Thermal degradation steps of the control and the Biofield Energy Treated sodium molybdate.

*denotes the percentage change in the weight loss of the Biofield Energy Treated sample with respect to the control sample.
Besides, the DTG thermogram of the control sample shows maximum thermal degradation temperature (Tmax) at 102.23 °C; while for the Biofield Energy Treated sample, slight increase in temperature was observed, as the thermogram shows Tmax at 103.09 °C (Table 4). Nevertheless, the onset and end-set degradation temperatures for the Biofield Energy Treated sample were slightly less than the control sample. The data shows onset and end-set degradation temperature for the Biofield Energy Treated sample at 83.96 °C and 150.50 °C, as compared to the control, which shows these temperatures at 84.48 °C and 167.24 °C, respectively. The DTG analysis indicated that the maximum degradation temperature of the Biofield Energy Treated Sodium Molybdate was slightly improved (0.84%) as compared to the control. Overall, TGA/DTG analysis reported that the thermal stability of the Biofield Energy Treated Sodium Molybdate was slightly improved as compared to the control sample. Some researchers reported the alteration in thermal stability along with the change in particle size of the sample [41]. Thus, it is assumed that the alteration in particle size of the Biofield Energy Treated sample may be responsible for the increase in thermal stability as compared to the control sample.
Table 4: Derivative thermal degradation steps of the control and the Biofield Energy Treated samples of sodium molybdate.

Tonset: Onset temperature, Tmax: Maximum thermal degradation temperature, Tendset: Endset temperature, *denotes the percentage change of the Biofield Energy Treated sample with respect to the control sample.
Differential Scanning Calorimetry (DSC) analysis
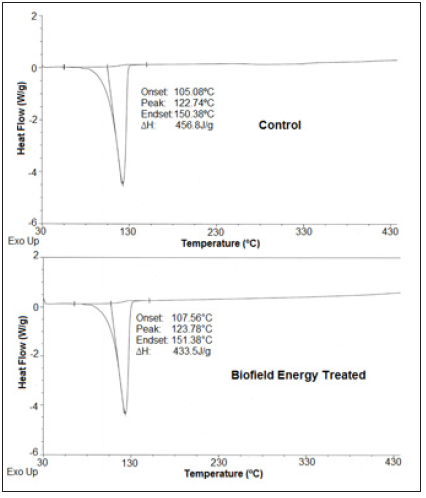
The DSC thermograms of the control and the Biofield Energy Treated samples of sodium molybdate are shown in Figure 4. The thermograms of both samples i.e., control and the Biofield Energy Treated sample showed sharp endothermic inflection at 122.74 and 123.78 ºC, respectively, which might be due to the melting of the sodium molybdate dihydrate. The data analysis (Table 5) suggested that there was a slight alteration (0.85%) in the peak melting temperature of the Biofield Energy Treated sample as compared with the control sample. Consequently, the onset and end-set temperature of the treated sample also showed the significant increase i.e., 2.36% and 0.66%, respectively, as compared to the control sample. Besides, the latent heat of fusion (ΔH) of the control and the Biofield Energy Treated samples was found as 456.8 and 433.5 J/g, respectively, which revealed a significant decrease (5.1%) in ΔH in the Biofield Energy Treated sodium molybdate as compared to the control (Table 5). The overall result indicated that the thermal stability of treated sodium molybdate was significantly increased after the Biofield Energy Treatment, which might be due to increase in particle size of the Biofield Energy Treated sodium molybdate.
Table 5: Comparison of DSC data between the control and Biofield Energy Treated sodium molybdate.

Tonset: Onset melting temperature, Tpeak: Peak melting temperature, Tendset: Endset melting temperature, ΔHfusion: Latent heat of fusion, *denotes the percentage change of Biofield Energy Treated sample with respect to the control sample.
Figure 4:DSC thermograms of the control and the biofield energy treated sodium molybdate.
Ultraviolet-visible spectroscopy (UV-Vis) analysis
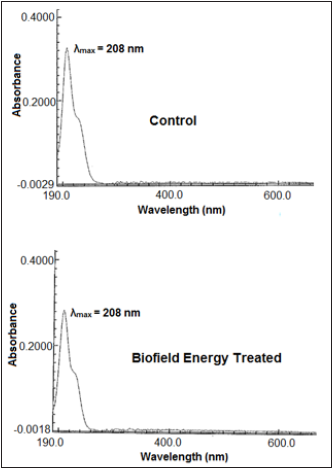
The UV-visible spectra of both the control and Biofield Energy Treated sodium molybdate samples are shown in Figure 5. The UV spectra of both, the control and the Biofield Energy Treated samples showed the maximum absorbance (λmax) at 208nm, thus, there is no significant alteration in the absorbance maxima between control and the Biofield Energy Treated sample. It shows that there might not be any significant change in the electronic transitions between highest occupied molecular orbital and lowest unoccupied molecular orbital, induced by the Biofield Energy Treatment.
Figure 5:UV-vis spectra of the control and the biofield energy treated sodium molybdate.
Fourier transform infrared (FT-IR) spectroscopy
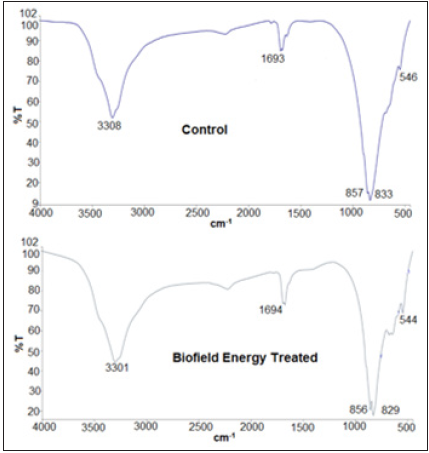
The FT-IR spectra of control and the Biofield Energy Treated samples of sodium molybdate are given in Figure 6. The FT-IR spectra of both, the control and the Biofield Energy Treated sodium molybdate showed the clear stretching and bending peaks in the functional group and fingerprint region. The broad peaks in both control and the Biofield Energy Treated samples’ spectra were observed at 3308 and 3301cm-1, respectively that may be due to O-H stretching. Moreover, the Mo-O stretching was observed at 833 and 857cm-1 in the control sample and at 829 and 856cm-1 in the Biofield Energy Treated sample. The vibrational frequencies in the fingerprint region of the Biofield Energy Treated and control samples were remained same. The FT-IR spectra were well supported by the reported literature [42] and did not display any changes in the vibrational frequencies. The overall FT-IR analysis did not reveal any alteration in the structural properties of the Biofield Energy Treated sample as compared to the control sample.
Figure 6:FT-IR spectra of the control and the biofield energy treated sodium molybdate.
Conclusion
The overall analysis concluded that the Trivedi Effect®- Consciousness Energy Treatment has the significant impact on the physical as well as thermal properties of sodium molybdate. The particle size analysis revealed a significant increase in the values of d10, d50, d90, and D(4,3) by 7.18%, 7.21%, 6.93% and 7.53%, respectively in comparison to the control sample. The surface area analysis exhibited a remarkable decrease in surface area of the Biofield Energy Treated sample by 5.65% as compared to the control sample. Such changes may occur due to the Biofield Energy Treatment, which might reduce the thermodynamically driving force that ultimately enhances the particle size and thereby reduces the surface area of the Biofield Energy Treated sodium molybdate sample. PXRD analysis revealed that the relative peak intensities and crystallite sizes of treated sample changed from -70.06% to 46.51% and -30.29% to 33.35%, respectively along with 2.73% increase in average crystallite size compared with the control sample. The alterations in the relative peak intensities and crystallite size of the Biofield Energy Treated sodium molybdate suggested the disturbance in the regular pattern of the atoms and crystallinity that might occur due to the Biofield Energy Treatment. Additionally, the TGA/DTG analysis revealed the decrease in total weight loss of the Biofield Energy Treated sample by 1.94% and increase in Tmax by 0.84% as compared with the control sample. The thermal analysis showed a slight increase in the thermal stability of the treated sodium molybdate that may occur due to increase in the particle size of the sample after the Biofield Energy Treatment. The DSC analysis also represents slight alteration in the melting point of the Biofield Energy Treated sample along with 5.1% decrease in ΔH than the control sample. It indicates the increased thermal stability of the Biofield Energy Treated sodium molybdate after the Biofield Energy Treatment. Overall, the current study showed the significant impact of the Trivedi Effect®-Consciousness Energy Treatment on the physical and thermal properties of sodium molybdate. The Biofield Energy Treated sample might possess new polymorphic form along with increased crystallite and particle size and reduced surface area. On the basis of this study, it is expected that the Trivedi Effect® may be used to enhance the thermal stability along with various other properties of drugs that may help in designing a better nutraceutical and/or pharmaceutical formulations with enhanced powder flowability, stability and safety profile. It may help in providing better therapeutic response against various diseases such as Thyroiditis, Hepatitis, Crohn's disease, Rheumatoid Arthritis, Type 1 Diabetes, impotency, aging-related diseases mood swings, migraines, obsessive/compulsive behavior and panic attacks, stress-related disorders, lack of motivation, osteoporosis, inflammatory diseases, cardiovascular disease, immunological disorders, chronic infections and much more.
Acknowledgement
The authors are grateful to GVK Biosciences Pvt. Ltd, Trivedi Science, Trivedi Global, Inc., Trivedi Testimonials, and Trivedi Master Wellness for their assistance and support during this work.
References
- Sardesai VM (1993) Molybdenum: an essential trace element. Nutr Clin Pract 8(6): 277-281.
- Trumbo P, Yates AA, Schlicker S, Poos M (2001) Dietary reference intakes: Vitamin A, vitamin K, arsenic, boron, chromium, copper, iodine, iron, manganese, molybdenum, nickel, silicon, vanadium, and zinc. J Am Diet Assoc 101(3): 294-301.
- Chan S, Gerson B, Subramaniam S (1998) The role of copper, molybdenum, selenium, and zinc in nutrition and health. Clin Lab Med 18(4): 673-685.
- Westerfeld WW, Richert DA (1949) A new dietary factor related to xanthine oxidase. Science 109(2821): 68.
- Chu TS (1993) Hereditary xanthinuria: report of two cases. J Formos Med Assoc 92(5): 478-481.
- Percy AK, Mudd SH, Irreverre F, Laster L (1968) Sulfite oxidase deficiency: Sulfate esters in tissues and urine. Biochem Med 2(3): 198-208.
- Kisker C, Schindelin H, Rees DC (1997) Molybdenum-cofactor-containing enzymes: structure and mechanism. Annu Rev Biochem 66: 233-267.
- Kisker C, Schindelin H, Baas D, Retey J, Meckenstock RU, et al. (1998) A structural comparison of molybdenum cofactor-containing enzymes. FEMS Microbiol Rev 22(5): 503-521.
- Purchase R (2013) The treatment of Wilson's disease, a rare genetic disorder of copper metabolism. Sci Prog 96(1): 19-32.
- Wills MR, Phillips JB, Day RC, Bateman EC (1972) Phytic acid and nutritional rickets in immigrants. The Lancet 299(7754): 771-773.
- Hammerschlag R, Levin M, McCraty R, Bat N, Ives JA, et al. (2015) Biofield physiology: a framework for an emerging discipline. Glob Adv Health Med 4: 35-41.
- Warber SL, Cornelio D, Straughn, J, Kile G (2004) Biofield energy healing from the inside. J Altern Complement Med 10(6): 1107-1113.
- Trivedi MK, Branton A, Trivedi D, Nayak G, Shettigar H, et al. (2015) Antibiogram of multidrug-resistant isolates of Pseudomonas aeruginosa after Biofield Treatment. J Infect Dis Ther 3: 244.
- Trivedi MK, Branton A, Trivedi D, Nayak G, Mondal SC, et al. (2015) Antibiogram of biofield-treated Shigella boydii: Global burden of infections. Science Journal of Clinical Medicine 4: 121-126.
- Koithan M (2009) Introducing complementary and alternative therapies. J Nurse Pract 5(1): 18-20.
- Rogers M (1989) Nursing: A science of unitary human beings. Conceptual Models for Nursing Practice. Norwark: Appleton & Lange, USA.
- Barnes PM, Bloom B, Nahin RL (2008) Complementary and alternative medicine use among adults and children: United States, 2007. Natl Health Stat Report 343: 1-19.
- Trivedi MK, Patil S, Shettigar H, Bairwa K, Jana S (2015) Effect of biofield treatment on spectral properties of paracetamol and piroxicam. Chem Sci J 6: 98.
- Trivedi MK, Tallapragada RM, Branton A, Trivedi D, Nayak G, et al. (2015) Spectral and thermal properties of biofield energy treated cotton. American Journal of Energy Engineering 3: 86-92.
- Trivedi MK, Branton A, Trivedi D, Shettigar H, Bairwa K, et al. (2015) Fourier transform infrared and ultraviolet-visible spectroscopic characterization of biofield treated salicylic acid and sparfloxacin. Nat Prod Chem Res 3: 186.
- Trivedi MK, Branton A, Trivedi D, Nayak G, Bairwa K, et al. (2015) Spectroscopic characterization of disodium hydrogen orthophosphate and sodium nitrate after biofield treatment. J Chromatogr Sep Tech 6: 282.
- Trivedi MK, Branton A, Trivedi D, Nayak G, Plikerd WD, et al. (2017) A systematic study of the biofield energy healing treatment on physicochemical, thermal, structural, and behavioral properties of magnesium gluconate. International Journal of Bioorganic Chemistry 2: 135-145.
- Trivedi MK, Branton A, Trivedi D, Nayak G, Wellborn BD, et al. (2017) Characterization of physicochemical, thermal, structural, and behavioral properties of magnesium gluconate after treatment with the Energy of Consciousness. International Journal of Pharmacy and Chemistry 3: 1-12.
- Trivedi MK, Branton A, Trivedi D, Nayak G, Singh R, et al. (2015) Characterization of physical, spectral and thermal properties of biofield treated resorcinol. Organic Chem Curr Res 4: 146.
- Trivedi MK, Branton A, Trivedi D, Nayak G, Sethi KK, et al. (2016) Isotopic abundance ratio analysis of biofield energy treated indole using gas chromatography-mass spectrometry. Science Journal of Chemistry 4(4): 41-48.
- Trivedi MK, Branton A, Trivedi D, Nayak G, Panda P, et al. (2016) Evaluation of the isotopic abundance ratio in biofield energy treated resorcinol using gas chromatography-mass spectrometry technique. Pharm Anal Acta 7: 481.
- Trivedi MK, Patil S, Tallapragada RM (2013) Effect of biofield treatment on the physical and thermal characteristics of vanadium pentoxide powders. J Material Sci Eng S 11: 001.
- Trivedi MK, Tallapragada RM, Branton A, Trivedi D, Nayak G, et al. (2015) The potential impact of biofield energy treatment on the atomic and physical properties of antimony tin oxide nanopowder. American Journal of Optics and Photonics 3(6): 123-128.
- Trivedi MK, Branton A, Trivedi D, Nayak G, Gangwar M, et al. (2016) Molecular analysis of biofield treated eggplant and watermelon crops. Adv Crop Sci Tech 4: 208.
- Trivedi MK, Branton A, Trivedi D, Nayak G, Mondal SC, et al. (2015) Evaluation of biochemical marker-glutathione and DNA fingerprinting of biofield energy treated Oryza sativa. American Journal of BioScience 3(6): 243-248.
- Smith DM, Trivedi MK, Branton A, Trivedi D, Nayak G, et al. (2017) Skin protective activity of consciousness energy healing treatment based herbomineral formulation. Journal of Food and Nutrition Sciences 5(3): 86-95.
- Dodon J, Trivedi MK, Branton A, Trivedi D, Nayak G, et al. (2017) The study of biofield energy treatment based herbomineral formulation in skin health and function. American Journal of BioScience 5(3): 42-53.
- Trivedi MK, Mohan TRR (2016) Biofield energy signals, energy transmission and neutrinos. American Journal of Modern Physics 5(6): 172-176.
- Trivedi MK, Branton A, Trivedi D, Nayak G, Lee AC, et al. (2017) A comprehensive analytical evaluation of the Trivedi Effect® -Energy of Consciousness Healing Treatment on the physical, structural, and thermal properties of zinc chloride. American Journal of Applied Chemistry 5(1): 7-18.
- Trivedi MK, Branton A, Trivedi D, Nayak G, Plikerd WD, et al. (2017) A systematic study of the biofield energy healing treatment on physicochemical, thermal, structural, and behavioral properties of iron sulphate. International Journal of Bioorganic Chemistry 2(3): 135-145.
- Rashidi AM, Amadeh A (2009) The effect of saccharin addition and bath temperature on the grain size of nanocrystalline nickel coatings. Surf Coat Technol 204(3): 353-358.
- Katayama M (1956) The crystal structure of an unstable form of chloroacetamide. Acta Crystallogr 9(12): 986-991.
- Buckton G, Beezer AE (1992) The relationship between particle size and solubility. Int J Pharmaceutics 82(3): R7-R10.
- Mosharrof M, Nystrom C (1995) The effect of particle size and shape on the surface specific dissolution rate of microsized practically insoluble drugs. Int J Pharm 122(1-2): 35-47.
- Trivedi MK, Nayak G, Tallapragada RM, Patil S, Latiyal O, et al. (2015) Effect of biofield treatment on structural and morphological properties of silicon carbide. J Powder Metall Min 4:132.
- Zhang M, Efremov MY, Schiettekatte F, Olson EA, Kwan AT, et al. (2000) Size-dependent melting point depression of nanostructures: Nanocalorimetric measurements. Phys Rev B 62: 10548.
- Smith AL (1982) The coblentz society desk book of infrared spectra. In: Carver CD (Ed.), The Coblentz Society Desk Book of Infrared Spectra. (2nd edn), The Coblentz Society: Kirkwood, USA.
© 2021 Snehasis Jana. This is an open access article distributed under the terms of the Creative Commons Attribution License , which permits unrestricted use, distribution, and build upon your work non-commercially.
 a Creative Commons Attribution 4.0 International License. Based on a work at www.crimsonpublishers.com.
Best viewed in


.jpg)


 Editorial Board Registrations
 Submit your Article
 Refer a Friend
 Advertise With Us
.jpg)


.jpg)


.bmp)
.jpg)
.png)
.jpg)


.jpg)


.png)

.png)


.png)


