
- About Us
- Information
-

The Author ensures that the research has been conducted responsibly and ethically with adherence to all relevant regulations. read more..
- For Authors
- For Reviewer
- Manuscript Guidelines
- Membership
- Publication Ethics
-
- Journals
- Reprints
- e-Books
- Videos
- Policies
- Contact Us
 COVID-19
- Submissions


Full Text
Novel Research in Sciences
A Simple Infection Model for Foliar Pathogens of Wheat
I Vagelas*
Department of Agriculture Crop Production and Rural Environment, University of Thessaly, Greece
*Corresponding author:I Vagelas, Department of Agriculture Crop Production and Rural Environment, Greece
Submission: February 11, 2021;Published: March 09, 2021
.jpg)
Volume6 Issue2March, 2021
Abstract
This short research presents briefly a generic model developed for the wheat's infection by foliar pathogens Zymoseptoria tritici and Parastagonospora nodorum. The model is based upon temperature response functions with the interaction between temperature and wetness data.
Keywords: Crop Models, Disease Forecasting Models, Septoria tritici blotch, Septoria nodorum blotch of wheat
Theoretical Review
Crop models have proved a key tool in assessing crop growth and development and have been influenced by crop management and environmental conditions. Crop simulation models have a long history, started as farm optimization models in the 1950 -the 60s and established in the 1960s as new methods for agricultural production [1]. In general crop, models are mathematical algorithms that can simulate information of ecophysiology and agronomy in a way to predict crop growth and development. As crop production is affected seasonal and climatic change needs to combine in their framework the complexity of temperature, rainfall patterns, and the occurrence of abiotic and biotic stresses. Many authors have evaluated these aspects in wheat crop models, for example, Ceres-Wheat, N wheat, CROPSIM-Wheat, and APSIM-Wheat to described performance of early, optimum, and late sown wheat associated with temperatures [2]. Many other models were used as wheat simulation models e.g., DSSAT-CERES-Wheat, DSSAT-N wheat, Wheat Grow, and APSIM Wheat, to quantify and simulate the responses of wheat grain quality under critical growth stages [3] or were used to understanding wheat yield reduction under extreme weather [4], [1].
Besides crop models emphasis was given to disease forecasting models such as i) the model for late blight of potato (Phytophthota infestans) started in the 1990s and ii) the model for early blight (Alternaria solani) started in 1999. Both were biological forecasting models, emphasize the weather conditions that favor disease development and related to the complete life cycle of the fungus [1].
For foliar diseases of wheat: leaf rust, powdery mildew, septoria tritici blotch, and tan spot many authors used models containing both abiotic and biotic factors. Abiotic factors: temperature, relative humidity, total rainfall, are using in the wheat-growing season as predictor variables for the model in order i) to find the most predominant pathogen, ii) for disease scoring and iii) for fungicide timing. In our view, for the wheat crop, the third outcome (fungicide timing) is a more complex part of the model combining data for, i) the upper crop canopy area (leaf layer), ii) the timing of disease development and iii) the efficacy of fungicide treatment [1]. In our view, those aspects are important for making pesticide decisions during the growing season [1]. The same can be said for the estimation of infection of other foliar pathogens of wheat such as Parastagonospora nodorum.
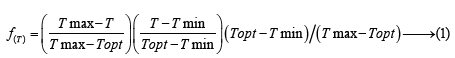
As the temperature is among the most single factor determining i) plant growth and ii) critical disease intensity at a given temperature, we used Yin’s [5] function (equation 1), to estimate the infection periods of Septoria Disease of Wheat (SDW) caused by (Z. tritici and P. nodorum). The model (Figure 1) uses the temperature response function of Yin et al [5] and the function uses for pathogen’s cardinal temperature infection as presented by Magarey et al [6].
We modeled SDW infection risk by running equation 1, with a climate dataset (2014, from central Greece). Our thermal model (Eq 1) uses the three cardinal temperatures (T min T, Tmax) and fungal optimum temperature (Topt) for two days wet periods (Figure 1). Because Septoria spp., requires a moist leaf surface for successful infection and spread throughout the wheat crop canopy, the frequency of very wet days (>2mm rainfall) was recorded (Figure 1). We compared the output of our thermal model with observed SDW infection data (Figure 1). Four wheat fields, from central Greece, were examined and scored for SDW infection as 0= no field contained the disease, 1= 10% of SDW infection, 2= 20% of SDW infection, 3= 30% of SDW infection, ……, and 1= 10% of SDW infection were observed, respectively.
Figure 1:Comparison of model SDW output with observed STB disease data.

We concluded that our model could predict wheat infection caused by Z. tritici and P. nodorum, complex, successfully, compared with our original observations (Figure 1). In general, the model was able to predict the SDW infection occur during tillering (late February), stem elongation (March), flag leaf, booting (late April), and ripening (May) stage of wheat (Figure 1).
Based on data presented in Figure 1, a typical program for control of the Septoria disease complex of wheat could start at tillering stage (late February), to limit the disease on the lower leaves. However, the flag leaf or booting stage (late April), is the most critical to keep upper leaves free of disease and so optimize yield and quality.
References
- Ioannis Vagelas (2021) Latest application technology in wheat crop simulation and disease prediction models. Mod Concep Dev Agrono 7(5) 000674. 2021.
- Hussain J, Khaliq T, Ahmad A, Akhtar J (2018) Performance of four crop model for simulations of wheat phenology, leaf growth, biomass and yield across planting dates. Plos One 13(6): e0197546.
- Osman R, Zhu Y, Ma W, Zhang D, Ding Z, et al. (2020) Comparison of wheat simulation models for impacts of extreme temperature stress on grain quality. Agricultural and Forest Meteorology 288-289: 107995.
- Shew AM, Tack JB, Nalley LL, Chaminuka P (2020) Yield reduction under climate warming varies among wheat cultivars in South Africa. Nature Communications 11(1): 4408.
- Yin X, Kropff MJ, McLaren G, Visperas RM (1995) A nonlinear model for crop development as a function of temperature. Agricultural and Forest Meteorology 77(1-2): 1-16.
- Magarey RD, Sutton TB, Thayer CL (2005) A simple generic infection model for foliar fungal plant pathogens. Phytopathology 95(1): 92-100.
© 2021 I Vagelas. This is an open access article distributed under the terms of the Creative Commons Attribution License , which permits unrestricted use, distribution, and build upon your work non-commercially.
Editor In Chief


.jpg)


Signup for Newsletter

Quick Links
 Editorial Board Registrations
 Submit your Article
 Refer a Friend
 Advertise With Us
Our Recent Edition

.jpg)


Top Editors


.jpg)


.bmp)
.jpg)
.png)
.jpg)


.jpg)


.png)

.png)


.png)


Financial Support

Sponsors

Latest e-Books

Latest Video

 a Creative Commons Attribution 4.0 International License. Based on a work at www.crimsonpublishers.com.
Best viewed in
a Creative Commons Attribution 4.0 International License. Based on a work at www.crimsonpublishers.com.
Best viewed in