
- About Us
- Information
-

The Author ensures that the research has been conducted responsibly and ethically with adherence to all relevant regulations. read more..
- For Authors
- For Reviewer
- Manuscript Guidelines
- Membership
- Publication Ethics
-
- Journals
- Reprints
- e-Books
- Videos
- Policies
- Contact Us
 COVID-19
- Submissions


Full Text
Novel Research in Sciences
Virus Entropic Characteristics
Korablev GA
Doctor of Science in Chemistry, Russia
*Corresponding author: Korablev GA, Doctor of Science in Chemistry, Professor of Physics at Izhevsk State Agricultural Academy, Russia
Submission: August 07, 2020;Published: November 25, 2020
.jpg)
Volume5 Issue3November, 2020
Abstract
It is demonstrated that according to the first law of thermodynamics the equality of entropic and negentropic components is the condition of resonance stationary state of systems. The initial nomograms of entropic and negentropic characteristics for many processes and phenomena in nature, engineering and physical chemistry are given. The entopic technique for forming fractal systems is presented. The coronavirus scenario in Russia is analyzed. The accuracy of forecast regarding the maximum number of diseases at the given moment and plateau duration is 96.5% and 98.5%, respectively
Keywords: Coronavirus; Entropy; Negentropy; Nomograms; Stationary state; Forecasts; Fractals
Introduction
The new coronavirus goes across the globe. The most developed countries were not able to rationally confront it. Apparently, the science is not sufficiently aware of some fundamental consistencies regulating such process, the same as with other similar phenomena. Thus, many forecasts regarding the duration of new coronavirus stages emerged: from the most optimistic ones to different varieties of pessimistic ones [1]. But the time will demonstrate which of them will be more reliable. During the recent decades the modern civilization did a lot to annihilate the nature. The atmosphere, water resources and even oceans are being polluted. Electric, magnetic, chemical-biological and different technological systems uncontrollably affect the planet. Therefore, many cataclysms, including epidemics, are the nature response to it. The earth needs rehabilitation. In this investigation the notion of entropy for the analysis of structural interactions in macro and microsystems applicable to viral etiology is used.
Initial Data
After analyzing the first law of thermodynamics, we have the following [2]:
- In the systems in which the interaction proceeds along the potential gradient (positive work), the resultant potential energy is found based on the principle of adding reciprocals of corresponding values of subsystems. This is the corpuscular process, in which entropy can serve as the theoretical concept.
- In the systems in which the interactions proceed against the potential gradient (negative work) the algebraic addition of their masses, as well as the corresponding energies of subsystems is performed. This is the wave process, in which negentropy can serve as the theoretical concept.
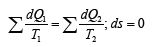
- The resonance stationary state of the systems is fulfilled under the condition of equality of degrees of their corpuscular and wave interactions. The entropy products in stationary state are completely compensated by the negentropy flow. Thus, “in the circular process in the thermal machine the system entropy increase due to the incoming heat is completely compensated by the entropy decrease during heat emission, and total entropy value equals zero” [3]:
These rules are applied and revealed in many micro- and macrosystems.
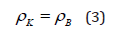
As applicable to corpuscular-wave processes, the condition of stationary state is the condition of equality of degrees of their structural interactions:
Mathematically and graphically (by nomograms) the stationary state in microsystems is found by the following equation:
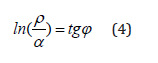
Where relative difference of energy parameters of particles (%); = 54°44´-geodesic angle.
The geodesic angle numerically defines the ratio of two legs of the right triangle whose values characterize energy dependencies through axial and circumferential stresses in the system with corpuscular-wave processes. This condition corresponds to the most optimal technological options and is widely present in nature, as well as in fractal systems. Thus, thousands of years ago it was found: “All phenomena of the world around us, including a human and nature, are interpreted by Chinese medicine as the interaction between two origins “Yin” and “Yang” representing opposite aspects of unified reality” [4]. From the point of these notions, physiotherapy and reflex therapy can be considered as the technique for equalizing the potentials of two manifestations of energy origins, which, according to modern notions, are entropy and negentropy (par. 3 of the initial provisions).
Entropy of Structural Interactions
In statistic thermodynamics the entropy (S) of the closed and equilibrious system equals the logarithm of the probability of its definite microstate:
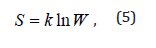
where
W: Thermodynamic probability which equals the number of microstates corresponding to the given microstate;
K: Boltzmann’s constant.
The notion of entropy results from the second law of thermodynamics as the criterion of the process directedness and degree of the system disarray. Applying reliable experimental data, the dependence nomogram [5,6] of the degree of structural interactions on the coefficient , the same for a wide class of structures, was obtained (Figure 1). This approach allowed assessing the degree and direction of structural interactions of phase-formation, isomorphism and solubility processes in multiple systems, including the molecular ones [7,8]. This type of nomogram and its ambidextrous variant (Figure 2) are widely applied to characterize many processes and phenomena in nature, engineering and even in economy [9,10]. Lorentz curve is demonstrated in Figure 3 as an example [11].
Nomogram 1 can be demonstrated [5] as the logarithmic dependence:
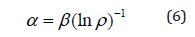
where coefficient
-The constant value for the given class of structures. Thus, coefficient is reversely proportional to the logarithm of the degree of structural interactions and therefore can be characterized as the entropy of spatial-energy interactions of atomic-molecular structures: . In Lorentz curve [11] the space-time graphic dependence (Figure 3) of the velocity parameter (θ) on the velocity itself , similar to nomogram 2, is given.
Figure 1: Nomogram of structural interaction degree dependence (ρ) on coefficient α.

Figure 2: Nomogram of structural interaction degree dependence (ρ) on coefficient 1/α.

Figure 3: Connection between the velocity parameter and velocity itself β = thΘ.

Entropy of Fractal Systems
The main definition of fractal is as follows: “Fractal is the structure consisting of parts, which, in some sense, are similar to the whole” [12]. Fractals are widely manifested in nature. For example, clouds, sea shores, bark and crowns of trees. They are also available in structural formations: clusters, polypeptide chains, plasma. The fractal geometry of nature is rather complex and diverse. Its study and modeling are widely introduced in different areas of science and engineering. For example, in the processes of diffusion and adsorption, turbulent flow of liquid, combustion. Based on the fractal definition and from the point of physical chemistry, electrostatically heterogeneous systems are not fractals. Either electrically neutral or similarly charged systems can be the fractals.
Therefore, we can assume that the main condition of fractal formation should be the approximate equality of their corresponding energy characteristics. In this approach the degree of structural interaction is evaluated through the relative difference of energy parameters of particles – coefficient of structural interaction (α). Apparently, many organic structures are formed following this condition, in particular, polypeptide chains, which can be considered as fractal formations [5,6]. Based on the equations in par. 3 of “Initial Data”, the stable state of each single particle is determined by the condition of equality of its entropic and negentropic components:
With the statistic aggregation of such particles the entropy of the given particle is in the interaction with the negentropy of the neighboring particle (from one side), and its negentropy interacts with the entropy of the neighboring particle (from another side) – Fig. 4 by equations:

In Figure 4 the ascending part of the graph corresponds to negentropy, and the descending one-to entropy. Apparently, the cumulative values of these parameters determine the change in the overall contour of the structure being formed, which can be formally repeated in new bigger fractals. There are different types of fractal curves on the plane (Lévy, Minkowski, Hilbert). Koch curve (Koch snowflake) is especially popular and quoted. Figure 5 demonstrates the step-by-step fractal formation [13,14]. The triangle (n=1), gradually introduced into the conformation generator, is the initial element of this process. In this approach the lateral sides of the triangle correspond to entropic and negentropic characteristics of the particle. In general, Koch curve correlates with the graphs of change of entropic characteristics (Figure 1 & 2) both by separate fragments and by bigger formations.
Figure 4: Statistic interaction of entropic and negentropic characteristics of particles.

Figure 5: Plotting of Koch curve.

Virus Entropic Characteristics
To evaluate structural interactions in simple and complex systems classical physics and quantum mechanics widely use Coulomb interactions and their varieties. Thus in [15] Vander Waals, orientation and charge-dipole interactions are referred to electron-conformation interactions in biosystems. And as a particular case-exchange-resonance transfer of energy. But biological and many cluster systems are electroneutral in structural basis. And non-Coulomb equilibrium-exchange energy interactions, i.e. non-charge electrostatic processes, are mainly important for them. The structural interactions of summed electron densities of valence orbitals of the corresponding conformation centers take place processes of equilibrium flow of electron densities due to overlapping of their wave functions. The closer are the values of their energy characteristics, the easier is the equalizing of electron densities. Heisenberg and Dirac [16] proposed the exchange Hamiltonian derived in the assumption on direct overlapping of wave functions of interacting centers:
where: -spin operator of isotropic exchange interaction for the pair of atoms; –exchange constant; and -overlapping integrals of wave functions.
In this model electrostatic interactions are modeled by effective exchange Hamiltonian acting in the space of spin functions. This approach is applied, in particular, in the analysis of structural interactions in cluster systems [17]. Such equilibrium-exchange conformation interactions regulate the stabilization of many organic systems (clusters, polypeptide chains, etc.). It can be assumed that the dynamics of virus interaction with cell structures goes by equalizing energy parameters of entropy and negentropy. Therefore, in such approach the overlapping integrals of wave functions are modeled through the value of relative difference of energy parameters of interacting centers–coefficient [5]. The less is the value , the higher is the structural interaction degree according to the nomograms. Similar dynamics can be also revealed in viral etiology. Then Koch curves (Figure 5) can be interpreted as smooth transition from atom-molecular interactions at the microlevel to a formally similar process in macrosystems. This analogy is confirmed by quantitative calculations for the coronavirus scenario. Lt us consider this on the example of the Russian coronavirus scenario for the number of diseases in the given time period by Figure 6; [18].
In initial nomograms there is a point in the middle of the graphs splitting them into two symmetrical parts at =50%. The data detalization near this value provides other values close to it. Thus, for Figure 6 this situation corresponds to the dates from 21.04.2020 to 25.04.2020 and provides the average value . This means that at there must be the plateau with the numerical value two times greater, i.e. 10987. Actually, within 13 days from 03.05.2020 to 15.05.2020- the average value of equalled 10661. The forecast accuracy -96.5%. For the graph middle part the initial equation (4) should be fulfilled. Therefore, in nomogram 1 at =50% .
Taking into account the main part of the graph without top and bottom exponents, we can do the colrrelation between the values of against the nomogram and number of days (33 days) by the graph in Figure 6 resulting in 1 days or 1 day=0.606 . Then at in the graph in Figure 5 on 21.04.2020 we have the correlative value corresponding to solving equation (4). The same proximate calculation can be also applied to evaluate the duration of coronavirus top plateau. In nomogram 2 such plateau is fulfilled from to . Applying the obtained percentage of correlation for , we get the value of top plateau -6.6 days. Then the total plateau of two parts of the graph is 13.2 days. With actual value of 13 days. The calculation accuracy is 98.5%
Figure 6: Number of diseases in the given time period.

Conclusion
After 16 May the satge of gradual decrease in the virus intensity has started, which appeared to be slower, more “saw-toothed” than the similar period of the ascending graph. This can result in a certain extension of the epidemic process duration. Despite some fluctuations, the overall strategy will not change and, therefore, it can be assumed that starting from the mid-June the virus intensity will decrease by 80-90%. This is an optimistic variant. This is possible only under the condition of adequately following the organizational measures taken in the country. But there are other factors influencing not only the virus intensity but also the duration characteristics of each stage. It is difficult to estimate them quantitatively. The most important among them are: temperature, ultraviolet and collective immunity. This virus is quite specific – its activity is revealed in the regions with hotter or colder climate to a lesser extent than in middle latitudes, e.g. around the 40th parallel. There are exceptions but in the regions without megapolices. The smog of megapolicies is like a catalyst for the virus. The influence of collective immunity determining the peculiarities of virus scenario in each separate region with gradual decrease in the number of deaths with time is also obvious. Taking into account the complex influence of warmth and ultraviolet, many analysts assume that during summer the virus intensity will mainly go down that also complies with the given forecast. We hope that the application of this technique in other regions and countries will help to analyze and forecast some important stages of the coronavirus scenario. It will be only necessary to evaluate the regional correlation coefficient in this case.
- It is demonstrated that according to the first law of thermodynamics the equality of entropic and negentropic components is the condition of resonance stationary state of systems.
- The initial nomograms of entropic and negentropic characteristics for many processes and phenomena in nature, engineering and physical chemistry are given.
- The entopic technique for forming fractal systems is presented.
- The coronavirus scenario in Russia is analyzed. The accuracy of forecast regarding the maximum number of diseases at the given moment and plateau duration is 96.5 % and 98.5%, respectively.
References
- https://ru.wikipedia.org/wiki/Spreading_COVID-19_in_Russia.
- Korablev GA (2019) On problematic issues of physical chemistry. JMEST 6: 10320-10324.
- Gevorkyan RG, Shepel VV (1972) Course of general physics. Vysshaya shkola p. 600.
- Traditional Chinese medicine.
- Korablev GА (2018) Spatial-energy interactions. Monograph. Stary Oskol: TNT, Russia, p. 132.
- Korablev GA, Zaikov GE (2012) Bio-structural energy criteria of functional states. News of HEIs. Applied chemistry and bioengineering 1(2): 118-124.
- Korablev GA, Petrova NG, Osipov AK, Zaikov GE (2013-2014) Diversified demonstration of entropy. New Book Announcement. Nanotechnologies to Nano industry. USA, pp. 120-130.
- Korablev RG, Petrova NG, Osipov AK, Zaikov GE (2014) Entropy criteria of structural interactions and business quality. Journal of Nature Science and Sustainable Technology 8(3): 46-468.
- Korablev RG, Maksimov PL, Ktodzinska E, Zaikov GE (2015) Entropic nomograms and S-curves. Monomers, polymers and composites. Theory and Practical Applications 2: 9-21.
- Korablev GA, Yu GV, Zaikov GE (2015) Hexagonal structures in nano systems. Chemical Physics and Mesoscopy 17(3): 424-429.
- Taylor E, Wheeler J (1987) Spacetime physics. Mir Publishers, Russia, p. 320.
- Feder Е (1991) Fractals. Mir Publishers, Russia, p. 260.
- https://en.wikipedia.org/wiki/Fractal
- Dresvyannikov AF, Kolpakov MЕ (2006) Fractals and their applied aspect: Indication method/Kazan State Technological University, Russia, p. 28.
- Rubin AB (1987) Biophysics. Book 1. Theoretical biophysics. M. Vysshaya shkola p. 319.
- Dirac PA (1935) Quantum Mechanics. Oxford Univ, Press, London, UK.
- Anderson PW (1963) In Magnetism. Academic Press, USA, 1: 25.
- https://en.wikipedia.org/wiki/COVID-19_pandemic_in_Russia.
© 2020 Korablev GA. This is an open access article distributed under the terms of the Creative Commons Attribution License , which permits unrestricted use, distribution, and build upon your work non-commercially.
Editor In Chief


.jpg)


Signup for Newsletter

Quick Links
 Editorial Board Registrations
 Submit your Article
 Refer a Friend
 Advertise With Us
Our Recent Edition

.jpg)


Top Editors


.jpg)


.bmp)
.jpg)
.png)
.jpg)


.jpg)


.png)

.png)


.png)


Financial Support

Sponsors

Latest e-Books

Latest Video

 a Creative Commons Attribution 4.0 International License. Based on a work at www.crimsonpublishers.com.
Best viewed in
a Creative Commons Attribution 4.0 International License. Based on a work at www.crimsonpublishers.com.
Best viewed in