- Submissions

Full Text
Novel Approaches in Cancer Study
Qualitative and Quantitative Detection of Runt-Related Transcription Factor 1 and Eight-Twenty-One Oncoprotein Gene Fusion Products using Thermal Fingerprint and Cycle Threshold Value by Employing a DNA Intercalating Dye and Fluorescent PCR for Detecting Acute Myeloid Leukaemia (AML)
Krishna Goyani1,3, Daisy Patel1, Shalin Vaniawala2 and Pratap Mukhopadhyaya1,3*
1Wobble Base Bioresearch Private Limited, India
2New Civil Hospital, India
3Shri Jagdishprasad Jhabarmal Tibrewala University, India
*Corresponding author:Pratap Mukhopadhyaya, Wobble Base Bioresearch Private Limited, Maharashtra, Shri Jagdishprasad Jhabarmal Tibrewala University, Rajasthan, India
Submission: June 16, 2023Published: June 29, 2023

ISSN:2637-773XVolume7 Issue5
Abstract
An intercalating dye-based qualitative and quantitative real time PCR assay was developed to detect and estimate the AML1/ETO fusion transcript in patients suffering from Acute myeloid leukaemia. Quantitation standard was prepared by molecular cloning of the fusion transcript in a multicopy cloning vector followed by its propagation in Escherichia coli. Nucleotide sequencing confirmed the AML1/ETO fusion point within the cloned insert and further, its serial dilution resulted in a predicted increase in cycle threshold value which was used to generate a standard curve. Secondary calibration of the standard with an CE-IVD approved, quantified control DNA allowed quantitative detection of AML1/ETO and ABL copy numbers of an AML1/ETO testing panel of samples and the percentage of the AML1/ETO was successfully ascertained. Qualitative detection data of the fusion transcripts from the panel indicated 100% concordance of data when compared with a published protocol that used hydrolysis probes (TaqMan) for detecting the AML1/ETO fusion transcript percentage in clinical samples. The study indicated the potential of using Evagreen as an intercalating dye for qualitative and quantitative detection of AML1/ETO and ABL transcripts for estimating Minimal Residual Disease (MRD) in AML patients.
Keywords:Evagreen; AML1/ETO; RT-PCR; Quantitation; Cloning
Keywords:E-RT-PCR: Evagreen Real Time PCR; CT: Cycle Threshold
Introduction
In hematopoietic and lymphoid tumours, chromosomal translocation events are a common phenomenon [1] Such genome rearrangements provide specific advantages in the growth of cells and also generate congenial cellular environments for birth of subsequent mutations in stem or progenitor cells that may finally lead to the development of malignant tumours. In chromosomal translocation, the genetic shuffling alters the original location of the proto-oncogenes that is one of the primary reasons for onset of an oncogenic event. Specifically, this has been found to occur in two defined ways [2&3]. The first and most important one is the formation of novel fusion proteins that have oncogenic potential. One of the best example of this category is the well-known translocation event between the chromosome 9 and 22 [t (9;22)], also known as the Philadelphia (Ph) chromosome that is seen in Chronic Myeloid Leukaemia (CML), which is born due to translocation of the proto-oncogene ABL located at chromosome 9 to the BCR gene present on chromosome 22. The resultant new (onco) protein is associated with tumorigenesis of CML and acute lymphoblastic leukaemia (ALL) [4].
The other way is when protooncogenes are positioned close to new cis-regulatory elements. Juxtaposition of the c-MYC in Burkitt lymphoma disease, caused as a result of a t (8;14) translocation, onto the Immunoglobulin Heavy chain (IGH). Regulatory elements are a classic example of this type [5]. Such an event of chromosomal re shuffling that balance regions on two different chromosomes such as the one expressed as t (8;21) (q22; q22), occurs in the human population due to fusion of the AML1 (CBFa) gene present on human chromosome 21 and the ETO (MTG8, CDR8) gene residing on chromosome number 8 [6]. The chimeric fusion gene thus formed gets transcribed from the derivative chromosome number 8 [7&8]. This is an outcome of events occurring at chromosomal breakpoint cluster resident within intron 5 of the AML1 gene and that within exon 2 of the ETO gene that orchestrates together to give birth to an in-frame fusion transcript [9&10]. However, it may be mentioned that additional out-of-frame splicing variants too are reported for AML disease in isolated cases [11&12].
The event of t (8;21) translocation has an incidence rate of around 7-12% of all AML cases but the observation is primarily in AML-M2 [13-15] as per the French American-British (FAB) classification of AML [16]. AML patients harbouring a ‘t (8;21)’ have a favourable prognosis and the patient acquires complete remission (CR) in almost 98% of the cases. Further, the overall survival rate at 5 years for all AML patients is around 69% while it is 83% at 3 years in cases of children [13]. Studies suggest that although the AML1/ ETO gene fusion is related to a favourable prognosis, qualitative RTPCR does indicate the presence of the AML1/ETO fusion transcript even when remission is in place following chemotherapy and autologous or allogenic transplantation of the bone marrow [17- 19]. Converse to this, there exist reports also where remission is perfectly correlated with absence of the fusion transcript as is evident from a negative RT-PCR report in CR patients [20-22]. One such study reported good prognosis with absence of the fusion transcript in AML patients [23]. Another report provided encouraging results that supported quantitative PCR assay for AMl1/ETO using competitive RT-PCR technique for monitoring minimal residual disease (MRD) [24-26]. Another study described a statistically valid correlation between the quantity of the AML1/ ETO transcript and remission as well as enhanced risk of relapse in AML patients [25].
However, competitive RT PCR is a labour-intensive technique that requires significant time to complete and has limited dynamic range for quantification. These properties diminish its candidature as a potential technique for routine diagnosis to monitor AML1/ ETO fusion transcript levels. This problem has been effectively solved by the introduction of the reverse transcription real time PCR or the RQ-RT-PCR. This method is fast, reliable, accurate and has excellent reproducibility. These features make this a technique of choice for AML studies related to MRD. In fact, comparative study between competitive RT PCR and RQ-RT-PCR has shown a high degree of correlation [27]. The specialty of RT PCR is its unique ability to monitor the progress of a reaction as it happens. This is achieved by specific types of chemistries that are key to the PCR reaction occurring inside the machine. These chemistries primarily comprise of either DNA binding intercalating dyes such as SYBR Green 1 or hydrolysis & hybridization probes including molecular beacons, peptide nucleic acid light-up, sunrise and scorpion probes [28-31]. Dual labelled TaqMan probes are one of the most popular tools for sensitive detection of targets in a real time PCR. Studies have shown parallel detection of different fusion genes numbering as many as 45 and associated with leukaemia that can be detected using these dual-colour fluorescence probes on a real-time PCR platform [32].
However, some of the major disadvantages of TaqMan probe based real time PCR tests are the high cost of synthesis and the need for a unique probe for each specific target. On the other hand, intercalating dyes such as SYBR Green 1 operate by binding with the minor groove of the double stranded DNA thereby emitting fluorescence which is 1000-fold higher than that during unbound conditions [33]. With exponential synthesis of double stranded DNA during PCR, proportionate quantities of the dye molecules get intercalated thereby resulting in increasing quantum of fluorescence. One of the advantages of the intercalating dye chemistry is the cost benefit and its ease of use. It does not require single or dual labelled probes and can be adopted at ease with ordinary desalted oligonucleotide primers if the intercalating dye is available. However, specificity remains a concern when intercalating dyes are used since it can bind to any amplified product, specific or otherwise, that are generated during the process of PCR. In this study we demonstrate the development of an EvaGreen dye based real time PCR assay for the detection and absolute as well as relative quantification [34] of AML1/ETO fusion product using ABL as the control gene, by analyzing cycle threshold (Ct) value and the thermal melt curve that is generated at the end of the PCR protocol. Our study indicates that adequate optimization can make DNA intercalating dye such as Evagreen as useful as dual labelled probes for supporting qualitative and quantitative RT-PCR for monitoring MRD in AML patients.
Material and Methods
Patients
Peripheral Blood (PB) samples of 15 patients with suspected de novo AML and stored at the sample depository section of SN GeneLab (a molecular diagnostic laboratory located at Surat, India) were used in this study
Extraction of total RNA from peripheral blood (PB)
Mononuclear cells were isolated from PB samples and used to extract total RNA employing a spin column-based human blood RNA extraction kit (Wobble Base Bioresearch, India). RNA was eluted in 50μL of the elution buffer and 7μL was used for generating cDNA.
cDNA synthesis and PCR
cDNA was synthesized from extracted human peripheral blood RNA using Prime Script 1st strand cDNA Synthesis Kit (Takara Bio, Japan) according to manufacturer’s instructions and 7μL of synthesized cDNA solution was used for subsequent PCR using gene specific primers (GSPs).
Designing the GSPs
GSPs specific for the AML1 gene portion spanned from position 634 to 654 of the AML1 gene (Sequence ID: NM_001754.5). The sequence of this primer was identical to the top strand of the reference gene sequence. For the ETO gene, the primer sequence corresponded to position 404 to 424 of the ETO gene with GenBank accession number NM_175635.3. The nucleotide sequence of this primer was identical to the bottom strand of the reference sequence.
Control gene
In order to compensate for variations of RNA integrity and trace variables in the reverse transcription step, the AML1/ETO fusion transcript was normalized to a control gene. For this, the human ABL gene was chosen after referring to the reports of the ‘Europe Against Cancer (EAC) Program’ [35].
Evagreen-RT-PCR (E-RT-PCR) and dissociation curve analysis
For amplification of the AML1/ETO fusion transcript gene segment by E-RT-PCR, the reaction condition comprised of 2μL of synthesized cDNA, 1μL of each forward (AML1) and reverse (ETO) primers (7.5pMoles each), 12.5μL of 2X Evagreen Master Mix (Wobble Base Bioresearch, India) topped up with sterile double distilled water to a final reaction volume of 25μL. The thermal cycling conditions were as follows: 940C-5 mins hold followed by 35 cycles, each comprising 940 °C -45 seconds, 67 °C - 30 seconds and 720 °C -30 seconds. This was followed by the melt curve analysis [36-38]. For amplification of the control gene (ABL) all parameters were identical as mentioned above except that the primer concentrations were 10 pMoles each and the annealing temperature was 570 °C.
Gold standard
For the gold standard assay, the method, as described by Fujimaki et al. [38], for qualitative detection of AML1/ETO fusion transcript was followed. Briefly, cDNA synthesized from patient RNA was used as a template and both AML1-ETO fusion transcript and the ABL gene segments were amplified from the same cDNA. For real time PCR, universal primers and (hydrolysis) probes for AML1-ETO with ABL as the control gene were used as described by the authors.
Real Time PCR was performed in 25μL reaction volume which comprised of Premix Ex Taq Master Mix (Takara, Japan), 300nM of each primer, 200nM of ABL or 100nM of AML1-ETO probe (Applied Biosystems, Weiterstadt, Germany), and 1μl of cDNA. Rhodamine derivative ROX was used as a passive reference. The cycling conditions were 2 minutes at 50 °C (UNG treatment), 30 seconds at 95 °C (UNG inactivation & activation of Taq Polymerase) followed by 40 cycles, each comprising of 4 seconds at 95 °C (denaturation) and 32 seconds at 60 °C (annealing and extension). All experiments were performed on a Rotorgene Q PCR machine (Qiagen, Germany).
Molecular cloning of gene target
GSPs were used to amplify the AML1/ETO fusion gene transcript using cDNA as a template. The amplicon generated was directly ligated to a commercial T-tailed vector (pGEM T Easy (pGEM®-T Easy Vector Systems; Promega Corporation, USA) and the ligated mixture used to transform a chemically competent JM109 Escherichia coli (E.coli) cells. Transformed cells were selected using S-Gal-appended media containing ferric ammonium citrate [36]. Transformed cells harbouring the cloned DNA fragment was confirmed by colony PCR, followed by DNA sequencing of the insert. For preparing standards, pure plasmids were extracted using a silica spin column-based plasmid DNA extraction kit (Wobble Base Bioresearch, India). A similar verified recombinant clone for ABL (cloned in pGEM T Easy vector) was already available in the laboratory and was used as the control target.
Secondary calibration and generating quantitation controls
Secondary calibration of the recombinant plasmid DNAs, namely AML1/ETO and ABL were done using the ABL and RUNX1- RUNX1T1 Fusion Gene Standards available with ipsogen RUNX1- RUNX& ABL 1T1 Kit (Cat. No. / ID: 675013), Qiagen, Germany. Briefly, the recombinant plasmid DNA (AML1/ETO) were linearized using Not1 and purified using a silica spin column-based DNA purification kit (Wobble Base Bioresearch, India). The linearized DNA was estimated by recording optical density at 260nm using a spectrophotometer (Labman Scientific Instruments, India). The purified linear plasmids were then run against the ipsogen standards and calibrated followed by serial dilutions to generate 105, 104, 103, 102 and 101 copies/μL for the AML1/ETO and ABL plasmid DNAs, respectively, for use as quantitation standard in E-RT-PCR.
Determining the thermal DNA fingerprint of the AML1/ ETO and ABL gene fragments
The thermal DNA fingerprint of the target amplicons for AML1/ETO fusion gene and the ABL gene was determined by dissociation curve analysis on a Rotor-Gene real time PCR platform (Qiagen, Germany). For this, the target was amplified using GSPs and subjected to melt curve analysis using the default parameters available in the Rotor-Gene Q software. Melt peaks were detected and their temperature signature identified from the X axis of the graph and recorded.
Optimization of E-RT-PCR
The E-RT-PCR was optimized by titrating the primer and MgCl2 concentrations such that a No Template Control (NTC) consistently generated nil Ct value when run across the full number of thermal cycles. The analytical sensitivity was determined by serially diluting purified AML1/ETO target fragments with wild type human genome and estimating the lowest dilution that could be detected by the protocol. For clinical samples from the test panel, positive results were reported as a ratio between copies of t (8;21) transcript and the normal control gene (ABL) detected.
Result
Writing original draft preparation, Guangwei Tao; review and editing, Wenyan Liao, Guodong Chen, Chengming Ding, Shuo Qi, Jiafeng Hou, Jun Qiu, Xinmiao Jiang, Xin Deng. All authors have read and agreed to the published version of the manuscript.
Funding
Molecular cloning of the AML1/ETO fusion product
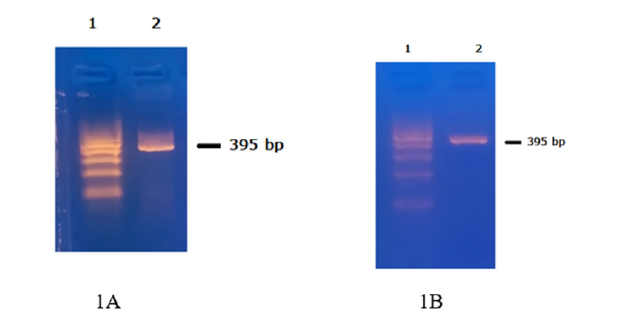
The GSP pair amplified a 395 bp amplicon (Figure 1A) when cDNA, synthesized from blood RNA of a patient positive for AML1/ ETO fusion, was used as a template. Identical amplicon was generated when the same GSP was used for amplification using the AML1/ETO recombinant plasmid DNA as template (Figure 1B).
Figure 1:A. AML1/ETO fusion transcript amplicon (395 bp) using cDNA from AML1/ETO positive RNA as template. B. PCR amplicon generated using a positive recombining clone for AML1/ETO as template. This amplicon was used for confirmation of identity by nucleotide sequencing.
Fluorescent DNA sequencing of the AML1/ETO cloned insert
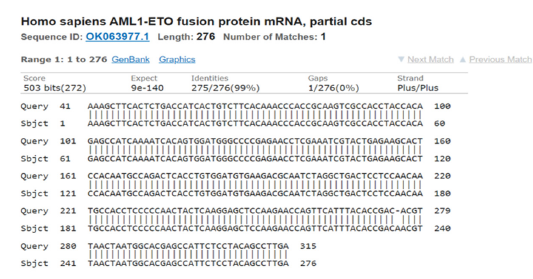
Fluorescent DNA sequencing of the AML1/ETO cloned insert indicated the fusion point of the AML1 and the ETO genes with a distinct breakpoint in the middle of the cloned DNA fragment (Figure 2). A Basic local alignment search tool [37] analysis indicated successful alignment of the sequence with the nucleotide sequence of AML1/ETO fusion protein mRNA submitted to GenBank by another author and with accession number OK063977.1 (Figure 3).
Figure 2:Nucleotide sequencing of the AML1/ETO fusion transcript insert cloned in a multicopy E. coli cloning vector. The fusion point between the AML1 and the ETO gene is indicated. The nucleotide sequence section shows the position of the start and end bases of AML1 and the ETO gene portion in the corresponding GenBank accession number.
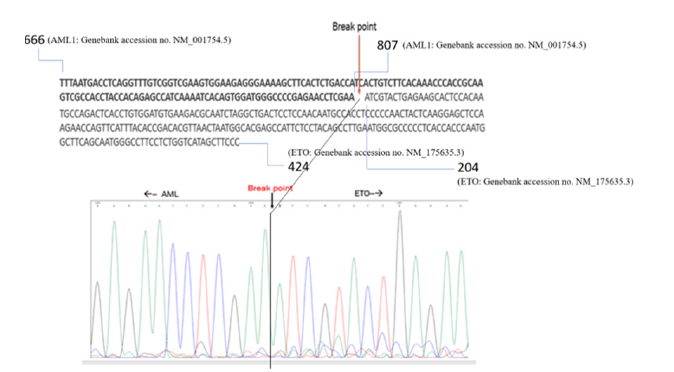
Figure 3:Nucleotides sequence alignment between the AML1/ETO fusion transcripts amplicon and a matching sequence available in NCBI GenBank (Accession no. OK063977.1) indicating specificity of the cloned AML1/ETO insert used as control in this study..
Generating quantitation standards
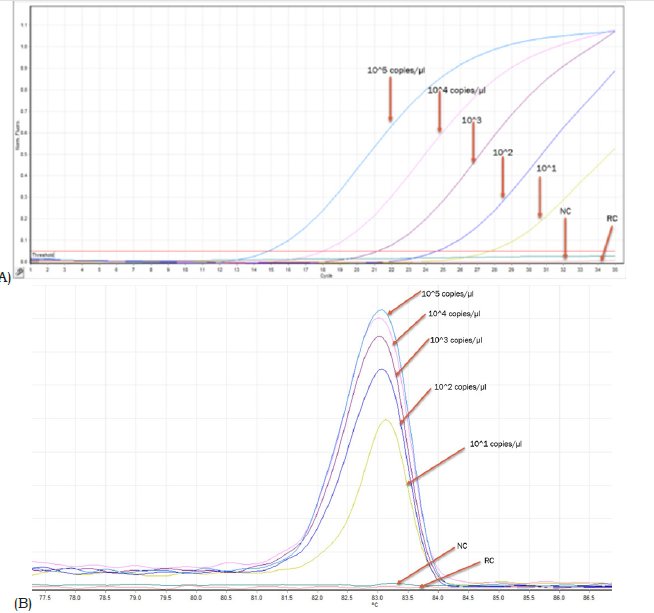
Secondary calibrated and serially diluted linearized plasmid DNAs of AML1/ETO & ABL indicated a dynamic range of detection ranging from 105 copies to 101 copies of target/μL (Figure 4A). Corresponding melt curves for AML1/ETO control indicated a thermal fingerprint of 83.5-84.50C (Figure 4B). The shifting of Ct value from low to high corresponded with comparable reduction in peak height of the dissociation curve (Figure 4A & 4B). Similar data was observed for the control ABL gene except that the signature thermal melt point ranged between 82.5-83.50C (Figure 5A & 5B).
Figure 4:A. E-RT-PCR data of serially diluted AML1/ETO fusion transcript target showing gradual shifting of the Ct value to the right with increasing value. The negative control (NC) and the reagent control (RC) graphs are below the threshold and hence generated nil Ct value. B. Reducing height of the dissociation curve peak corresponding to each dilution run shown in figure 4A. The Specific thermal melt signature was seen in all dilutions. Please see the result section for details.
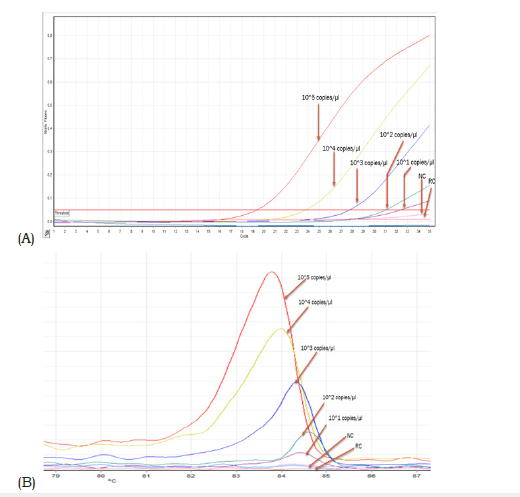
Figure 5:A. E-RT-PCR data of serially diluted ABL transcript target showing gradual shifting of the Ct value to the right with increasing value. The negative control (NC) and the reagent control (RC) graphs are below the threshold and hence generated nil Ct value. B. Reducing height of the dissociation curve peak corresponding to each dilution run shown in figure 4A. The thermal melt signature of each dilution peak is detected. Please see the result section for details.
Resource population used in this study
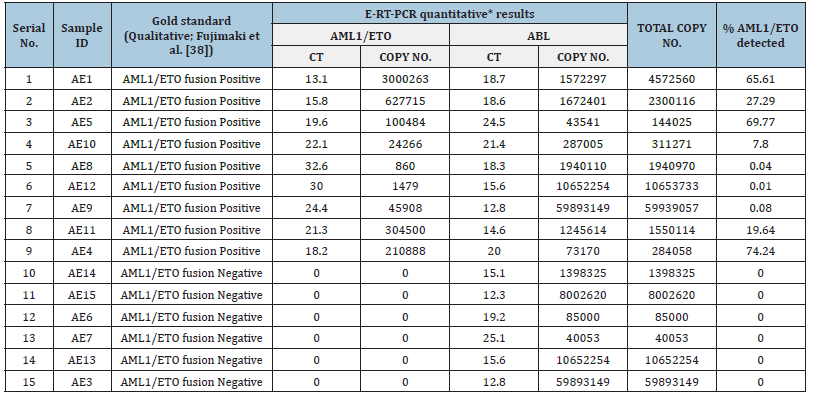
The resource population used in this study and data generated from them by RT-PCR are summarized in Table 1. The data generated from E-RT-PCR was analyzed by two different methods. First, the qualitative data generated was compared with a Taqman probebased test following a published protocol [38] and the results were compared for concordance. Second, after secondary calibration of the AML1/ETO and ABL controls (this study) with ipsogenquantified controls, the AML1/ETO and ABL transcript ratio was estimated for all the positive samples available in the test panel.
Table 1:Real time PCR data generated from a panel of 15 clinical samples included in this study.
Analytical sensitivity
The analytical sensitivity of the E-RT-PCR developed in this study was detection of 1 target in the background of 100,000 wild genome copies.
Discussion
From the clinical point of view, AML disease with t (8;21) translocation appears to be prevalent in early adulthood and is associated with a superior prognosis compared to most other categories of AMLs. An enhanced marrow granulopoiesis coupled with inhibition of erythropoiesis is a consistent pathological signature of this disease [39]. Overall survival rate (OS) associated with AML has been demonstrated to improve when dynamic monitoring of minimal residual disease is followed along with corresponding optimized treatment [40]. Failure of treatment resulting due to relapse of the disease in AML continues to remain a serious challenge to the onco-clinicians [41]. This indicates the need for a sensitive method of monitoring MRD in AML for proper treatment and prevention of relapse cases.
As of now, the primary techniques for determining MRD in AML include Multiparameter flow Cytometry (MFC) and Real-Time Quantitative Polymerase Chain Reaction (RT-qPCR) [42]. It has been shown that detection of high MRD level on a MFC platform broadly correlated with an inferior prognosis [43] but this technology is not fully standardized yet, because of constraints associated with low sensitivity and antigenic changes following treatment [44]. Compared to this, RT-qPCR has been demonstrated to be superior with enhanced sensitivity for adequate monitoring of MRD in AML patients which can also be used to predict the risk of relapse [45&46]. Two methods of real time PCR analysis are well known in the domain of a gene expression study. These are the SYBR Green (intercalating dye) and the TaqMan (hydrolysis probes) chemistries. The TaqMan method is expensive due to the high cost of synthesis of the dual labelled probes and that of the commercial PCR master mixes that are most often required for TaqMan probe-based PCR. Further, the TaqMan probe-based PCR assays are less adaptable to new assays since every target requires a sequence-specific TaqMan probe to be synthesized. However, one of the significant advantages of TaqMan probe-based PCR is its high specificity that results in near-nil false positive and negative calls.
On the other hand, intercalating dye-based PCR is known to have comparable and similar precision as considered to TaqMan probe-based PCR [30] but its specificity remains a concern because the intercalating dye binds to any double stranded DNA generated during the course of amplification in contrast to TaqMan probes that are designed only to measure sequence-specific amplification. In this study we demonstrated that carefully optimized intercalating dye based real time PCR tests for detecting and estimating AML1/ ETO fusion transcripts can be incorporated in routine diagnostics. It can add convenience and economy to the test and generate comparable data as compared to hydrolysis and similar probebased assays. The GSPs successfully and repeatedly amplified the desired fusion region from cDNA synthesized from RNA which were obtained from AML1/ETO-positive patients. Following molecular cloning of this fragment in a multi copy E. coli vector and subsequent propagation in a laboratory strain of E. coli (JM109), the sequence from the rescued insert from the recombinant clone matched its pre-cloning counterpart (Figure 2). Further, an online alignment analysis revealed a perfect match between the nucleotide sequence obtained from the cloned insert with another which was submitted to GenBank by another author (Figure 3). Analysis of the electropherogram showed the exact point of fusion of AML1 and the ETO gene. This was independently confirmed through sequencealignment analysis of the left (AML1) and the right (ABL) part of the fusion gene sequence with AML1 and ETO gene sequences available at the GenBank.
Fujimaki et al. [38] reported an efficient methodology for qualitative detection of AML1/ETO fusion transcript using TaqMan chemistry. This protocol can be used for estimating MRD in AML1/ ETO positive patients. This protocol has been followed by other authors also working in this domain [47]. In this study we used this TaqMan probe-based protocol as the gold standard for qualitative detection of AML1/ETO fusion transcript and determination of MRD. Out of the 15 samples tested in this study, there was cent per cent concordance of data generated between the [38] qualitative detection protocol and that used in this study for E-RT-PCR for the detection of AML1/ETO fusion transcripts (Table 1). In a study by [48], it was observed that there was no trend where higher rates of relapse of AML patients were associated with higher levels of AML1/ ETO fusion transcripts. However, with reducing levels of AML1/ ETO fusion transcripts in patients, there was a reducing probability of relapse. Importantly, once complete remission was achieved, an enhanced AML1/ETO at any given point of time was associated with enhanced probability of relapse. The study effectively demonstrated that both qualitative as well as quantitative estimation of AML1/ETO fusion transcripts have high prognostic value in monitoring of MRD and that a negative or continued low level of AML1/ETO expression was related to increased disease-free survival.
Table1 summarizes the comparative data on qualitative detection of AML1/ETO fusion transcript generated from E-RT-PCR (this study) and a Taqman protocol-based qualitative detection of AML1/ETO fusion transcript in a panel of 15 clinical samples. There was 100% concordance of data between the two sets of measurements. The cloned AML1/ETO and ABL gene segments in this study were secondary calibrated with a CE and IVD approved control DNA (Ipsogen, Qiagen, Germany) and used to generate quantitative data on AML1/ETO fusion transcript in samples investigated in this study (Table 1). Serial dilution of the controls (developed in this study) indicated gradual shifting of Ct to a higher value (corresponding to reducing concentration of analyte). This is reflected in the corresponding reduction of peak height of the dissociation curves associated with each dilution for both AML1/ ETO and ABL standards, respectively (Figure 4B & 5B). While the melt peak height did not correlate with concentration of the analyte in a linear fashion, the Ct values maintained a linear relation with concentration of the analyte (control DNA) over a wide range (Figure 4A & 5A).
Intercalating dye-based real time PCR has been shown to face challenges in addressing adequate target specificity during amplification [49]. This is primarily because the detector dye can generate signal from any double stranded DNA without sequencespecific discrimination as opposed to hydrolysis probe-based assays where signal is generated after discrete sequence-based discrimination. However, the feature of dissociation curve analysis in intercalating dye-based real time PCR offers the opportunity to generate unique ‘thermal’ DNA fingerprint for each specific target amplicon that can be used to assess the specificity of the amplicon generated and detected by the intercalating dye. In this study this thermal melt point temperature of the specific amplicon was found to be 82-83 °C for ABL and 83.5 °C - 84.5 °C for AML1/ ETO fusion transcript, respectively. This thermal signature allowed confirmation of the specificity of the PCR product generated and detected in a run. The detection of 1479 copies of AML1/ETO fusion transcript against the background of 10652254 copies of ABL transcript in sample no. AE12 is encouraging. This corresponded to an AML1/ETO % of 0.01 which can be considered sensitive as compared to traditional methods of detection such as FISH [50].
Appropriate optimization of the E-RT-PCR indicated no detectable fluorescence when a negative control or a no template control was used (Figure 4 & 5). This indicated that no detectable double stranded DNA products were formed in the E-RT-PCR when a specific target was absent in the reaction tube. It is important to note that while the level of fluorescence against a given quantum of analyte vary when a hydrolysis probe, such as a TaqMan probe, is used compared to that of an intercalating dye, such as Evagreen or SYBR Green, a secondary calibration can bring both the sensitivity quotients under the measurement of a single scale. In such a case, both the detection chemistries can generate comparable data provided the slope, r2 value and efficiency of the reaction remains within acceptable limits [51].
In conclusion, this study demonstrated adaptability of Evagreen as an intercalating dye in real time PCR for qualitative detection of AML1/ETO fusion transcript against the background of ABL transcripts as the control. The assay has the potential to be used in routine diagnostics and can offer economical and quality MRD solutions for patients suffering from AML disease.
Acknowledgement
Nucleotide Sequencing of target DNA performed by Shweta Patel (SN GeneLab Private limited, India) is thankfully acknowledged.
References
- Mitelman F, Johansson B, Mertens F (2007) The impact of translocations and gene fusions on cancer causation. Nat Rev Cancer 7(4): 233-245.
- Nambiar M, Kari V, Raghavan SC (2008) Chromosomal translocations in cancer. Biochim Biophys Acta 1786(2): 139-152.
- Frothing S, Döhner H (2008) Chromosomal abnormalities in cancer. N Engl J Med 359(7): 722-734.
- Pui CH, Relling MV, Downing JR (2004) Acute lymphoblastic leukemia. N Engl J Med 350(15): 1535-1548.
- Crombie J, LaCasce A (2021) The treatment of burkitt lymphoma in adults. Blood 137(6): 743-750.
- Van de Locht LT, Smetsers TF, Wittebol S, Raymakers RA, Mensink EJ (1994) Molecular diversity in AML1/ETO fusion transcripts in patients with t (8;21) positive acute myeloid leukaemia. Leukemia 8(10): 1780-1784.
- Erickson P, Gao J, Chang KS, Look T, Whisenant E, et al. (1992) Identification of breakpoints in t (8;21) acute myelogenous leukemia and isolation of a fusion transcript, AML1/ETO, with similarity to Drosophila segmentation gene, runt. Blood 80(7): 1825-1831.
- Miyoshi H, Kozu T, Shimizu K, Enomoto K, Maseki N, et al. (1993) The t (8;21) translocation in acute myeloid leukemia results in production of an AML1-MTG8 fusion transcript. EMBO J 12(7): 2715-2721.
- Wolford JK, Prochazka M (1998) Structure and expression of the human MTG8/ETO gene. Gene 212(1): 103-109.
- Van Dongen JJ, Macintyre EA, Gabert JA, Delabesse E, Rossi V, et al. (1999) Standardized RT-PCR analysis of fusion gene transcripts from chromosome aberrations in acute leukemia for detection of minimal residual disease. report of the BIOMED-1 Concerted action: investigation of minimal residual disease in acute leukemia. Leukemia 13(12): 1901-1928.
- Saunders MJ, Tobal K, Keeney S, Liu Yin JA (1996) Expression of diverse AML1/MTG8 transcripts is a consistent feature in acute myeloid leukemia with t (8;21) irrespective of disease phase. Leukemia 10(7): 1139-1142.
- Tighe JE, Calabi F (1994) Alternative, out-of-frame runt/MTG8 transcripts are encoded by the derivative (8) chromosome in the t (8;21) of acute myeloid leukemia M2. Blood 84(7): 2115-2121.
- Grimwade D, Walker H, Oliver F, Wheatley K, Harrison C, et al. (1998) The importance of diagnostic cytogenetics on outcome in AML: analysis of 1,612 patients entered into the MRC AML 10 trial. The Medical Research Council Adult and Children's Leukaemia Working Parties. Blood 92(7): 2322-2333.
- Gallego M, Carroll AJ, Gad GS, Pappo A, Head D, et al. (1994) Variant t (8;21) rearrangements in acute myeloblastic leukemia of childhood. Cancer Genet Cytogenet 75(2): 139-144.
- Andrieu V, Radford-Weiss I, Troussard X, Chane C, Valensi F, et al. (1996) Molecular detection of t (8;21)/AML1-ETO in AML M1/M2: correlation with cytogenetics, morphology and immunophenotype. Br J Haematol 92(4): 855-865.
- Schiffer CA, Stone RM (2003) Morphologic classification and clinical and laboratory correlates. In: Kufe DW, Pollock RE, Weichselbaum RR, et al. (Eds.), (6th edn), Holland-Frei Cancer Medicine, Hamilton (ON), BC Decker.
- Jurlander J, Caligiuri MA, Ruutu T, Baer MR, Strout MP, et al. (1996) Persistence of the AML1/ETO fusion transcript in patients treated with allogeneic bone marrow transplantation for t (8;21) leukemia. Blood 88(6): 2183-2191.
- Kusec R, Laczika K, Knöbl P, Friedl J, Greinix H, et al. (1994) AML1/ETO fusion mRNA can be detected in remission blood samples of all patients with t(8;21) acute myeloid leukemia after chemotherapy or autologous bone marrow transplantation. Leukemia 8(5): 735-739.
- Nucifora G, Larson RA, Rowley JD (1993) Persistence of the 8;21 translocation in patients with acute myeloid leukemia type M2 in long-term remission. Blood 82(3): 712-715.
- Naoki Sakata, Takayuki Okamura, Masami Inoue, Keiko Yumura-Yagi, Junichi Hara, et al. (1997) Rapid disappearance of AMLI/ETO fusion transcripts in patients with t(8;21) acute myeloid leukemia following bone marrow transplantation and chemotherapy, Leukemia & Lymphoma 26: 1-2.
- Satake N, Maseki N, Kozu T, Sakashita A, Kobayashi H, et al. (1995) Disappearance of AML1-MTG8(ETO) fusion transcript in acute myeloid leukaemia patients with t (8;21) in long-term remission. Br J haematol 91(4): 892-898.
- Preudhomme C, Philippe N, Macintyre E, Henic N, Lai JL, et al (1996) Persistence of AML1/ETO fusion mRNA in t(8;21) acute myeloid leukemia (AML) in prolonged remission: is there a consensus? Leukemia 10(1): 186-188.
- Morschhauser F, Cayuela JM, Martini S, Baruchel A, Rousselot P, et al. (2000) Evaluation of minimal residual disease using reverse-transcription polymerase chain reaction in t (8; 21) acute myeloid leukemia: A multicenter study of 51 patients. J Clin Oncol 18(4): 788-794.
- Muto A, Mori S, Matsushita H, Awaya N, Ueno H, et al. (1996) Serial quantification of minimal residual disease of t(8;21) acute myelogenous leukaemia with RT‐competitive PCR assay. Br J Haematol 95(1): 85-94.
- Tobal K, Newton J, Macheta M, Chang J, Morgenstern G, et al. (2000). Molecular quantitation of minimal residual disease in acute myeloid leukemia with t (8; 21) can identify patients in durable remission and predict clinical relapse. Blood 95(3): 815-819.
- Tobal K, Yin JA (1996) Monitoring of minimal residual disease by quantitative reverse transcriptase-polymerase chain reaction for AML1-MTG8 transcripts in AML-M2 with t (8; 21). Blood 88(10): 3704-3709.
- Wattjes MP, Krauter J, Nagel S, Heidenreich O, Ganser A, et al. (2000) Comparison of nested competitive RT-PCR and real-time RT-PCR for the detection and quantification of AML1/MTG8 fusion transcripts in t(8;21) positive acute myelogenous leukemia. Leukemia 14(2): 329-335.
- Mullis KB (1990) The unusual origin of the polymerase chain reaction. Sci Am 262(4): 56-61.
- Mullis KB, Faloona FA (1987) Specific synthesis of DNA in vitro via a polymerase-catalyzed chain reaction. Methods Enzymol 155: 335-350.
- Tan X, Sun X, Gonzalez-Crussi FX, Gonzalez-Crussi, F, Hsueh W (1994) PAF and TNF increase the precursor of NF-kappa B p50 mRNA in mouse intestine: quantitative analysis by competitive PCR. Biochim Biophys Acta 1215(1-2): 157-162.
- Huang SK, Xiao HQ, Kleine-Tebbe J, Paciotti G, Marsh DG, et al. (1995) IL-13 expression at the sites of allergen challenge in patients with asthma. J Immunol 155(5): 2688-2694.
- Zheng Z, Zhang P, He G, Liao K, Wang Z, et al. (2017) Simultaneous detection of 45 fusion genes in leukemia by dual-color fluorescence real-time PCR. Int J Lab Hematol 39(2): 175-184.
- Huang SK, Yi M, Palmer E, Marsh DG (1995) A dominant T cell receptor beta-chain in response to a short ragweed allergen, Amb a 5. J Immunol 154(11): 6157-6162.
- Eischeid AC (2011) SYTO dyes and EvaGreen outperform SYBR Green in real-time PCR. BMC Res Notes 4: 263.
- Beillard, E, Pallisgaard N, van der Velden VH, Bi W, Dee R, et al. (2003) Evaluation of candidate control genes for diagnosis and residual disease detection in leukemic patients using 'real-time' quantitative reverse-transcriptase polymerase chain reaction (RQ-PCR) - a Europe against cancer program. Leukemia 17(12): 2474-2486.
- Heuermann K, Cosgrove J (2001) S-Gal: an autoclavable dye for color selection of cloned DNA inserts. Biotechniques 30(5): 1142-1147.
- Altschul SF, Gish W, Miller W, Myers EW, Lipman DJ (1990) Basic local alignment search tool. Journal Of Molecular Biology 215(3): 403-410.
- Fujimaki S, Funato T, Harigae H, Imaizumi M, Suzuki H, et al. (2000) A quantitative reverse transcriptase polymerase chain reaction method for the detection of leukaemic cells with t (8;21) in peripheral blood. Eur J Haematol 64(4): 252-258.
- Choi Y, Elagib KE, Delehanty LL, Goldfarb AN (2006) Erythroid inhibition by the leukemic fusion AML1-ETO is associated with impaired acetylation of the major erythroid transcription factor GATA-1. Cancer Res 66(6): 2990-2996.
- Rubnitz JE (2017) Current management of childhood acute myeloid leukemia. Paediatr Drugs 19(1): 1-10.
- Zwaan CM, Kolb EA, Reinhardt D, Abrahamsson J, Adachi S, et al. (2015) Collaborative efforts driving progress in pediatric acute myeloid leukemia. J Clin Oncol 33(27): 2949-2962.
- Selim AG, Moore AS (2018) Molecular minimal residual disease monitoring in acute myeloid leukemia: challenges and future directions. J Mol Diagn 20(4): 389-397.
- Loken MR, Alonzo TA, Pardo L, Gerbing RB, Raimondi SC, et al. (2012) Residual disease detected by multidimensional flow cytometry signifies high relapse risk in patients with de novo acute myeloid leukemia: a report from children's oncology group. Blood 120(8): 1581-1588.
- Buldini B, Maurer-Granofszky M, Varotto E, Dworzak MN (2019) Flow-cytometric monitoring of minimal residual disease in pediatric patients with acute myeloid leukemia: recent advances and future strategies. Front pediatr 7: 412.
- Voso MT, Ottone T, Lavorgna S, Venditti A, Maurillo L, et al. (2019) MRD in AML: The role of new techniques. Front Oncol 9: 655.
- Pigazzi M, Manara E, Buldini B, Beqiri V, Bisio V, et al. (2015) Minimal residual disease monitored after induction therapy by RQ-PCR can contribute to tailor treatment of patients with t (8;21) RUNX1-RUNX1T1 rearrangement. Haematologica 100(3): e99-e101.
- Elagib KE, Goldfarb AN (2007) Oncogenic pathways of AML1-ETO in acute myeloid leukemia: multifaceted manipulation of marrow maturation. Cancer Lett 251(2): 179-186.
- Zhang L, Li Q, Li W, Liu B, Wang Y, et al. (2013) Monitoring of minimal residual disease in acute myeloid leukemia with t (8;21) (q22; q22). Int J Hematol 97(6): 786-792.
- Donia D, Petrinca AR, Divizia M (2010) A strategy to increase the specificity of syber green I qRT-PCR in hepatitis a detection. New microbiol 33(3): 215-222.
- Gutierrez-Rodrigues F, Santana-Lemos BA, Scheucher PS, Alves-Paiva RM, Calado RT (2014) Direct comparison of flow-FISH and qPCR as diagnostic tests for telomere length measurement in humans. PLoS One 9(11): e113747.
- Bivins A, Kaya D, Bibby K, Simpson SL, Bustin SA, et al. (2021) Variability in RT-qPCR assay parameters indicates unreliable SARS-CoV-2 RNA quantification for wastewater surveillance. Water Res 203: 117516.
© 2023. Pratap Mukhopadhyaya. This is an open access article distributed under the terms of the Creative Commons Attribution License , which permits unrestricted use, distribution, and build upon your work non-commercially.
 a Creative Commons Attribution 4.0 International License. Based on a work at www.crimsonpublishers.com.
Best viewed in


.jpg)


 Editorial Board Registrations
 Submit your Article
 Refer a Friend
 Advertise With Us
.jpg)


.jpg)


.bmp)
.jpg)
.png)
.jpg)


.jpg)


.png)

.png)


.png)


