- Submissions

Full Text
Novel Approaches in Cancer Study
Molecular Cytogenetic Characterization of Synovial Sarcoma Cell Line SW982
Na Du1,2, Wanguo Bao1, Kaiyu Zhang1, Xianglan Lu2, Guangming Liu2,3, Chuan Zhang2,4, Yunpeng Shi2,5, Ming Li2,6, Rebecca Crew2, Xianfu Wang2 and Feng Wang1*
1Department of Infectious Diseases, China
2Department of Pediatrics, USA
3Department of Gastroenterology, China
4Gansu Province Medical Genetics Center, China
5Department of Hepatobiliary and Pancreatic Surgery, China
6Department of Neurology, China
*Corresponding author:Feng Wang, Department of Infectious Diseases, Jilin 130021, P. R. China
Submission: October 30, 2019 Published: September 30, 2021

ISSN:2637-773XVolume6 Issue3
Abstract
Background: The SW982 cell line has been widely used as an in vitro model in functional and therapeutic studies of Synovial Sarcoma (SS). This cell line was established in 1974, and it is commercially available from the American Type Culture Collection (ATCC). Changes in the cytogenetic profile of the SW982 cell line since its initiation have not been well-established. This study cytogenetically characterized SW982 utilizing multiple techniques, including routine G-banded chromosome analysis, oligonucleotide array Comparative Genomic Hybridization (array CGH), and Fluorescence in Situ Hybridization (FISH).
Results: The SW982 cell line (20 metaphases) exhibited a polyploid karyotype, 90-91, XXXX, der(1)t(1;4)(q10;p10)×2,del(5)(q23q33),dup(7)(q31q35),der(9)t(9;13)(q10;q10)×2,der(9)t(4;9)(q10;p24)×2,der(18)t(18;22)(q23;q13),+20,del(22)(q11.2q12.3),+mar[cp20]. Compared to previous reports, this SW982 cell line exhibited chromosome structural rearrangements and copy number changes.
Conclusion: Accurately determining the genetic changes in the SW892 cell line since its initiation will provide guidance when making genotypic and phenotypic correlations, and for establishing authenticity when it is applied in biological studies.
Keywords: SW982; Synovial sarcoma; FISH; Array CGH; Chromosomal changes
Abbreviations: SS: Synovial Sarcoma; CGH: Comparative Genomic Hybridization; FISH: Fluorescence In Situ Hybridization; ATCC: American Type Culture Collection
Background
Cell lines are used as model systems in cancer research to investigate the molecular mechanisms of tumor development and progression as well as the pharmacologic effects of novel therapies. However, the genomic features of cell lines maintained in long-term culture can change. This genomic instability may contribute to altered gene expression, affect tumorigenicity, and limit the application of investigational results ranging from in vitro studies to translational research.
The SW982 cell line was established by A. Leibovita in 1974 using cells isolated from a surgical specimen from a patient with biphasic Synovial Sarcoma (SS). SS is a malignant mesenchymal neoplasm that accounts for an estimated 5%-10% of all childhood, adolescent and adult soft tissue sarcomas [1-3] and has also been reported in infants in rare cases [4]. SS occurs most frequently in soft tissues around large joints, particularly the knee, but has been found in most areas of the body including the extremities, head, neck, parotid, temporal region, tonsils, cheek, thorax, pleuropulmonary region, chest wall, lumbar spine and heart. SS arises within the abdomen and pelvis, in the esophagus, stomach and small bowel, in the male and female genitourinary tracts including the kidney, prostate and vulvovaginal sites, in both major and minor nerves, and intracranially within the dura and cerebellum [5]. SS is a high-grade aggressive sarcoma with a 5-year survival rate of approximately 60% [6], and a nearly 50% metastatic disease occurrence [7].
Tumor development has been associated with chromosomal abnormalities which involves multiple aberrations including the amplification, deletion, or rearrangement of DNA. Sarcomas are associated with specific chromosomal translocations, most of which have been identified. The fusion genes resulting from these translocations encode chimeric proteins that play a vital role in the biology of the tumor. Fusion between the SS18 gene (also known as the SYT or SSXT gene) located on chromosome 18 and the SSX gene located on the X chromosome results in the expression of the oncogenic SS18-SSX fusion protein, which underlies the pathogenesis of SS. The SS18-SSX fusion protein arises from a specific chromosomal translocation t(X;18) (p11.2; q11.2), which occurs in more than 95% of SS patients. This SS18-SSX fusion protein along with overexpressed proteins such as bcl-2, EGFR and HER-2/neu represent potential molecular targets in SS [8].
Rearrangements in the cytogenetic profile of the SW982 cell line since its initiation may be associated with altered mechanisms and responses to therapeutic agents in in vitro studies. Alternatively, nonrandom rearrangements may facilitate the identification of candidate genes related to SS. The objective of the present study was to authenticate and characterize the genomic features of the SW982 cell line since its initiation using a combination of techniques including conventional G-banding, array Comparative Genomic Hybridization (CGH), and Fluorescence In Situ Hybridization (FISH).
Materials and Methods
Chromosomal anomalies detected by routine G-banded chromosomal analysis, array CGH and FISH were reported according to the International System for Human Cytogenetic Nomenclature (2013).
G-banded chromosome analysis
The synovial sarcoma cell line was purchased from the American Type Culture Collection (ATCC, Lot#: 58317189). The SW982 cell line was cultured in RPMI 1640 medium (Mediatech, Inc., Manassas, VA, USA; Lot#: 14715004) with 14% fetal bovine serum (FBS; GE Healthcare Lifesciences HyClone Laboratories, Inc., Utah, USA), 2% penicillin/streptomycin (Life Technologies, New York, USA), and 2% L-glutamine (Life Technologies) at 37 °C in a humidified atmosphere with 5% CO2. Cells were cultured for a maximum of 5 passages and were then incubated with 1 mg of colcemide (Gibco, Karlsruhe, Germany) for 60 minutes. Cells were released from the culture vessel by trypsinization (trypsin-EDTA 0.05/0.02 w/v) (Biochrome, Berlin, Germany) for 3-5 minutes then placed in a tube for centrifugation (120g for 10 minutes) and incubated in 0.56% KCl hypotonic solution for 20 minutes. Subsequently, cells were fixed four times using a 3:1 methanol– glacial acetic acid fixative solution. The fixed cells were dropped onto slides, which were placed in a Thermotron Drying Chamber (Thermotron Industries, Inc., Holland, MI, USA) set to 22 °C and 45% humidity. Next, the slides were stained with 4% Giemsa Stain (EMD Chemicals, Inc. NJ, USA) and G bands were visualized on a Nikon Eclipse 80i fluorescent microscope. A total of 20 metaphases were analyzed using the CytoVision software (Metasystems, Altlussheim, Germany).
Array comparative genomic hybridization
Array CGH was performed using the Agilent CGH 2X400K format to confirm chromosomal anomalies identified by G-banded chromosome analysis and identify subtle yet significant chromosomal changes that could not be detected on routine cytogenetic assay. Human reference genomic DNA was purchased from Agilent (Agilent Corporation, Santa Clara, CA, USA). Cell line DNA was isolated from confluent cultured cells at the third passage using the Nucleic Acid Isolation System (QuickGene-610L; FUJIFILM Corporation, Tokyo, Japan) according to manufacturer’s protocols. DNA concentration and quality were measured using a Nanodrop1000 (Thermo Fisher Scientific Inc., Wilmington, DE, USA). Reference and cell line DNA were labeled with cyanine 3 (Cy- 3) or cyanine 5 (Cy-5) by random priming (Agilent Corporation). Equal amounts of reference and cell line DNA were mixed and hybridized to an Agilent 2X400K oligo microarray (Agilent Technologies) in Agilent’s microarray hybridization oven (Agilent Technologies). After hybridizing for 40 hours at 67 °C the array was washed and scanned using the NimbleGen MS 200 Microarray Scanner (NimbleGen System Inc., Madison, WI, USA). Agilent’s CytoGenomics 2.7 software (Agilent Technologies) was used for data analysis.
Fluorescence in situ hybridization
The cross-species comparative genomic hybridization colorbanding technique (RxFISH) was performed with multiple DNA probes including the whole chromosome painting probes for all chromosomes and the locus specific identifier probes for EGR1 on 5q31, D7S486 on 7q31, and p16 on 9p21 (Abbott Molecular Inc., Des Plaines, IL, USA) following the manufacturer’s protocols. A total of 100 interphase cells or 20 metaphase cells were analyzed for each probe. Digital images revealing the distribution of specific hybridization signals were processed using CytoVision Software Version Number 7 (Applied Spectral Imaging, Genetix, USA).
Results
G-banded chromosome analysis
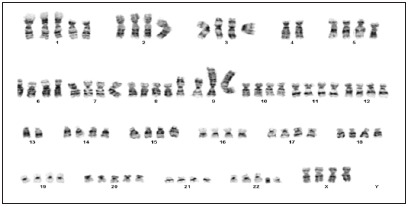
A total of 20 metaphase cells obtained from the SW982 cell line were analyzed and revealed consistent chromosomal anomalies. This SW982 cell line exhibited a polyploid karyotype: 90-91, XXXX, der(1)t(1;4)(q10;p10) ×2, del(5)(q23q33), dup(7)(q31q35), del(9) (p21p23), der(9)t(9;13)(q10;q10)×2, der(9)t(4;9)(q10;p24)×2, der(18)t(18;22)(q23;q13), +20, del(22)( q11.2q12.3), +mar [cp20] (Figure 1). Differences in the karyotype of the SW982 cell line investigated in the present study were compared to previous reports on the karyotype of the SW982 cell line obtained from ATCC (Hyperdiploid; modal number = 48; range = 42 to 58). The rate of higher ploidies was 1.6%. Nine markers were common to all cells, including t (1;4) (1q4p), del (5) (q31q33), der (9) t (4;9) (q10;p24), del(9)(p21p23), t(9;13)(9q13q) and four others. Specifically, double minutes were seen in some cells, two copies of the X chromosome were present, and chromosomes N4, and N13 were consistently single copied.
Figure 1: Representative cytogenetic analysis: 91, XXXX, der (1)t(1;4) (q10; p10) ×2, del (5) (q23q33), dup (7) (q31q35), der(9)t(9;13) (q10;q10)×2, der(9)t(4;9)(q10;p24) ×2, der(18)t(18;22)(q23;q13), +20, del(22)(q11.2q12.3), +mar.
Comparative genomic hybridization
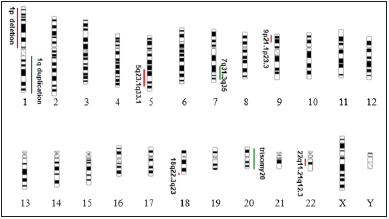
Array CGH confirmed the findings of the G-banded chromosome analysis. Furthermore, array CGH revealed gains that involved part or all of chromosomes 1, 4, 7, 20 and 22, and losses that involved part or all of chromosomes 1, 5, 8, 9, 18 and 22 (Table 1; Figure 2). It should be noted that array CGH results are based upon a diploid control and cannot detect ploidy changes in tetraploidy cell lines such as SW982; therefore, complementary karyotype and FISH data were also considered.
Table 1: Chromosomal losses and gains in the SW982 cell line.
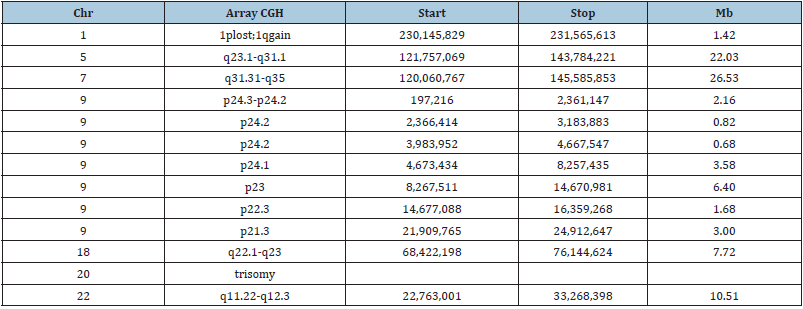
Figure 2: An ideogram summarizing the chromosomal anomalies detected by array CGH. Vertical red lines to the left of the chromosome ideogram indicate chromosomal loss and green lines to the right of the chromosome ideogram indicate chromosomal gain. Heavy green lines indicate segmental amplification
Fluorescence In Situ Hybridization (FISH)
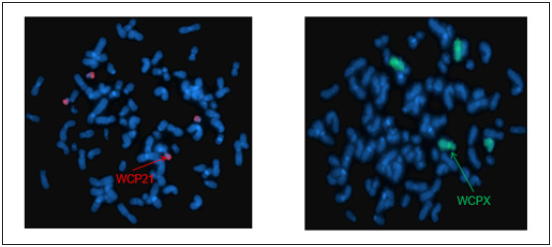
G-banded chromosome analysis and array CGH indicated rearrangements between chromosomes 1 and 4, chromosomes 4 and 9, chromosomes 9 and 13, and chromosomes 18 and 22. Chromosome painting probes confirmed translocations between these chromosome pairs (Figures 3-6). 5q31 deletion was verified using the EGR1 gene and D5S721(5p15.2) probes (Figure 7). 7q31 duplication was verified using the CEP 7 and D7S486(7q31) probes (Figure 8). In addition, complete loss of 9p21.3, 9p23 and 9p24.3, and partial loss of 9p22.3, 9p24.1, 9p24.2-24.1 and 9p24.2 was documented (Figure 9). Other chromosome painting probes have been confirmed, those are consistent with CGHs. (Figures 10-12). Chromosome status was confirmed in 100 cells using locus-specific identifier FISH. (http://www.genome.ucsc.edu).
Figure 3: Whole chromosome painting of chromosomes 1 and 4 revealed derivative chromosome 1 with additional material from chromosome 4p due to translocation der (1) t (1;4) (q10;p10).
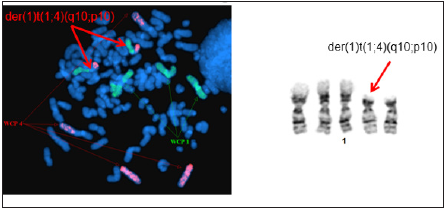
Figure 4: Whole chromosome painting of chromosomes 4 and 9 revealed derivative chromosome 9 with additional material from chromosome 4q due to translocation der (9)t(4;9) (q10; p24).
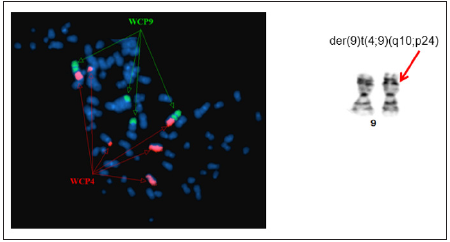
Figure 5: Whole chromosome painting of chromosomes 9 and 13 revealed derivative chromosome 9 with additional material from chromosome 13q due to translocation der (9)t(9;13) (q10; q10).

Figure 6: Whole chromosome painting of chromosomes 18 and 22 and locus specific identifier probes LSI TUPLE1/LSI ARSA revealed derivative chromosome 18 with additional material from chromosome 22q13 due to translocation der (18)t(18;22) (q23; q13).
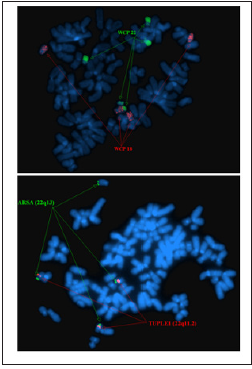
Figure 7: FISH two-color locus probes (EGR1 located in 5q31, and D5S721 located in 5p15.2) revealed a deletion involving 5q31. Array CGH revealed a deletion that involved 5q23.1q33.1.
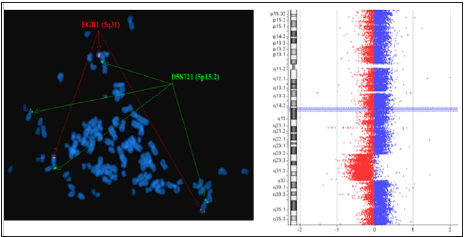
Figure 8: FISH two-color locus probes (D7S486 located in 7q31 and CEP7) revealed a duplication involving 7q31. Array CGH revealed a duplication that involved 7q31.31q35.
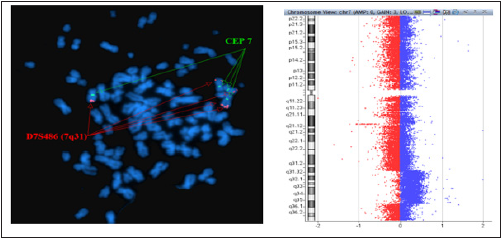
Figure 9: Deletion of the p16 gene located on chromosome 9p21.

Figure 10: Whole chromosome painting 2, 3, 5, 6, 7, 8, 10, 20.
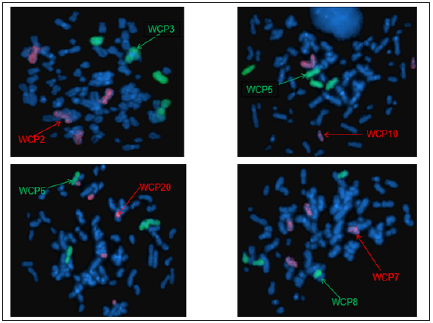
Figure 11: Whole chromosome painting 11, 12, 14, 15, 16, 17, 19.
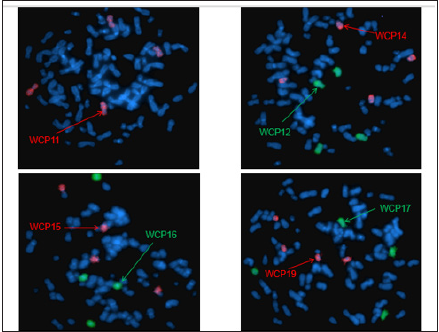
Figure 12: Whole chromosome painting 21, X.
Discussion
The present study authenticated and characterized genomic
features of the SW982 cell line using a combination of conventional
G-banding, array CGH and FISH. Findings indicate this cell line
underwent multiple chromosome rearrangement events since its
establishment and initial characterization. G-banded chromosome
analysis revealed several structural rearrangements and copy
number changes. These findings were corroborated by microarray
CGH, which further identified losses involving chromosomes 1p,
5q, 9p, 18q and 22q, and gains involving chromosomes 1q, 7q
and 20. Cumulatively, more genetic material was lost than gained
(226.96 Mb vs. 156.84 Mb, respectively) as quantified by array
CGH. Alternatively, structural abnormalities of this cell line were
analyzed using RxFISH. This comprehensive molecular cytogenetic
study revealed allelic gains and losses in regions containing tumor
suppressor genes and oncogenes that play vital roles in tumor
development [9,10].
The findings of the present study are in accordance with
previous reports of genotype alterations following culture of
immortalized cell line [11,12]. Generating stable cell lines is essential
for studying the structure and function of recombinant proteins.
However, established continuous cell lines can become unstable
and possibly contaminated. The SW982 cell line investigated in the
present study showed chromosome 1 rearrangements in all cells,
specifically consisting of chromosome 1p loss and 1q gain. Previous
reports have indicated that 1p deletion defines a subset of cellular
leiomyomata [13] and primary alveolar rhabdomyosarcoma
[14]. In particular, loss of 1p36 has been found in various types
of cancer. Genes within this region include CMM1 and SDHB,
tumor suppressor genes with important roles in tumorigenesis.
Furthermore, evidence implicates CMM1 in melanoma [15] and
SDHB in breast cancer [16]. To the authors’ knowledge, there are
no reports on the effects of chromosome 1 rearrangements in SS.
There was a partial loss of chromosome 5q (q23.2q31.3) that
was approximately 22 Mb in size. This deleted region includes many
genes, including the tumor suppressor genes TNFAIP8, LOX, IRF1,
EGR1 and RAD50, which are downregulated in SS and other tumor
types [17-19]. The EGR1 gene located in 5q31.2 is an important
suppressor gene in multiple tumor types, and decreased EGR1
levels have been correlated with tumor formation and invasion [20-
22]. Previous reports have suggested that EGR1 is downregulated
in SS [23]. The fusion between SS18 (also known as SYT or SSXT)
located on chromosome 18 and SSX located on the X chromosome
is the hallmark of SS, resulting in the expression of the oncogenic
SS18-SSX fusion protein, which is found in >95% all of SS cases [24].
In SS, EGR1 expression is repressed by the SS18-SSX fusion protein.
Interestingly, although the translocation between chromosomes
X and 18 was not present in the SW982 cell line investigated in
present study, there was a deletion at 5q31.2.
Chromosome 9 imbalances were very prominent in the SW982
cell line. Deletions of chromosome 9p have been observed in many
human tumors and cell lines [25,26]. Array CGH revealed that the
size of the losses varied in different regions of chromosome 9p.
There were total deletions at chromosome 9p21.3, 9p23 and 9p24.3,
and partial deletions at 9p22.3, 9p24.1 and 9p24.2. Furthermore,
p16INK4A(CDKN2A) located in 9p21.3 is a key tumor suppressor
gene in SS and encodes two alternatively spliced proteins: p16 and
p14ARF. Both proteins affect the pRB and p53 pathways in cell cycle
progression [27].
In addition, there was a partial gain involving chromosome 7.
Several proto-oncogenes such as MET, WNT2, ZNF312B and BRAF
are located on 7q31-q35 [11]. Notably, BRAF may play a minor role
in SS [28]. Finally, partial deletion of chromosome 22 and trisomy
chromosome 20 were also detected.
Conclusion
In conclusion, the chromosomal aberrations in the SW982 cell line investigated in the present study were effectively analyzed using a combination of G-banded chromosome analysis, array CGH and FISH. There were multiple differences compared to the genomic features of the SW982 cell line reported at its initiation. Significantly, candidate genes related to SS may be isolated from the nonrandomly rearranged regions identified in the present study.
References
- Shi W, Indelicato DJ, Morris CG, Scarborough MT, Gibbs CP, et al. (2013) Long-term treatment outcomes for patients with synovial sarcoma: a 40-year experience at the University of Florida. Am J Clin Oncol 36(1): 83-88.
- Herzog CE (2005) Overview of sarcomas in the adolescent and young adult population. J Pediatr Hematol Oncol 27(4): 215-218.
- Sultan I, Rodriguez-Galindo C, Saab R, Yasir S, Casanova M, et al. (2009) Comparing children and adults with synovial sarcoma in the Surveillance, Epidemiology, and End Results program, 1983 to 2005: An analysis of 1268 patients. Cancer 115(15): 3537-3547.
- Duband S, Morrison AL, Pasquier D, Coindre JM, Pasquier B, et al. (2008) First case report of a fetal synovial sarcoma confirmed by molecular detection of SYT-SSX fusion gene transcripts. Am J Perinatol 25(8): 517-520.
- Xiao GY, Pan BC, Tian XY, Li Y, Li B, et al. (2014) Synovial sarcoma in cerebellum: A case report and literature review. Brain Tumor Pathol 31(1): 68-75.
- Bergh P, Meis-Kindblom JM, Gherlinzoni F, Berlin O, Bacchini P, et al. (1999) Synovial sarcoma: Identification of low and high-risk groups. Cancer 85(12): 2596-2607.
- Sandberg AA, Bridge JA (2003) Updates on the cytogenetics and molecular genetics of bone and soft tissue tumors: chondrosarcoma and other cartilaginous neoplasms. Cancer Genet Cytogenet 143(1):1-31.
- Albritton KH, Randall RL (2005) Prospects for targeted therapy of synovial sarcoma. J Pediatr Hematol Oncol 27(4): 219-222.
- Wong N, Lai P, Lee SW, Fan S, Pang E, et al. (1999) Assessment of genetic changes in hepatocellular carcinoma by comparative genomic hybridization analysis: relationship to disease stage, tumor size, and cirrhosis. Am J Pathol 154(1): 37-43.
- Becerikli M, Jacobsen F, Rittig A, Kohne W, Nambiar S, et al. (2013) Growth rate of late passage sarcoma cells is independent of epigenetic events but dependent on the amount of chromosomal aberrations. Exp Cell Res 319(12): 1724-1731.
- Hwang HJ, Kim GJ, Lee GB, Oh JT, Chun YH, et al. (2003) A comprehensive karyotypic analysis on Korean hepatocellular carcinoma cell lines by cross-species color banding and comparative genomic hybridization. Cancer Genet Cytogenet 141(2): 128-137.
- Karpova MB, Schoumans J, Blennow E, Ernberg I, Henter JI, et al. (2006) Combined spectral karyotyping, comparative genomic hybridization, and in vitro apoptyping of a panel of Burkitt's lymphoma-derived B cell lines reveals an unexpected complexity of chromosomal aberrations and a recurrence of specific abnormalities in chemoresistant cell lines. Int J Oncol 28(3): 605-617.
- Hodge JC, Pearce KE, Clayton AC, Taran FA, Stewart EA (2014) Uterine cellular leiomyomata with chromosome 1p deletions represent a distinct entity. Am J Obstet Gynecol 210(6): 572.e1-7.
- Li QX, Li F, Zhang W, Liu X, Ma YQ, et al. (2009) Profile of chromosomal imbalances in 10 cases of primary alveolar rhabdomyosarcoma analyzed by comparative genomic hybridization. Zhonghua Zhong Liu Za Zhi 31(8): 571-576.
- Ohashi E, Hong SH, Takahashi T, Nakagawa T, Mochizuki M, et al. (2001) Effect of retinoids on growth inhibition of two canine melanoma cell lines. J Vet Med Sci 63(1): 83-86.
- Lee J, Wang J, Torbenson M, Lu Y, Liu QZ, et al. (2010) Loss of SDHB and NF1 genes in a malignant phyllodes tumor of the breast as detected by oligo-array comparative genomic hybridization. Cancer Genet Cytogenet 196(2): 179-183.
- Buchinger B, Spitzer S, Karlic H, Klaushofer K, Varga F (2008) Lysyl oxidase (LOX) mRNA expression and genes of the differentiated osteoblastic phenotype are upregulated in human osteosarcoma cells by suramin. Cancer Lett 265(1): 45-54.
- Lefevre SH, Coquelle A, Gonin-Laurent N, Cor A, Vogt N, et al. (2005) Non-homologous end-joining genes are not inactivated in human radiation-induced sarcomas with genomic instability. J Radiat Res 46(2): 223-231.
- Nascimento FR, Gomes EA, Russo M, Lepique AP (2015) Interferon regulatory factor (IRF)-1 is a master regulator of the cross talk between macrophages and L929 fibrosarcoma cells for nitric oxide dependent tumoricidal activity. PLoS One 10(2): e0117782.
- Das A, Chendil D, Dey S, Mohiuddin M, Mohiuddin M, et al. (2001) Ionizing radiation down-regulates p53 protein in primary Egr-1-/- mouse embryonic fibroblast cells causing enhanced resistance to apoptosis. J Biol Chem 276(5): 3279-386.
- de Belle I, Huang RP, Fan Y, Liu C, Mercola D, et al. (1999) p53 and Egr-1 additively suppress transformed growth in HT1080 cells but Egr-1 counteracts p53-dependent apoptosis. Oncogene 18(24): 3633-3642.
- Ferraro B, Bepler G, Sharma S, Cantor A, Haura EB (2005) EGR1 predicts PTEN and survival in patients with non-small-cell lung cancer. J Clin Oncol 23(9): 1921-1926.
- Lubieniecka JM, de Bruijn DR, Su L, van Dijk AH, Subramanian S, et al. (2008) Histone deacetylase inhibitors reverse SS18-SSX-mediated polycomb silencing of the tumor suppressor early growth response 1 in synovial sarcoma. Cancer Res 68(11): 4303-4310.
- Sandberg AA, Bridge JA (2002) Updates on the cytogenetics and molecular genetics of bone and soft tissue tumors. Synovial sarcoma. Cancer Genet Cytogenet 133(1): 1-23.
- Kamb A, Gruis NA, Weaver-Feldhaus J, Liu Q, Harshman K, et al. (1994) A cell cycle regulator potentially involved in genesis of many tumor types. Science 264(5157): 436-440.
- Nobori T, Miura K, Wu DJ, Lois A, Takabayashi K, et al. (1994) Deletions of the cyclin-dependent kinase-4 inhibitor gene in multiple human cancers. Nature 368(6473): 753-756.
- Subramaniam MM, Noguera R, Piqueras M, Navarro S, Lopez-Guerrero JA, et al. (2006) p16INK4A (CDKN2A) gene deletion is a frequent genetic event in synovial sarcomas. Am J Clin Pathol 126(6): 866-874.
- Teng HW, Wang HW, Chen WM, Chao TC, Hsieh YY, et al. (2011) Prevalence and prognostic influence of genomic changes of EGFR pathway markers in synovial sarcoma. J Surg Oncol 103(8): 773-781.
© 2021. Feng Wang. This is an open access article distributed under the terms of the Creative Commons Attribution License , which permits unrestricted use, distribution, and build upon your work non-commercially.
 a Creative Commons Attribution 4.0 International License. Based on a work at www.crimsonpublishers.com.
Best viewed in


.jpg)


 Editorial Board Registrations
 Submit your Article
 Refer a Friend
 Advertise With Us
.jpg)


.jpg)


.bmp)
.jpg)
.png)
.jpg)


.jpg)


.png)

.png)


.png)


