- Submissions

Full Text
Modern Concepts & Developments in Agronomy
Three-Way Multivariate Analysis for the Characterization of Plant Genetic Resources
Sergio J Bramardi*
Department of Statistics, National Universyty of Comahue, Argentina
*Corresponding author:Sergio J Bramardi, Departamento de Estadística, Universidad Nacional del Comahue (UNCo) y Centro de Investigaciones en Toxicología Ambiental y Agrobiotecnología del Comahue (CITAAC) - CONICET-UNCo. Argentina
Submission: April 05, 2023;Published: April 14, 2023

ISSN 2637-7659Volume12 Issue 5
Abstract
The main purpose of Germplasm Banks is to secure a wide diversity of crop plants, including their wild relatives and lesser-used species, in accessible conservation systems. They also aim to increase the possibilities of plant breeding and seed supply worldwide in order to meet the challenges of climate change and food demand. In this way, the continuous availability of plant genetic resources for research, technological development, reproduction and improvement of the seed supply for a sustainable agricultural system is ensured. For the analysis of these databases, a large number of statistical methods are available, which are not all known and do not always respond to the researcher’s needs. This article reviews the main methods of Three-Way Multivariate Analysis, presenting its advantages and disadvantages depending on the study situation. These results are based on research projects and postgraduate theses supervised from the Department of Statistics of the National University of Comahue, Patagonia Argentina.
Keywords:Germplasm bank; Three mode data analysis; Multiway set of data structure; Genotype-environment interaction; Agronomic and molecular characters
Introduction
Since the publication of the founding experiments of Gregor Mendel in 1866, the interpretation of genetic data has constituted a stimulus for the proposal, development and adaptation of statistical theories and techniques. Genetics and Biometrics have evolved together during the 20th century and have faced new challenges in data analysis since the beginning of the 21st century.
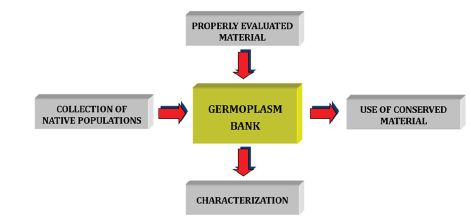
Figure 1:Flowchart of a germplasm bank.

Every day local varieties are no longer cultivated and even become extinct as they are replaced by new ones that are generally better adapted to modern agriculture and, above all,more profitable. Over the years this has caused a process of erosion of genetic diversity that today wants to be reversed. To this end, Germplasm Banks have been established where native populations of most plant species used by man and their related species are preserved. So that these Germplasm Banks do not become simple reservoirs of material, it must be duly evaluated and characterized for its use by geneticists in the search for material for plant improvement processes (Figure 1).
Four key stages are presented in a process of characterization of a Germplasm Bank in which the classic methods of Multivariate Analysis apply to matrices of “n” individuals by “p” variables, that is, with “two-way” data of order “n x p”, which are no longer enough to explore the estructure of these databases:
A. In the study of phenotypic, morphological and agronomic
descriptors on which the influence of environmental factors is
feasible, forcing the registration of characters to be repeated over
time and in different environments.
B. In the joint characterization of agro-morphological and
molecular characters.
C. In the unification in a single analysis of the results from
different characterization trials in which the material from a
germplasm bank is subdivided, generally in the order of thousands,
to make it experimentally manageable and finally.
D. When it is desired to establish relationships between the
characterization of plant material and the geographical and/or
ecological-environmental place from which they come.
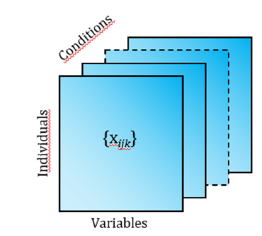
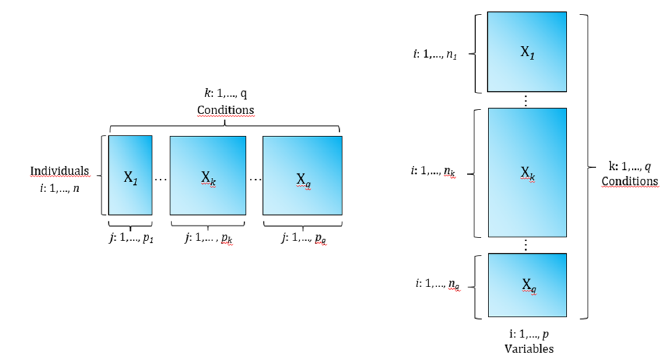
In all these situations, the observations of the variables have been made under different modalities or moments in time or space, that is, in “q” different conditions, that are called ‘three-way’ data. In some cases, there is a two-way data table for each situation or moment; therefore, the information can be represented by q matrices of order “n x p”. As it is also possible to concentrate the information coming from the different tables in a single matrix of order “n x p x q” where each element represents the observation originated by three completely crossed modes: individuals, variables and conditions. Thus, a cubic matrix or table of three entries is constituted, whose generic element is {xijk} with i = 1,... , n; j = 1,...,p and k = 1,...,q. In these cases, the three-way data is called Three-Mode Data [1] (Figure 2). On the other hand, one of the ways can be made up of different data sets; for example, that in each condition different groups of variables are recorded for the same individuals, or that in each condition the same variables are measured for different groups of individuals. These structures are called Multiway Set of Data (Figure 3).
Figure 2:Three-mode data structure.

Figure 3:Multiway set of data structure.
a) in each condition different groups of variables are recorded for the same individuals.
b) in each condition the same variables are measured for different groups of individuals.

The extra mode in these designs requires an extension of the classical techniques for its analysis. It is possible, of course, to model the data in the simple “two-way” format, rearranging it into rectangular arrays, but this implies losing a part of the information that could be very important to understand the organization of the data as a whole. In many cases, it is also insufficient to resort to a measure of distance or similarity common to all the variables on which to apply an appropriate ordering or classification method, such as the Gower General Similarity Coefficient [2] or the Escofier Discretization [3].
The objective of this article is to briefly report the experience of interdisciplinary and inter-institutional work developed by the Department of Statistics of the National University of Comahue using these techniques applied to the treatment of empirical and simulated data corresponding to the characterization of Plant Genetic Resources in Banks of Germplasm and comparing them with the classical techniques used by geneticists, as well as highlighting their virtues and disadvantages.
Basic Concepts
The problem of analyzing this type of data has been faced by two different schools. The French-Spanish school with the STATIS method (Structuration de Tableaux A Trois Indices de la Statisque) [4,5], Multiple Factor Analysis (MFA) [6] and Meta Biplot [7], to name the most representative. On the other hand, in the Anglo- Saxon school we find Three-Mode Principal Components Analysis (ACP-3mode) [8] and Generalized Procrustes Analysis (GPA) [9] as its main exponents. The theoretical foundations of these methods are dissimilar, as are their mathematical properties and procedures for their application. However, almost all present a stage of analysis of the interrelationships of the three ways, and then to culminate the treatment of the data with some form of construction of a consensus or compromise structure of the individuals. To obtain this consensus configuration, most of the methods are based on the Singular Value Decomposition (SVD) of a rectangular data table. Some use the Two Way DVS by juxtaposing or collapsing the initial weighted matrices and treating them as if they were two ways, this is the case of the STATIS method and Multiple Factor Analysis. Other methods use a Two-Way DVS in each of the q initial tables and integrate the resulting configurations, such as Meta-Biplots. Finally, there are the methods that use the Three-Way DVS, concatenating the cross-product matrices corresponding to the initial configurations. As a classic example of this methodology, it can be mentioned the Three-Mode Principal Component Analysis. The Generalized Procrustes Analysis deserves a separate mention, since it is an entirely geometric technique that proposes the harmonization of different configurations of the same set of individuals through a series of iterative steps that include translation, rotation, and scaling of the data under two criteria: that the distances between individuals in the original configurations be maintained and that the sum of squares between analogous points be minimized, that is, corresponding to the same element in the different configurations.
Conclusions
Regarding the quantitative morphological and agronomic characterization of a set of populations in different environments, it is important to highlight that if the objective is to find the ‘average’ relationships between accessions, studies of empirical and simulated data have shown that performing a Principal Component Analysis on the mean of the environments gives similar results to the use of three-mode methods such as PGA, PCA-3modes or MFA [10-13], even when there is a moderate genotype-environment interaction. But if the intention is also to study this genotypeenvironment interaction, the three-mode methods are widely advantageous. The PGA allows to clearly visualize the genotypeenvironment interaction and quantify it at the individual level through an ANOVA. The MFA also analyzes the variable-environment interaction, that is, discriminating which variables are responsible for the genotype-environment interaction. Both methods are found in several statistical packages and in particular the FactoMineR [14] R library, which is free to access and easy to implement. The PCA-3modes performs a very detailed analysis of the interaction. There are even authors who have called it a multivariate extension of the Additive Main effects and Multiplicative Interactions (AMMI) models [15]. But its interpretation is not easy [16], and there is few software that do this, among them the R package tuckerR.mmgg [17]. The Escoufier Vectorial Correlation Coefficient (Rv) [18], which determines whether two configurations (scalar products) provide a similar image of individuals, taking values between zero (no similarity between the configurations) and one (the configurations are homothetic), can be used to quantify the degree of multivariate genotype-environment interaction [13].
For the simultaneous agro-morphological and molecular characterization, the APG is an excellent alternative since, depending on the molecular marker used, it allows resorting to the most appropriate distance measure for that situation. The subsequent ANOVA makes it easier to analyze the discrepancy between both characterizations at the individual level, beyond the widely used Mantel test [19], which measures the degree of general association between the two configurations. We have used a simpler method to obtain the divergence between two analogous points: to calculate the Euclidean distance between the pairs of points obtained from both ordinations [20]. This option can also be used with FMA in case the chi-square distance could be applied to the coding of the molecular markers.
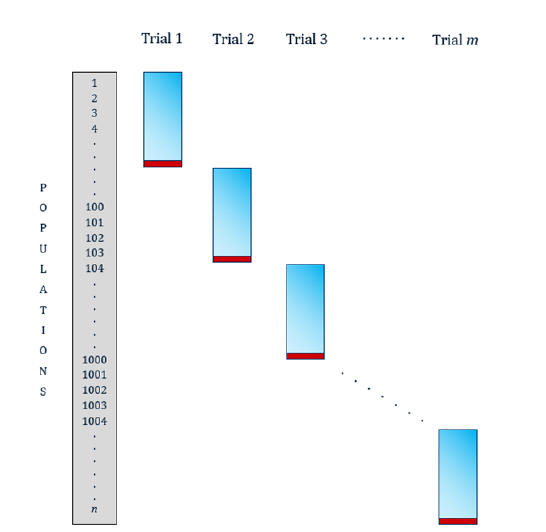
In field evaluation of large germplasm collections, the experimental material must be divided into manageable experimental trials. In each trial, a set of entries is evaluated by several descriptors. The sets of individuals are different between trials, but an important characteristic of this design is the presence of a certain number of entries involved in all trials, which are used as connections between them (Figure 4).
Figure 4:Connected incomplete trials structure (in red, control populations of connection).

The information obtained from these trials is presented by incomplete matrices, because not all individuals are evaluated in all the conditions (trials) [21]. Traditionally, a mixed lineal model is fitted that considers the trial effect, environment effect, entries effect and their interactions. The variability provided by these effects is estimated and removed from the observed value for each entry by each variable, leaving only the effect due to different genotypes. Then, with the data free from the variability responsible for this particular way of approaching the experimental tests, they proceed to grouping the populations by their genetic similarities or differences using a classic multivariate analysis [22,23]. These models have a high degree of unbalance and empty cells in the interactions. This situation complicates the estimation of the effects and it is a univariate approach, which does not consider the structure of relationships between the variables in each dataset. Generalized Procrustes Analysis for Connected Incomplete Trials [21,24] solves these problems and allows the entire database to be studied jointly.
Finally, to quantify the relationship between agro-morphological and/or molecular characterization with geographic dispersion, the Mantel test is usually used between the Euclidean distances of the individuals in the configuration resulting from the characterization and the geographic distances between the places where they were collected. The PGA will be able to give a more detailed visualization of the discrepancies or similarities between both configurations at the accession level.
Acknowledgement
Special thanks to Dra. Marta Zanelli, Dra. Andrea Lavalle and M.Sc. Laura Lamfre for their contributions and review of the text. To the researchers and thesis student, where most of the material exposed in this article came from. To the Secretary of Science and Technology of the National University of Comahue for financial support and to the National Institute of Agricultural Technology (INTA) where the characterization trials were carried out.
References
- Kroonenberg M (2008) Applied multiway data analysis. John Wiley and Sons, New Jersey, USA, p.559.
- Gower JC (1971) A general coefficient of similarity and some of its properties. Biometrics 27(4): 857-874.
- Escofier B, Pagès J (1998) Simple and multiple factor analyses: objectives, methods and interpretation. Dunod, France, p. 328.
- Hermier Plantes (1976) Structuring of tables with three indices of statistics: Theory and application of a method of conjoint analysis. PhD. Thesis, University of Sciences and Techniques of Languedoc, France.
- Lavit C (1988) Joint Analysis of Quantitative Tables. Dunod, France, p.253.
- Escofier B (1979) Traitement simultané de variables qualitatives et quantitatives en analyse factorielle. Les cahiers de l’analyse des données 4: 137-146.
- Martín J, Galindo P, Vicente J (2002) Comparison and integration of subspaces from a biplot perspective. J Stat Plan Inference 102(2): 411-423.
- Tucker LR (1966) Some mathematical notes on three mode factor aná Psychometrika 31: 279-311.
- Gower JC (1975) Generalized procrustes analysis. Psychometrika 40: 33-51.
- Bramardi S, Lavalle A, Reeb P, Defacio R, Gonzalez C, et al. (2010) Comparative study of methods of three-way data analysis for characterization of plant genetic resources evaluated in different environments. XXV International Biometric Conference, Florianópolis, SC, Brasil.
- Zuliani P, Lavalle A, Bramardi S, Defacio R (2012) Maize landraces characterization using generalized procrustes analysis and multiple factor analysis. Rev FCA UNCuyo 44(1): 49-64.
- Zuliani R, Fuentealba J, Lavalle A, Bramardi, S (2013) Analysis of the representation spaces of the Multiple Factorial Analysis, STATIS and Generalized Procrustean Analysis from an application in the field of agronomy. IV Ibero-American Meeting of Biometrics. Mar del Plata, Argentina.
- Zuliani P, Defacio R, Lavalle A Bramardi (2018) Comparison of multivariate analysis techniques by simulation to characterize plant genetic resources in terms of characters which are susceptible to genotype environment interaction. FAVE - Ciencias Agrarias 17 (1): 75-86.
- Lê S, Josse J, Husson (2008) FactoMineR: An R package for multivariate analysis. J Stat Softw 25(1): 1-18.
- Varela M, Vicente JL, Galindo P, Blázquez A, Castillo JG, et al. (2008) Una generalización de los modelos AMMI basada en el algoritmo de tuckals3 para el Análisis de Componentes Principales de Tres Modos. Cultivos Tropicales 29(1): 69-72.
- Marticorena M, Bramardi S, Defacio R (2010) Characterization of maize populations in different environmental conditions by means of Three Mode Principal Components Analysis. Cien Inv Agr 37(3): 91-103.
- Marticorena M, Gimenez G, Bramardi S (2017) CRAN (the Comprehensive R Archive Network), Package 'tucker R.mmgg: Three-Mode Principal Components Analysis. R package version 1.5.0'.
- Escoufier Y (1973) Le traitement des variables vectorielles. Biometrics 29(4): 751-760.
- Mantel N (1967) The detection of disease clustering and a generalized regression approach. Cancer Res 27:209-220.
- Bramardi S, Bernet G, Ansis MJ, Carbonell EA (2005) Simultaneous agronomic and molecular of genotypes via the generalised analysis procrustes analysis: an application to varieties of cucumber. Crop Sci 45(4):1603-1609.
- Lavalle A, Bramardi S (2016) An algorithm based on generalized Procrustes analysis to find the consensus of several configurations of individuals connected by common checks. Adv Appl Stat 49(1): 31-48.
- Taba S, Díaz J, Franco J, Crossa J (1998) Evaluation of Caribbean maize accession to develop a care subset. Crop Science 38(5): 1378-1386.
- Reeb P, Bramardi S, Defacio R (2007) Estimation and treatment of the environment effect and its interactions in the characterization of Genetic Resources in a Germplasm Bank. XI Spanish Biometric Conference and First Biometric Meeting of Iberian and Latin American Countries, Salamanca, Spain.
- Lavalle A, Defacio R, M, Bramardi (2021) Methodological proposal for the characterization of accessions in germplasm banks using generalized procrustes analysis applied to incomplete but connected trials. Rev FCA UNCuyo 53(1): 35-45.
© 2023 Sergio J Bramardi. This is an open access article distributed under the terms of the Creative Commons Attribution License , which permits unrestricted use, distribution, and build upon your work non-commercially.
 a Creative Commons Attribution 4.0 International License. Based on a work at www.crimsonpublishers.com.
Best viewed in


.jpg)


 Editorial Board Registrations
 Submit your Article
 Refer a Friend
 Advertise With Us
.jpg)


.jpg)


.bmp)
.jpg)
.png)
.jpg)


.jpg)


.png)

.png)


.png)


