
- About Us
- Information
-

The Author ensures that the research has been conducted responsibly and ethically with adherence to all relevant regulations. read more..
- For Authors
- For Reviewer
- Manuscript Guidelines
- Membership
- Publication Ethics
-
- Journals
- Reprints
- e-Books
- Videos
- Policies
- Contact Us
 COVID-19
- Submissions


Full Text
Modern Concepts & Developments in Agronomy
Structural and Demographic Characterization of Crête-Brûlée Forest Species, 4th Mirebalais Municipal Section, Haiti
Valdimir Vincent1,4,5, Agustín Gallegos Rodríguez3, Efrén Hernández Álvarez3, James Policier1, Nahum Lafleur4, Andy Barthélemy5 and Bayron Alexander Ruiz Blandon2,3*
1Ministry of Agriculture, Natural Resources and Rural Development of Haiti, Haiti
2Department of Botany and Zoology, University of Guadalajara, University Center for Biological and Agricultural Sciences, Mexico
3Department of Forest Production, University of Guadalajara, University Center for Biological and Agricultural Sciences (UCBAS), Mexico
4Central Public University of Haiti, Haiti
5University Central of the Americas of Haiti, Haiti
*Corresponding author: Bayron Alexander Ruiz Blandon, Department of Botany and Zoology, University of Guadalajara, University Center for Biological and Agricultural Sciences, Mexico
Submission: December 11, 2021 Published: January 20, 2022

ISSN 2637-7659Volume10 Issue 2
Abstract
This is a study based on the structural and demographic characterization of crested-burnt forest species, 4th communal section of Mirebalais would reveal of capital importance for the conservation of biodiversity and the attenuation of the mitigation of climate change. Dendrometry inventory was carried out through fixed surface plots or 100m x 100m quadrats systematically placed on transects. A total of 15 plots were surveyed for the study. Trees ≥3cm in diameter were measured at 1.30m (DBH) and at 30cm for multi-stemmed shrubs. Trees with diameters <3cm were considered to be regeneration. In fact, the total height was measured by the method of aiming with a clinometer. The nomenclature used to classify species and families is APG IV. The results showed that the study area has a partial species richness of 40 species divided into 39 genera and 24 families. Floristic analysis showed that the Fabaceae family was the most representative with 11 species. The actual density (Dr) of trees varies from 30±85 trees/ ha-1 while the regenerating density (Nr) of trees oscillates from 0.025±0.64 trees / ha-1. The diametric structure exhibited a dominance of trees of small diameters, on the other hand, for the vertical structure it was found that as the height classes increase, the trees of large sizes become more and more rare. The correlation coefficient between the height and the diameter is very low with R2 between 0.5%±20%. In addition, the Shannon index oscillated by 2.19±2.59 bits. Furthermore, Piélou’s fairness varies from 0.71±0.79. Also, the specific quotient is 1.02. Macrophanerophytes are the most dominant biological types. Furthermore, the Jaccard index (PJ) is between 14.28±21.43. Finally, the Hamming distance (H) in turn oscillates by 79.07±85.72.
Keywords: Characterization; DBH; Dendrometry; Diversity; Structure; Woody
Introduction
The changes brought about by the planet earth are becoming our main concern for the conservation of natural heritage and the monitoring of the evolution of ecosystems. All the more so, in 2004, specialists even set the deadline for the total desertification of Haiti at fifteen years, [1].
Despite the obvious degradation of terrestrial ecosystems in Haiti due to anthropogenic factors, the study on woody vegetation, which should be at the forefront, is still poorly understood in many of its components. Deforestation and its corollaries challenge more than one, but the wills and concrete actions on the part of state and civil authorities are not yet sufficient to stem this harmful phenomenon which has social, historical and economic determinants that cannot be neglect in the fight for the reforestation of the country, [1].
In recent years, Crête-Brûlée has seen a significant increase in deforestation, which is why this study, which aims to be avant-garde, comes at the right time and aims to take stock of the availability of woody trees in the 4th section for management.
sustainable through monitoring of their condition, through effective methods of structural and demographic analysis of the latter; the plant structure is interested in both the distribution and dynamics of species, dendro-metric characteristics (diameters, height, age, etc.), stratification and coverage [2]. The description of the individual characteristics of the stems and the identification of the strata constitutes parameters for evaluating the stability, degradation or limitation of the resilience of stands [2]. It is in this perspective that this study falls within the scope of the structural and demographic characterization of woody forests at Crête-Brûlée, which will provide the information necessary for the reconstitution, sustainable and rational management of the forests. woody forests in the area.
Material and Methods
Research method
The data collected on the various parameters of the study (qualitative and quantitative) were carried out according to the procedure described by [3], on the measurement of forest stands.
Research direction
Firstly, 3 transects of 10,000m long each were established to which is added a strip of 500m on either side of the line of the transect, i.e., 1,000m in width. Second, along each transect, square plots (100m x 100m (10,000m2), 2,000m equidistant along an enthronization gradient were arranged. The plots were georeferenced. A total of 15 plots was prospected during the study at the rate of 5 plots per transect. Section The first plots were chosen at random.
A dendrometric inventory was carried out in each plot; diameter was measured from trunk to chest height (DBH) or 1.30m for trees and 30cm for multi-stemmed shrubs. These measurements concern individuals with a diameter greater than or equal to 3cm. On the other hand, those with diameters less than 3cm were considered to be regeneration [4]. However, the total height is obtained using a clinometer by the sighting method [5]. The botanical nomenclature used for species and families is that of the Angiosperm Phylogenetic Classification group [6].
The actual density which is the number of individuals per unit area (trees/ha-1) was calculated by the ratio of the area of one hectare (10,000m²) to the square of the average distance between trees (dm), [7].
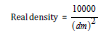
Dm: represents the average distance between trees (m); 10,000: this is the area of a square with a side of 100m = 10,000m² =1ha
The regeneration density (Nr) is expressed in stems per hectare (Stems/ha) by the following formula [8]:

nr=total number of stems with a diameter of less than 3cm recorded in the plot and s=area of the plot in hectares.
Then, a frequency analysis was carried out to assess the distribution of different species found in the study area and it is expressed as a percentage (%), estimated by the following formula [9].

Frequency of presence expressed as a percentage (%), Nri: number of records or species i and Nr: total number of records.
Distribution by diameter and height class of forest woody trees: All individuals with a diameter greater than 3cm of all the species recorded were divided into classes with a diameter of 10cm amplitude. The types of stems represent a particular classification of individuals according to height [1]. The height class of individuals greater than 0.5m were distributed by height class with an amplitude of 5m [2].
Shannon-Weaver index (H’): used to assess species diversity within transects and is calculated by the following formula [9].
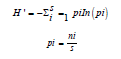
H’: Shannon index.
i: species of the study environment.
Pi: Proportion of a species i in relation to the total number of
species (s), equal to ni / N, where ni is the number of individuals
of species i.
N: total number of individuals of all species.
Grace with Equitability of [10], it was observed through the
transects whether there is a dominance of any species.

Jaccard index (PJ) and Hamming distance (H) The heterogeneity of the transects was evaluated from the Jaccard coefficient of floristic similarity, associated with the Hamming distance (H). The Jaccard coefficient of similarity makes it possible to compare the transects. It is calculated according to the following formula.
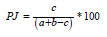
Where PJ is the Jaccard coefficient of floristic similarity.
a: the number of species from the list in medium a.
b: the number of species from the list in middle b.
c: the number of species common to the two environments [11].
Result
Inventory of forest species
Analysis of the floristic data from the 15 plots at Crête-Brûlée showed that the flora has a specific richness of 40 species grouped into 39 genera and 24 families. It appears from Table 1 that the most represented families are the Fabaceae with 11 species which accounted for (27.5%) of the total number (40 species), the Meliaceae with 4 species which represent (10%), the Anacardiaceae, the Bignoniaceae and Myrtaceae each with 2 species which showed a percentage of 5% each of the aforementioned families. And finally, other families such as Burseraceae, Bombaceae, Euphorbiaceae, Capparaceae, Apocynaceae, Moraceae, Urticaceae, Malvaceae, Simarubaceae are represented by a single species.
Table 1: Distribution of botanical families and species encountered at Crête-Brûlée.

The density of forest species
The actual density (Dr) for trees whose diameters are >3cm (Table 2), we obtained densities which vary from 30±85 trees/ha. It was also noted that TS1 has better actual density compared to other transects. On the other hand, for the regeneration density (Nr) or of the stems of the future, those with diameters <3cm, the variation was made at the level of the three transects of 0.025±0.64. TS3 was found to have better regeneration density than other transects.
Table 2: The density of the forest diversity.

Diameter of forest species in TS1
The TS1 has passed through several localities, it leaves from La Bastille to reach Bois l’Etat via Décès, Trianon, Nogode, Crête- Brûlée, Manyan, Saintonge, Bois Marseille and Dejalus. Analysis of the histogram in Figure 1 showed a predominance of trees of diameter class [10 20] which accounted for 21.83% of the 229 trees. Trees recorded at the level of 5 plots followed by class [20 30] which represents 18.77%.
Figure 1: TS1 Stems diameter class.

Diameter of the forest species in TS2
The localities forming TS2 are: Lavelanèt, Meye, Dosan, Bresète, Loss and Domon. It was observed in Figure 2 that in the previous localities that the rods of the diameter class [10 20] are in the majority. For the 193 trees listed, 57 are in this class, it showed a percentage of 29.53%. In contrast, Diameter class [80 90] with only 2 shafts is the class that contains the smallest amount of shafts for TS2. It occupied only 1.04% of the total workforce.
Figure 2: TS2 stems diameter class.

Diameter of the forest species in TS3
The TS3 started at Cholette to end at Calebasse via Debrica, Sens, Laou, Morne Lae, Merson, Barot Calavène. Figure 3 showed a preponderance of trees in the diameter classes [10 20] and [20 30] for a respective value of 65 and 75 trees which represents 28.63% and 33.04% of the 227 trees listed for TS3. The least badly endowed class is that of [80 90] with 0 individuals. It was also found as the diameter classes increase the trees of large diameters decrease.
Figure 3: TS3 stems diameter class.

TS1 forest species height class
It was observed in Figure 4 that the height classes of TS1 showed a predominance for trees of the classes of [5 10], [30 35] which represents 18.50% of the total population. Trees that are shown in small quantities are found in the height classes [35 40], [40 45], [45 50].
Figure 4: TS1 tree height class.

TS2 forest species height class
Examination of Figure 5 showed that the dominant height class of TS2 is that of [10 15] which had a proportion of 28.74%. It was also found that the height classes [5 10], [15 20] counted the same quantity of trees which shows 17.37%. Finally, we noticed an almost zero presence of trees in the classes [35 40], [40 45] and [45 50].
Figure 5: TS2 tree height class.

TS3 forest species height class
The most dominant height classes of the Figure 6 are respectively. [20 25], [10 15]and [15 20]. The weakest represented class is that of the class [0.5 5].
Figure 6: TS3 tree height class.

Analysis of Table 3 showed that the overall Shannon-Weaver index is 3.09 bits. While for the transects, TS1 has an index of 2.59 bits, it records the high rate of diversity among the transects. Then, TS2 accuses an index of 2.49 bits. Finally, for TS3, an index of 2.19 bits is noted.
As for Piélou’s fairness overall, it is 0.87. However, for the transects it follows the same trend as the Shannon index. TS1 has the highest fairness with 0.79 and again TS3 has the lowest fairness with 0.71.
Table 3: Shannon-Weaver index & fairness of Pielou.

Jaccard similarity index (PJ) of transects
Examination of Table 4 showing the Jaccard similarity index for the transects showed that this index is between 14.28±21.43. TS1 and TS3 have the highest similarity rate.
Table 4: Jaccard similarity index results.

Hamming similarity coefficient (H)
Analysis of Table 5 showed that the Hamming distance of the transects varied from 79.57±85.72. TS1 vs TS2 has the longest distance.
Table 5: Hamming similarity coefficient results.

Discussion
The floristic inventory of woody trees through the 15 plots in the 4th communal section of Mirebalais revealed a partial specific richness of 40 species divided into 39 genera and 24 families. The families best represented by the number of species are Fabaceae (11 species), Meliaceae (4 species), Myrtaceae, Bignoniaceae and Anacardiaceae with each of 2 species. Our results agree with those found by [12]. This numerical importance of fabaceae could be explained, in part, by their mode of dissemination. And all the more so, for [13] fabaceae are fast growing species and they have the particularity of living in symbiosis with bacteria installed in root nodules and facilitating the assimilation of atmospheric nitrogen. Thanks to this property, fabaceae can survive and compete effectively in nitrogen-poor soils.
The horizontal structure revealed a negative exponential distribution which is characterized by a small number of large diameter trees and small diameter trees are the majority. Our results are similar with [14]. This can be explained by the result of strong pressure to harvest wood. Because the repeated cuts of wood and the accumulated water deficits do not allow the vegetation to reconstitute itself quickly. According to, [15] disturbances cause changes in the structural characteristics of stands, diameter is one of the most impacted parameters.
With regard to the vertical structure of forest species, it is observed beyond 30m that the trees are poorly represented. The low representativeness of tall trees could result in anthropogenic disturbances to which is added the pauperization of agriculture in the section. For [16], the tree becomes a growing savings by playing a role similar to that of large livestock by providing one-off income for major expenses as well as fuel for family consumption or for sale.
The low density of trees per hectare observed, whether real or regenerative, can be explained by anthropogenic factors such as wildfire, agriculture, livestock, cutting/timber, coal mining and natural disturbance such as drought. Agriculture and logging dramatically contribute to the reduction of plant cover.
The most frequent species in the study area are: Macrocatalpa longissima, Cassia siamea, Haematoxylon campechilanum, Cedrela oradata and Schaefferia frutescens. These dominances can be explained from an economic point of view because when you reach maturity you can earn a lot more money than cutting it down at an early age, especially for Macrocatalpa longissima, the wood of which is highly valued in the industry furnishings in Haiti.
During this study a rigorous examination of the various indices of diversity made it possible to detect the degree of diversity or the stability of the 4th section. To begin with, the overall Shannon index is very strong for the entire section while at the level of the 3 transects we could observe that this index is weak. According to [17], only a few species are the most dominant in the section. Fairness is medium, according to the assertions of [18] when the equity index of an ecosystem or a plant formation exceeds 70%, this implies that competition is relatively low between species. This threshold represents an equi-distribution of species, in other words and there is no dominance between forest species. The Jaccard similarity index revealed a dissimilarity at the level of the transects while for the Hamming distance the transects are highly or very highly diverse.
Conclusion
From the results obtained during this study which consists of the structural and demographic characterization of forest species in Crete-Brulee, we can draw the following conclusions:
A. The partial floristic richness of the section is 40 species divided into 39 genera and 24 families. The fabaceae family and the myrtaceae are the most dominant.
B. The actual density varies from 30±85 trees/ha-1 and the regenerating density in turn oscillates between 0.025±0.64 trees/ha-1. These densities are very low due to natural and human disturbance.
C. The diameter class distribution showed that individuals of small diameters are in the majority and the vertical structure, on the other hand, showed that tall trees are rare.
D. Frequency analysis determined that the following species are the most dominant in the section: macrocatalpa longissima, Cassia siamea, Haematoxylon campechianum, Schaefferia frutescens and Cedrela oradata.
E. The Shannon index varies from 2.19±2.59 bits but the fairness showed an average equipartition of the species at the level of the transects, it oscillates between 0.71±0.79. However, the comparison of the transects with the Jaccard similarity index revealed that the transects have a low similarity rate between 14.29±21.43 and the Hamming distance showed a strong and very strongly diversified floristic difference which varies between 79.57±85.72. These results show that despite natural and human disturbances, woody forests show a certain resilience. However, other complementary studies deserve to be made in the section on the detrimental effects of deforestation on infrastructures downstream of the watersheds, ethnobotanical and soil studies would make it possible to better select the plant material according to the abiotic constraints (salinity, acidity, water stress), in order to better understand the expectations and concerns of farmers in the 4th section so that they can be integrated into reforestation projects.
Acknowledgement
The authors are grateful to Ministry of Agriculture, Natural Resources and Rural Development of Haiti, Central Public University of Haiti, University, Central of the Americas of Haiti and University of Guadalajara for supporting the project; to Marilyn Z.R.G. h., Lovren A. R.G. h. (RIP) for being an indirect part of the project.
Authors’ Contributions
Authors Vincent, Ruiz-Blandon, Gallegos-Rodríguez and Hernández-Álvarez, designed the study, performed the statistical analysis and wrote the first draft of the manuscript. Authors Felix, Lafelur and Barthélemy, managed the analyses of the study and literature searches. All authors read and approved the final manuscript.
References
- Louis I (2008) Haiti: Fighting deforestation or social inequalities? Alternatives Sud 15(3): 193.
- Sandjong RCS, Ntoupka M, Vroumisa T, Ibrahima A (2018) Structural characterization of woody vegetation in Mozogo-Gokoro National Park (Cameroon). Flora et Vegetatio Sudano-Sambesica 21: 7-24.
- Rondeux J (1999) Measurement of forest stands. Gembloux agronomic presses, p. 522.
- Morou B, Ounani H, Oumani AA, Diouf A, Guero C, et al. (2016) Characterization of the demographic structure of ligneous plants in the agroforestry parks of the Dan Saga region (Aguié, Niger). Int J Biol Chem 10(3): 1295-1311.
- Folahan SON, Dissou EF, Akouehou GS, Tente BAH, Boko M (2018) Ecologie et structure des groupements végétaux des écosystèmes de la Lama au Sud-Bé Int J Biol Chem Sci 12(1): 322-340.
- Chase MW, Christenhusz MJM, Fay MF, Byng JW, Judd WS, et al. (2016) An update of the Angiosperm Phylogeny Group classification for the orders and families of flowering plants: APG IV. Botanical Journal of the Linnean Society 181(1): 1-20.
- Mahamat Saleh M, Ndiaye O, Diallo MD, Goy S, Niang K, et al. (2015) Characterization of woody populations along the route of the Great Green Wall in Chad. Int J Biol Chem Sci 9(5): 2617-2627.
- Kegne OC, Zapfack L, Claude G, Noiha NV, Nkongmeneck BA (2018) Floristic and structural diversity of two community forests under exploitation in Cameroon: the case of Kompia and Nkolenyeng. European Scientific Journal 14(24): 245-277.
- Diedhiou MAA, Faye E, Ngom D, Fall S (2017) Characterization of the Flora and Woody Vegetation of the Village Lands of Keur Birame (Kaffrine) and Saré Yorobana (Kolda) in Senegal. European Scientific Journal 14(21): 391-409.
- Kouyate AM, Diarra I, Habou R (2020) Composition Floristique, Diversité Et Structure Des Espèces Forestières Alimentaires De La Région De Sikasso Au Sud Du Mali. European Scientific Journal 16(12): 156-178.
- Eugène B, Konsala S, Amadou I (2020) Characterization of woody plants in the Kaele hills in the Sudano-Sahelian zone of the Far North, Cameroon. IMJST 5(7): 1338-1349.
- Sarr M, Camara AA, Diouf J, Sarr A, Mbaye MS, et al. (2021) Study of the ligneous flora in the mining areas of the municipality of Sabodala (Kédougou, Senegal). Rev Mar Sci Agron Vet 9(2): 251-258.
- Berrabah S, Chemissa M (2017) Ethnobonatic and chemical overview of Fabaceae. Mohamed Boudiaf-M'Sila University, p. 37.
- Abakar Guihini M, Diallo MD, Diallo A, Mahamat Saleh M, Guisse A (2021) Distribution of ligneous species along the route of the Great Green Wall: the case of Batha and West Wadi-Fira in Chad. Int J Biol Chem Sci 15(1): 144-155.
- Bellande A (2015) Deforested Haiti and remodeled landscapes. CIDICHA editions, p. 363.
- Mézard C (2018) Characterization of anthropogenic disturbances of the pine forest of Haiti: Case of unit 2. For obtaining a Master of specialization in integrated production and preservation of natural resources in urban and peri-urban areas. Liège Gembloux Agro-Bio Tech University, p. 69.
- Garba A, Djima TI, Abdou L, Mahamane A (2017) Characterization of woody vegetation in the Maggia watershed in the rural commune of Bagaroua (Tahoua region). Int J Biol Chem Sci 11(2): 571-584.
- Diallo H, Faye EH, Lejoly J, Nasi R, Maiga M, et al. (2010) Characterization of the vegetation and woody biodiversity of the Bouche de Baoulé biosphere reserve in Mali. Woods and Forests of the Tropics 303(1): 25-40.
© 2022 Bayron Alexander Ruiz Blandon. This is an open access article distributed under the terms of the Creative Commons Attribution License , which permits unrestricted use, distribution, and build upon your work non-commercially.
Editor In Chief


.jpg)


Signup for Newsletter

Quick Links
 Editorial Board Registrations
 Submit your Article
 Refer a Friend
 Advertise With Us
Our Recent Edition

.jpg)


Top Editors


.jpg)


.bmp)
.jpg)
.png)
.jpg)


.jpg)


.png)

.png)


.png)


Financial Support

Sponsors

Latest e-Books

Latest Video

 a Creative Commons Attribution 4.0 International License. Based on a work at www.crimsonpublishers.com.
Best viewed in
a Creative Commons Attribution 4.0 International License. Based on a work at www.crimsonpublishers.com.
Best viewed in