- Submissions

Full Text
Modern Concepts & Developments in Agronomy
Evaluation of Aerial Carbon Sequestration in Cocoa Plantations of Different Ages in Baradères, Haiti
Valdimir Vincent1,4,5, Efrén Hernández-Álvarez3, Agustín Gallegos-Rodríguez3, James Métayer4, Jhonson Martin5, Jean-Michel Petit-Jean5, Rochel Augustin5 and Bayron Alexander Ruiz-Blandon2,3*
1Ministry of Agriculture, Natural Resources and Rural Development of Haiti, Haiti
2Department of Botany and Zoology, University of Guadalajara (U of G), University Center for Biological and Agricultural Sciences, Zapopan, Jalisco, Mexico
3Department of Forest Production, University of Guadalajara (U of G), University Center for Biological and Agricultural Sciences (UCBAS), Zapopan, Jalisco, Mexico
4Central Public University of Haiti, Haiti
5University Central of the Americas of Haiti, Haiti
*Corresponding author: Bayron Alexander Ruiz Blandon, Department of Botany and Zoology, University of Guadalajara (U of G), University Center for Biological and Agricultural Sciences, Zapopan, Jalisco, Mexico
Submission: December 11, 2021 Published: January 07, 2022

ISSN 2637-7659Volume10 Issue 1
Abstract
During the work, localities such as: Calbacier, Maton, Font-Tortue, Vincent-dron and Boino were identified by their reputation in cacao culture to collect data that were collected through the five (5) localities, of which 30 cacaoyers per locality were randomly selected within a radius of two-thirds of a hectare (10000m2), making a total of two hundred and forty (240) cacaoyers measured by the method described by Purata [1]. To estimate biomass, dendrometry parameters such as (H and D) were selected and then the allometric equation of Chave et al. [2] was used. Therefore, sequestered airborne carbon was projected by biomass, the result of which is multiplied by the IPCC constant [3]. After calculation, the results found for the space-sequestered carbon were respectively: Calbacier 4,665tC/ha, Maton 2,463tC/ ha and Font-Tortue 4,101tC/ha for the class of 1-year; for the class of 2-years: Calbacier 8,796tC/ha and Maton 6,823tC/ha and for the class of 3-years: a Font-Tortue 7,073tC/ha, Vincent-dron 81,137tC/ha and Boino 2,463tC/ha. In addition to space, the air carbon sequestered over time was estimated and the following results were obtained: Calbacier 1 and 2 years 4,665tC/ha, 8,796tC/ha; Maton 1 and 2 years 2,463tC/ha, 6,823tC/ha and Font-Tortue 1 and 3 years 4,101tC/ha, 7,073tC/ha. Following the different results found in the different localities of different ages, it has been shown that carbons can vary from one locality to another in time and space. In space the equation found is y=-1.013x3 + 14.01x2 - 50.95x + 50.75. R²=0.273 and y=0.254x3 - 2.516x2 + 7.047x + 0.454, R²=0.192 in time.
Keywords: Cacao culture; Airborne carbon; Allometric equation
Introduction
Many countries invest in the cocoa sector such as: Côte d’Ivoire, Ghana, Indonesia, Ecuador, Nigeria, Cameroon, Brazil, Rep. Dominican Republic, Colombia, and others [4]. Since the end of the 16th century, the cacaoyer has been cultivated in most tropical regions of Central and South America as well as in the West Indies. The introduction of cocoa (Theobroma cacao L) in Haiti dates back to the sixteenth and seventeenth centuries and remains rather difficult to trace in a relevant way [5]. In Haiti, cocoa farming accounts for a relatively large share of the farm income of the families that farm it. Cocoa is grown mainly in the country’s three departments: Nord, Nord-Est and Grand’ Anse [1]. Today we find the three largest varieties of cocoa grown (Forestaro, Trinitario, Criollo), the first two remain much higher, than that of Criollo, the name given to Creole cocoa.
However, the Haitian cocoa sector has been experiencing a chronic crisis since the early 1970s with the total lack of public and private investment; other factors such as systematic tree felling, soil erosion led to the downfall of this crop [6]. In the early 2000s, the cocoa sector reached a critical level of dysfunction. The share of cocoa in total Haitian exports, which stood at around 3% in recent years, fell, during the period 2000-2001, below 1% [7]. The vulnerability of the population pushes more and more families to cut down their cocoa trees to produce charcoal, the main fuel used for cooking. Due to a lack of economic resources for farmers, cocoa plantations gradually disappeared, and producers favored the planting of short-cycle food crops such as beans or maize in order to limit food insecurity, which is still far too prevalent in rural areas, [6]. The municipality of Baradères, located in the department of Nippes, is not spared from this scourge. Cocoa farming is practiced in small pockets by peasants. Several factors, such as the lack of supervision for farmers, the vulnerability of road infrastructure, cyclones, phytosanitary diseases, insects, etc., take over the crop. After Hurricane Mattthew, 80% of cocoa production is devastated. The discrepancy that exists as it is described and observed by some, leads us to do this research work. This study is specifically to assess the carbon sequestered in the air with a view to proposing alternative solutions. This study takes place in this context.
Material and Method
The purpose of the study
It is to evaluate the airborne carbon sequestered in the cocoa plantation of different ages in the municipality of Baradères.
Research direction
The study was conducted during the vegetative phase of the
crop and is based on a period of 1 to 3 years. The selection of
cocoa plantations was done in collaboration with the Community
Organizations of Bases (OCB) which work in cocoa farming, and
which allowed us to find information related to this culture to better
guide the work. Compared to the above-mentioned collaboration,
eight plantings of different ages (1-3 years) were identified in
locations such as Calbacier, Maton, Font-Tortue, Vincent-dron and
Boino. The indirect method is used to determine biomass and
calculate carbon.
To adjust the model, height and diameter were selected as
dendrometric parameters. The calculation of these parameters
was carried out by this method: the height was measured from the
collar to the apical part and the diameter was taken from the soil
of 0.30m. The type of sampling used is a simple, stratified random
sample for which they were selected according to the area from the
age distribution of the cacaoyer, the dendrometric parameters and
the vital distance of the feet of the cacaoyer at the (3m 3m). From a
radius of two-thirds of 1 hectare (ha) (10000m2), thirty trees were
measured per plantation, for a total of two hundred and forty (240),
[1].
The volume of cacaoyers was calculated using the formula
V=П/4 (D2m L) or (0.785 D2m L) proposed by Huber using the
dendrometric parameters (H and D) of cacaoyers, [10]. To estimate
the airborne carbon sequestered in the cacao culture, the indirect
method was selected using dendrometric parameters (H and D).
After the biomass was calculated, it was multiplied by the constant
of 0.45 according to [5] cited by [8]. to find the airborne carbon
sequestered in the cocoa tree. C=B* 0.45; C: Carbon in kilograms
(kg); B: Biomass in kilograms (kg) and the comparison of the
averages for the different variables studied was obtained by a oneway
ANOVA.
Result
Experimental result
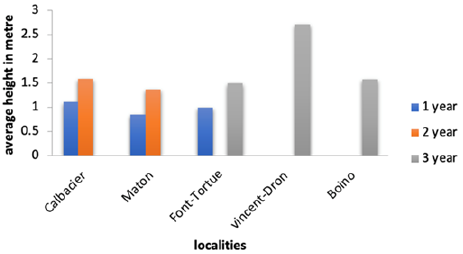
After treatment, the following localities were obtained average heights for the age of one 1-year: Calbacier, 1.11m, Maton, 0.85m and 0.91m Font-Tortue and for two (2) years, the values were of the order: 1.59m and 1.37m, Calbacier and Maton, finally for those of three (3 years): Font-Tortue 1.49m, Vincent- dron 2.71m and Boino 1.58m. These values found for the height of the cacaoyers showed that there is a statistically significant difference between them (Figure 1).
Figure 1: Average height of cocoa trees at different locations.
Average diameters in cm of cocoa trees
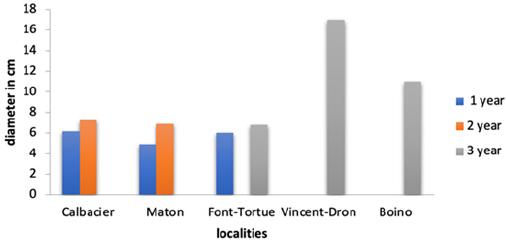
Compared to their heights, it has been noted that their diameters have been extremely high for the localities of Calbacier, Maton and Font-Tortue, of one year: ; 6.16cm, 4.9cm, 6cm and for Calbacier and Maton of 2-years: 7.26cm, 6.82cm in end Font-Three-year-old turtle, Vincent-dron and Boino: 6.8cm, 17cm, 11cm, because these values only concern the diameter of the cacaoyers (Figure 2).
Figure 2: Average diameter of cocoa trees at different locations.
Average volume of cocoa trees in different localities
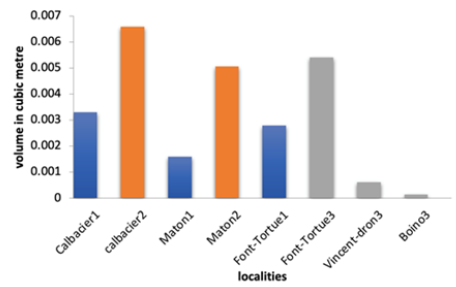
With Huber equation П/D2L or 0.785D2L, for 1-year localities such as Calbacier, Maton and Font-Tortue, a mean volume of 0.00330639m3, 0.00160207m3 and 0.00279774m3, respectively, was obtained (Figure 3). With a p-value of 0.0000004227, these values showed no statistically significant difference in volume of cocoa trees between them. Calbacier and Maton, who are 2-years, were respectively estimated at 0.0065787m3; 0.00506102m3. The test showed a p-value of 0.007249. The locality of Calbacier gave a volume of cocoa trees more or less significant compared to Maton. For the 3-years as Font-Tortue, Vincent-dron and Boino spread out a respective volume of 0.00540846m3; 0.0006148m3; 0.00015008m3 and a p-value of 2.2e-16 showed that Font-dronTurtle is the locality that has a high significant difference, yet the others do not have a significant difference.
Figure 3: volume of cocoa in different locations.
Average overhead biomass of cocoa trees
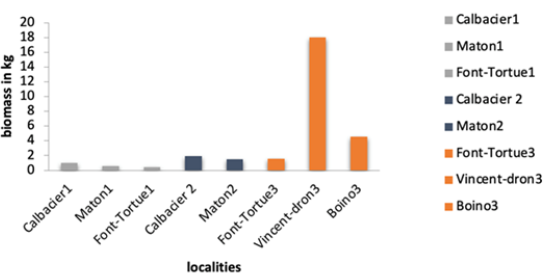
Following the formula proposed by Huber AGB = 0.0509 (Wi (DBHi2) Hi), [8]. the corresponding biomass was calculated for 1, 2, 3 years in the following localities: Calbacier, Maton and Font-Tortue: 1.036kg, 0.547kg, 0.410kg respectively. Calbacier had a more or less significant difference from the other two localities that did not have a significant difference with a p- value of 0.0000004227 (Figure 4). However, with p-value of 0.007249 for the class of 2 years, Calbacier and Maton had each a mass of 1,954kg; 1,516kg and they do not show any significant difference and 3 years as Font-Tortue, Vincentdron and Boino had 1,571kg; 18,030 kg; 4,548kg. Compared to the two classes, Vincent-dron reached an exponential level in terms of biomass with a p-value of 2.2e-16. However, Vincent-dron and Boino showed no significant difference.
Figure 4: Aerial biomass of cocoa trees from different locations.
Medium airborne carbon sequestered in kg/ha in space
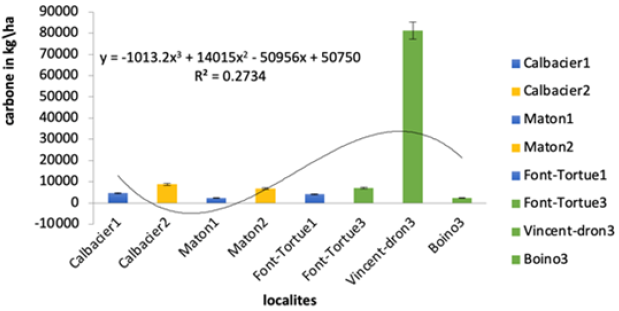
Compared with the p-value obtained of 0.000000003603, the respective carbon values for the following zones were obtained on average: Calbacier of 1 year sequestered a carbon quantity of 4665.10kgC/ha; followed by Maton, 2463.57kgC/ha and then Font- Turtle 4101.24kgC/ha (Figure 5). However, the 2-years as Calbacier and Maton had a value of 8796.39kgC/ha and 6823.85kgC/ha with a p-value of 0.00003892. Other localities such as Font-Tortue, Vincent-dron and Boino, 3-years-old, had a p-value of 7.036e-10 and after calculation, 7073.75kgC/ha for Font-Tortue; Vincent-dron 81137.0457kgC/ha and 2046.75kgC/ha for Boino.
Figure 5: Carbon sequestration in space.
Medium airborne carbon sequestered in kg ha over time
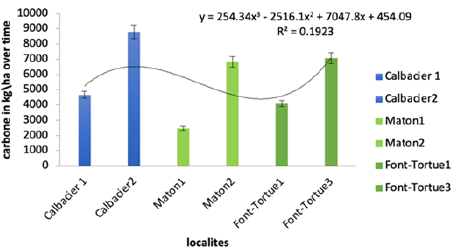
After calculating the airborne carbon sequestered in the different zones, it was projected over time. A p-value of 0.000005522 justifying the correlation between the data whose IPCC formula was applied: C=0.45*B in the dwelling of Calbacier of different ages, (Appendix, 3). The 1-year-old cocoa trees at Calbaciers stored a quantity of carbon equivalent to 4665.10kgC/ha and those at two years had 8796.39kgC/ha (Figure 6). However, at Maton for the ages of 1 and 2 years they stored respectively a carbon quantity of 2463.57kgC/ha; 6823.85kgC/ha with a p-value=0.000006279 and at Font-Tortue, the carbons stored were 4101.24kgC/ha; 7073.75kgC/ha with a p-value of 0.0000004468.
Figure 6: Carbon sequestration in kg/ha over time.
Sequestered airborne carbon in t ha in space
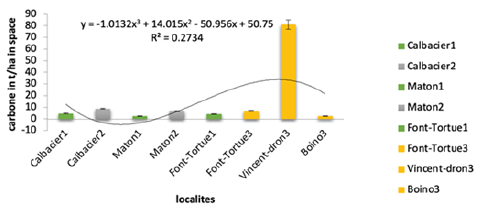
Localities such as Calbacier, Maton and Font-Tortue for the 1-year class had a quantity of carbon per hectare respectively: 4,665tC/ha; 2,463tC/ha; 4,101tC/ha (Figure 7). These results were found by dividing the stored carbon into kilograms per hectare per 1000. With this same calculation, for the 2-year class for the localities of Calbacier and Maton a quantity of carbon per hectare of 8,796tC/ha; 6,823tC/ha (Figure 7). The 3-year class for the following localities Font-Tortue, Vincent-dron and Boino sequestered at 7,073tC/ha, 81,137tC/ha, 2,463t/ha (Figure 7).
Figure 7: Airborne carbon sequestered in t/ha in space.
Carbon sequestered over time in t ha
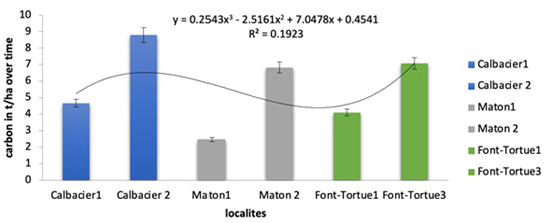
To get a clear idea of the amount of carbon stored, the results were converted into t ha. Calbacier stored for 1 and 2 years: 4,665tC/ ha and 8,796tC/ha, Maton 1 and 2 years: 2,463tC/ha, 6,823tC/ha and Font-Tortue 1 and 3 years: 4,101tC/ha and 7,073tC/ha. This graph below gave information about the different localities (Figure 8).
Figure 8: Sequestered carbon in t/ha over time.
Carbon dioxide (CO2) in tonnes per hectare in space
The results found for the different locations of 1-year were respectively: Calbacier 17.120tCO2/ha; Maton, 9.041tCO2/ ha and Font-Tortue 15.051tCO2/ha (Figure 9). For the 2-year localities; Calbacier 32,282tCO2/ha, Maton 25,043tCO2/ha and the 3-year localities had: Font-Tortue 25,960tCO2/ha, Vincent-dron 297,772tCO2/ha and Boino 9,041tCO2/ha.
Figure 9: Sequestered carbon in t/ha over time.

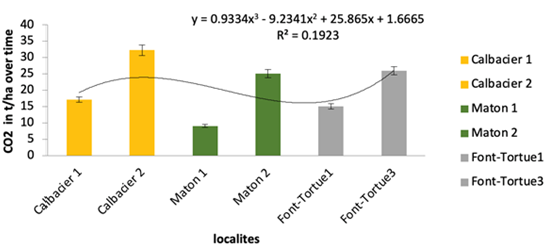
Carbon dioxide (CO2) in tonnes per hectare over time
The carbon dioxide ratio was presented as follows: Calbacier 1 and 2 years 17,120tCO2/ha and 32,282tCO2 ha, Maton 1 and 2 years 9,041tCO2/ha; 25,043tCO2/ha and Font-Tortue had 1 and 3 years 15,051tCO2/ha; 25,960tCO2/ha (Figure 10).
Figure 10: Ratio of carbon and carbon dioxide in t/ha over time.
The estimation of airborne carbon via the airborne biomass of the cacaoyers by the allometric equation provided an idea of the amount of carbon in localities such as Calbacier, Maton, Font-Tortue, Vincent- dron and Boino from 1 to 3 years. The results found by statistical tests were, respectively, for the 1-year class: 4,665tC/ ha; 2,463tC/ha; 4,101tC/ha (Calbacier, Maton and Font-Tortue) for the 2-year class: 8,796tC/ha; 6,823tC/ha (Calbacier and Maton) and for the class of 3-years: 7,073tC/ha; 81,137tC/ha, 2,463tC/ha. Through the Analysis of Variance (ANOVA), we have observed in the class of 1-year, there is a significant difference between Calbacier and Maton with a p-value of 0.000000003603. However, Font- Tortue is not significantly different. Statistical tests, or normality tests, bartlett homogeneity tests have shown that no correlation between the two-year data has been linked. For this, the Analysis of Variance (ANOVA) did not present a significant difference for the 2-years class; its p-value was 0.00003892. However, with the same processes for the 3-year class, there is a significant difference at an exponential rate justified by its p- value of 7.036e-10. Compared to the first two classes, Font-Tortue and Boino show no significant difference. However, for localities such as Vincent-dron and Font- Tortue there is a very significant difference (Figure 6).
Discussion
On the one hand, a study on the dynamics of woody biodiversity
and carbon stocks in agroforestry systems based on cocoa trees in central Cameroon, [9]. presented in cocoa SAFs from 0 to 10 years
old, 78tC/ha were kidnapped; the same goes for cocoas from 11
to 20 years old 109.3tC/ha. Compared to that of [9] it was found
that for the classes of 1, 2 and 3-years, making a proportional
report compared to the SAFs from 0 to 10 years of [9], there is a big
difference in terms of sequestered carbon.
On the other hand, estimated that the carbon stocks of associated
trees in shady cocoa trees in Cameroon were respectively 88.7tC/
ha; 107tC/ha; 135.5tC/ha and [9,10], presented the importance of
these systems in carbon sequestration of (660tC/ha).
However, our study is based on the vegetative phase where the
cocoa trees considered are totally young, in addition to space, we
must put the emphasis on the carbon sequestered over time and
we have seen that the edaphological and climatic factors, agroecological,
planting distance, cultivation operations have strongly
influenced cocoa farming in terms of the quantity of carbon
sequestered. After analysis of variance (ANOVA), the Calbacierplantation
had a significant difference between these values
4665.10kg/ha and 8796.395kg/ha. This difference showed that
two-year-old cocoa trees stored more carbon than one-year-old
cocoa trees [11-13]. For the two strata of the Maton dwelling, the
following results were found: 2463.57kg/ha; 6823.85kg/ha, by
comparing the carbons stored in the two zones (Calbacier, Maton);
it was noticed that the results found are proportional and present
the same agroecological configurations. In addition, the estimates of
carbon stocks at Font-Tortue are presented as follows: 4101.241kg/
ha; 7073.75kg/ha (Figure 6).
Conclusion
The objective of this study was to assess the aerial carbon
sequestered in cocoa plantations of different ages, by developing
allometric equations for cocoa plants. From the dendrometric
parameters, it was possible to determine the biomass from which
the aerial carbon of cocoa trees was calculated. The allometric
equation of [2] AGB=0.0509 (Wi (DBHi2) Hi was the equation
chosen to determine the above-ground biomass in cocoa plantations
of different ages.
The different results obtained were respectively: for the
1-year class: 4,665tC/ha; 2,463tC/ha; 4,101t/ha (Calbacier, Maton
and Font-Tortue), for the 2-year classes: 8,796tC/ha; 6,823tC/
ha (Calbacier and Maton) and for the 3-year classes: 7,073tC/
ha; 81,137tC/ha, 2,463tC/ha. The balance between the age of the
cocoa trees, the cultivation area has a similarity with respect to the
quantity of carbon sequestered. Dendrometric parameters such as
the diameter and height of the cocoa trees as well as the density
of the wood were to breed to calculate the biomass and were used
for calculating carbon in space, the equation found is: y= -1.013x3
+ 14.01x2 - 50.95x + 50.75; R²=0.273 and y=0.254x3 - 2.516x2 +
7.047x + 0.454; R²=0.192 in the temps.
Acknowledgement
The authors are grateful to Ministry of Agriculture, Natural Resources and Rural Development of Haiti, Central Public University of Haiti, University, Central of the Americas of Haiti and University of Guadalajara for supporting the project; to Marilyn Z.R.G. h., Lovren A. R.G. h. (RIP) for being an indirect part of the project.
Competing Interests
Authors have declared that no competing interests exist.
Authors’ Contributions
Authors Vincent, Ruiz-Blandon, Gallegos-Rodríguez and Hernández-Álvarez, designed the study, performed the statistical analysis and wrote the first draft of the manuscript. Authors Mateyer, Martin, Rochel and Michel, managed the analyses of the study and literature searches. All authors read and approved the final manuscript.
References
- PURATA (2016) Manual para el monitoreo comunitario del crecimiento de arboles. People and Plants International, United States Agency for International Development, the Nature Conservancy, Alianza Mexico REDD+, Mexico, p. 51.
- Chave J, Andalo C, Brown S, Cairns MA, Chambers JQ, et al (2005) Tree allometry and improved estimation of carbon stock and balance in tropical foret. Oecologia 145: 87-99.
- IPCC (2006) Agriculture, forestry and other land use. In: Simon Eggleston LB, Miwa K, Ngara T, Tanabe K (Eds.), Guidelines for National Greenhouse Gas Inventories, Japan.
- Affian M (2020) Carbon stock modelling and economic evaluation of agroforestry systems based on cocoa: case of the department of Aboville, thesis for the completion of the diploma of Advanced Agronomy, option Eaux et Forests. From the Republic of Cote d'Ivoire, p. 67.
- Claire D (2013) Carbon stock assessment and comparison of cocoa-based agroforestry systems in central Cameroon. case of the aroma of Bokito.
- JEAN (2014) Haiti’s cocoa sector: An example of South-South success and North-South partnership. Field Action Sciences Reports.
- MARNDR (2012) Strategy of the cocoa sector at the level of the Northern Region, and the Grand Anse of Haiti.
- SUPREME (2019) Assessment of biomass and carbon stored by the indirect meth consideod of the Sorghum grain (Sorghum bicolor, L.M), variety (Papè pichon) in the Commune de Mirebalais et de Cité-Soleil; final report. Port-au-Prince, p. 49.
- TAYO GAMO (2014) Dynamics of woody biodiversity and carbon stocks in cocoa-based agroforestry systems in central Cameroon.
- Essola E (2014) Evaluation of potential yields of Cocoa (Theobroma cacao L) in complex agroforestry systems in bi-modal rainfall forest zone, memoir, Cameroon, p. 61.
- AVSF (2015) A qualified and certified peasant cocoa in Haiti.
- Loubota P (2018) Biomass and carbon stock in Central Africa: importance of tree allometry. Original dissertation presented] with a view to obtaining a doctorate in agronomy and biological engineering, Communauté Française de Belgique, Agro- Biotech, Université Liège Gembloux, Belgium p. 161.
- MDE (2006) Ministry of environment, climate change program of the republic of Haiti; National adaptation action plan (napa) port-au-prince.
© 2021 Bayron Alexander Ruiz-Blandon. This is an open access article distributed under the terms of the Creative Commons Attribution License , which permits unrestricted use, distribution, and build upon your work non-commercially.
 a Creative Commons Attribution 4.0 International License. Based on a work at www.crimsonpublishers.com.
Best viewed in


.jpg)


 Editorial Board Registrations
 Submit your Article
 Refer a Friend
 Advertise With Us
.jpg)


.jpg)


.bmp)
.jpg)
.png)
.jpg)


.jpg)


.png)

.png)


.png)


