- Submissions

Full Text
Modern Concepts & Developments in Agronomy
Soil Fertility Prediction Tool for Real-Time Precision Agriculture
Janez Trontelj jr*
University of Ljubljana, Faculty of Electrical Engineering, Trzaska 25, Ljubljana, Slovenia
*Corresponding author:Janez Trontelj jr, University of Ljubljana, Faculty of Electrical Engineering, Trzaska 25, Ljubljana, Slovenia
Submission: April 05, 2021Published: April 19, 2021

ISSN 2637-7659Volume8 Issue 3
Abstract
Latest advances in integrated micro systems, incorporating the latest sensor technology, will enable affordable use of informatics in agriculture. This paper describes a method for a real-time prediction of soil properties using a portable, low-cost sensor incorporating an integrated circuit for soil impedance spectrometer. This new, application-specific integrated circuit was developed in our laboratory. The described method considers different soil sample properties variations of macro nutrients such as phosphorus, potassium and magnesium. The influence of machine learning parameters and soil categories was studied to obtain the most accurate model to meet the farmers’ requirements for realtime soil analysis in an agricultural field. The system’s portability allows the sensor to be attached to a tractor and quickly obtain a complete database of the field’s soil properties and further fertilizer plan optimization.
Keywords: Soil sensor; Electrical impedance spectrum of the soil; Soil classificatory; Real-time fertilization plan
Introduction
Artificial intelligence is becoming more and more crucial in today’s industry and
enables accurate predictions based on a statistical analysis of previously collected data and
machine learning [1]. In our case, this considers numerical soil information on macro and
microelements, ambient temperature, moisture content, pH, texture variations, and the like.
Therefore, the most advanced technologies use multi-sensor systems that include expensive
ion-selective sensors. These sensors require chemical solutions that are sensitive to specific
elements. Such requirements are not suitable for a real-time application in a large area. Besides,
large data sets are necessary to capture the multiparametric variation in soil properties for
different areas. Therefore, the trade-off between price and prediction accuracy must be
found independently for each task. This research aims to develop a method for predicting
local soil properties for a real-time application. The prototype for soil property prediction
design is validated in this research, including in our laboratory developed Application Specific
Integrated Circuit (ASIC) for impedance spectrometer. The advanced machine-learning model
is introduced for local field property prediction. A limited number of agricultural fertilizers
were used to provide soil nutrient variations. This research aimed to create a representative
dataset that fits the soil properties under study (i.e., phosphorus, potassium, and magnesium)
and to study the influence of the machine-learning parameters on the prediction of the soil
properties under predefined conditions.
The electrical soil impedance spectrometer needs no chemical support. However, the main
problem with the use of impedance sensors is their low selectivity. The literature reports their
high sensitivity to soil texture, moisture content, presence of nitrogen and similar. Therefore,
we performed the analysis for a local field having minimal texture variation.
In the papers [2-4], the soil impedance spectrum concept has been published. However, to
attract the farmers to accept it, a user-friendly and low-cost system needed to be developed.
It turned out that the method based on the soil spectrum is susceptible to soil sample
preparation. If the soil is dry, the impedance spectrum varies significantly with the soil type,
its texture, and similar. The problem is the ohmic contact between the sensor electrodes
and the soil. Poor ohmic contact may increase the real part of the impedance spectrum and
disguises the relevant information about the soil impedance.
Machine learning is also a crucial step. Decision tree, Support Vector Machine (SVM), and Artificial Neural Network (ANN) models are commonly used methods found in the literature. Based on a comparative analysis, we selected the machine learning method. Selecting appropriate categories for soil characterization is another critical issue in this study. The analysis can be performed with varying degrees of accuracy. The accuracy also correlates with the level of nutrients that need to be identified [5]. To estimate which method is most effective, we performed a comparative analysis. To our knowledge, there is no such analysis in the literature. Soil nutrients are characterized as very low, low, medium, high, and very high in some studies. Another soil approach uses the categories low, medium, and high [6]. The fertilizer recommendation may be increased or decreased by 25% or 30% of a general recommendation for the low or high category. However, the nutrient level categories are more based on the type of crop, yield level nature, and soil [7,8]. Different crops accumulate different amounts of nutrients from the soil and have different nutrient recommendations. Therefore, there is no uniform recommendation about soil categories. The correlation between different categories for data coding and prediction of soil properties using machine learning is studied to estimate the model’s sensitivity to the category.
Material and Methods
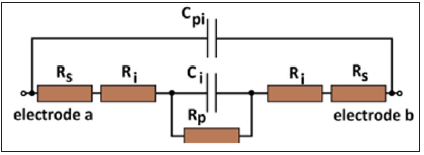
The simplified equivalent circuit of the soil sensor is presented in Figure 1, where 'RS 'is the ohmic part of the sensor electrodes contact to the soil surface, which is very variable with the soil moisture and with the contents of the non-soluble parts, like fine sand in the soil. The sensor plate to soil surface resistance 'RS' is highly dependent on the soil type and its moisture. The same is true for the resistors' Ri' and 'Rp', which also varies with the soil moisture level. Resistors 'Ri' and 'Rp' represent the soil's resistance where the most relevant information about the fertilizer type and contents is present. The soil capacitance 'Ci' and 'Cpi' values heavily depend on the soil's water contents. The capacitance values carry the fertilizers' features, which the imaginary part of the impedance can detect.
Figure 1:Simplified equivalent circuit of the soil impedance and the sensor plates to soil contact resistance.

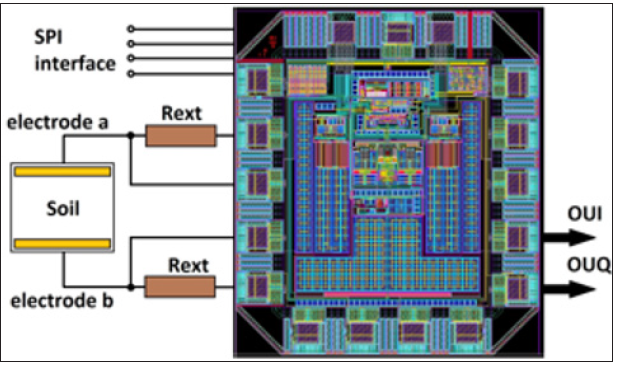
The layout of the Application Specific Integrated Circuit (ASIC) is shown in Figure 2. Voltage excitation takes place through buffers, and external resistors ‘Rext’ generate a current source. The AC current is injected into the soil using a pair of electrodes, and the resulting voltage potential across the electrodes is monitored in the ASIC. This voltage potential is amplified with a differential band-pass instrumentation amplifier, amplifying the voltage drop and providing differential outputs. The outputs ‘OUI’ and ‘OUQ’ are generated by mixing the amplifier outputs with excitation voltage in phase for the real part of the signal and with 90 degrees phase-shifted clock for the imaginary part. The excitation voltage is generated internally by a Digital Ring Oscillator (DRO). The core of the DRO is a ring of inverters and capacitors. The output signal of the inverter ring is fed to a series of 7 digital dividers. Each divider reduces the scout frequency by a factor of two. Thus, the last divider yields a frequency equal to fosc_out/127. Multiplexer determines the output frequency. The oscillator generates square wave pulses with frequencies in the range fmin=20kHz to fmax=14.24MHz. These pulses are generated by clock signal form block, providing the outputs for soil bias current and in-phase, and 90 degrees shifted signals to mixers extracting the real and imaginary component of the soil impedance.
Figure 2:The layout of the ASIC.

The soil mud must be of an appropriate viscosity that can be quickly pushed between the sensor electrodes. Figure 3 presents soil impedance curves for four different soil samples with four different moisture levels.
Figure 3: Soil impedance curves with four different moisture levels for four different soil samples.

Adopting measuring the impedance spectrum, we got the
amplitude values in a frequency range from 30kHz to 14MHz.
The dotted line presents dry soil. We added some Deionized (DI)
water to get 20% of moisture (solid brown curve), 40% of moisture
(segmented curve), and 60% of moisture (dotted yellow curve)
levels in a soil sample. We can see that 40% of moisture level gives
us the most representative results.
To study the influence of different soil categories on soil
analysis, the soil samples are collected from a topsoil area (0-
30cm range) in a local field. The selected fertilizers are then
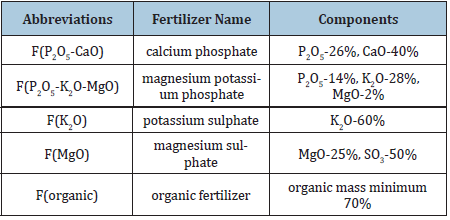
used to amend the nutrient content of the soil. Table 1 provides
information on the fertilizers studied. Twelve soil samples with
different chemical solutions were prepared and used to create
a research dataset. The research dataset, expanded to include
chemical structure, includes twelve soil samples from a local field
and 79 soils collected throughout Slovenia with different chemical
structures and textures. Chemical analysis is then carried out by the
certified laboratory of the Agriculture Institute of Slovenia.
Table 1:The fertilizers under study.

To create a database for different soil samples, we connect the impedance spectrum sensor to a personal computer’s USB port. Impedance spectroscopy measures the resulting voltages when a constant current is applied at different frequencies. The 122 chosen frequencies between 30kHz and 14MHz allow a good fit of the impedance signal over the whole frequency domain of interest.
Result
Several measurements were made using an impedance
spectrometer for bulk soil with the same moisture content (40%).
We decided to measure three representative subsamples for
each soil to adopt a machine learning algorithm for soil fertility
prediction. Two soil measurements and one test measurement
were performed for a training data set. In other words, the training
data set for the local field consists of 24 data, while the testing
data set consists of 12 data. Due to the excellent signal quality, no
preprocessing was required for a data set.
Tables 2-4 show the comparative analysis results during this
research, demonstrating the importance of the impedance sensor’s potential for accurate local field analysis. We can see that the SVM
classification model enables the most accurate result for the current
research dataset. Nevertheless, the classification model ANN
results are also suitable for potassium and magnesium, where the
decision tree showed the least accurate prediction. Table 3 shows
that the local field dataset’s prediction gives a better prediction of
soil properties for now. In contrast, an extended dataset containing
soils from different fields reduces this accuracy. The correlation
between a different number of soil categories and prediction
accuracy is demonstrated in Table 4. Better performance for larger
categories can be achieved with increased dataset size. The effect
of feature selection on prediction accuracy was also investigated.
We found that the standard Principle Component Analysis (PCA),
which reduced the data’s dimensionality, did not significantly
improve results. In contrast, Neighborhood Component Analysis
(NCA) improved phosphor identification by up to nearly 10%.
Table 2:Classification results corresponding to local field measurements for five categories.

Table 3:Classification results corresponding to local field properties prediction and global field properties prediction, where five categories and artificial neural network were used.

Table 4:Classification results corresponding to local field properties prediction when using different categories and artificial neural networks.

Discussion
The proposed study is an important step forward to improve the farming “digitalization”. We aimed to develop a soil fertility classification algorithm and an inexpensive, portable soil fertility classifier based on the soil’s electrical impedance spectrum. More detailed information about the used algorithm and soil categorization is available in our previous article [9] on that topic. Mapping soil properties on a particular plot is a goal, and the fertilization schedule may be further automated with a Global Positioning System (GPS). The electrical soil impedance spectrum tool was manually tested on five different farms on three plots. The analysis was performed twice a year. Weather conditions and soil moisture were different each time. The presented algorithm overcame this and provided the correct soil fertility prediction. We are still working on a fast and robust machine to prepare soil samples correctly.
Conclusion
This paper describes a reliable and cost-effective tool for
characterizing an agricultural field’s soil fertility using the soil’s
electrical impedance spectrum. By adopting a dedicated ASIC
capable of performing the soil sample’s impedance spectrum
analysis in real-time on the field, such a system may become more
user-friendly and suitable for mass application. It was tested in
several farms with different soil types. An acceptable probability
of correct soil class prediction was achieved. Since the prediction
algorithm is based on self-learning, the probability of correct
prediction increases with the learning data set’s growth. We believe
that the sophisticated methods described in [10] are not required
to achieve such results.
Further development of this farming tool, we see in increasing
the database for self-learning, smart algorithms. Our goal is to
provide farmers with affordable help to optimize crop production
efficiency and reduce environmental pollution with fertilizer
overdoses.
Acknowledgment
The Slovenian Research Agency (ARRS) and the Ministry of Agriculture, Forestry and Food (MKGP) partially funded the project. The author thanks Olga Chambers, Ph.D., for her assistance with the measurements.
Conflict of Interest
The author declares that there is no conflict of interest.
References
- Burton L, Jayachandran K, Bhansali S (2020) The "Real-Time" revolution for in situ soil nutrient sensing. Journal of The Electrochemical Society 167(3).
- Trontelj Jr J (2020) Digital farming. Agri Res & Tech: Open Access J 24(3): 556270.
- Chambers O, Trontelj J, Tasic J, Trontelj Jr J (2019) New approach to optimization of crop production and environment protection. Sensors & Transducers 237(9-10): 159-164.
- Chambers 0, Sešek A, Ražman R, Tasič JF, Trontelj J (2018) Fertilizer characterization using optical and electrical impedance methods. Computers and Electronics in Agriculture 155: 69-75.
- Teagasc-Agriculture and Food Development Authority.
- (2021) NS Office, EnviStats India (vol. II-Environment Acc., Chapter-2: Soil Nutrient Indices).
- Heckman JR (2006) Soil fertility test interpretation-phosphorus, potassium, magnesium, and calcium. Rutgers NJAES Cooperative Extension. FS719: 1-4.
- Srivastava AK, Singh S (2008) DRIS norms and their field validation in Nagpur Mandarin. Journal of Plant Nutrition 31(6): 1091-1107.
- Trontelj Jr J (2021) Advances in real-time soil fertility determination. Agri Res & Tech: Open Access J 25(2): 556307.
- Suchithra MS, Pai ML (2020) Improving the prediction accuracy of soil nutrient classification by optimizing extreme learning machine parameters. Information Processing in Agriculture 7(1): 72-82.
© 2021 Janez Trontelj jr. This is an open access article distributed under the terms of the Creative Commons Attribution License , which permits unrestricted use, distribution, and build upon your work non-commercially.
 a Creative Commons Attribution 4.0 International License. Based on a work at www.crimsonpublishers.com.
Best viewed in


.jpg)


 Editorial Board Registrations
 Submit your Article
 Refer a Friend
 Advertise With Us
.jpg)


.jpg)


.bmp)
.jpg)
.png)
.jpg)


.jpg)


.png)

.png)


.png)


