- Submissions

Full Text
Modern Concepts & Developments in Agronomy
Qualitative Analysis of Sunflower Planting
Stanko Opranica*
Univerzitet u Novom Sadu, Serbia
*Corresponding author: Stanko Opranica, Univerzitet u Novom Sadu, Poljoprivredni fakultet, Trg D. Obradovića 8, 21000 Novi Sad, Serbia
Submission: April 27, 2020Published: May 06, 2020

ISSN 2637-7659Volume 6 Issue 2
Opinion
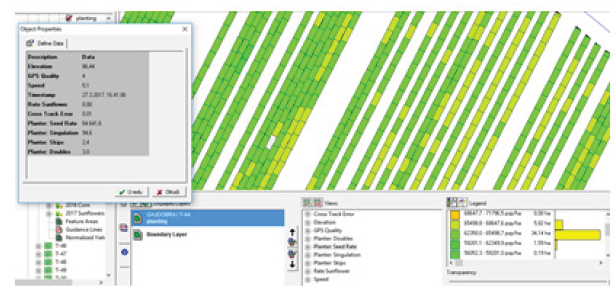
The research was carried out in the sunflower sowing on 18 plots on a total area of 380ha. The sowing was done in the last decade of March 2018 (south Backa) and the first decade of April 2018 (north of Backa). Soil preparation for sowing was in the system of reduced tillage, done with Vibroflex 7,4m working width. Sowing was done with 4 planters (2NG and 2NH) with 12 seeding metering unit mechanically powered, with vacuum pressure and pneumatically section control. Inter row spacing is 0,7m. Sowing quality was checked in accordance with ISO 7256-1: 1984 / Sowing equipment. Modern seeders are equipped with sensors that are tasked with tracking the seeded population and to alarm problems with deviation from the norm. By connecting the planter to the navigation device, the density population, the percentage of double places, the percentage of empty places is recorded (Figure 1). Average yield was added after harvest. In this case, the “point” on the map is the working width of the seeder, 8.4m and the length of 20m. Sowing quality parameters are given in common for all seed sections for the given point. On average, 59points/ha were obtained. Based on the data from the map, a conclusion can be given on the planting quality on the entire sown surface.
Figure 1: Sowing map quality.

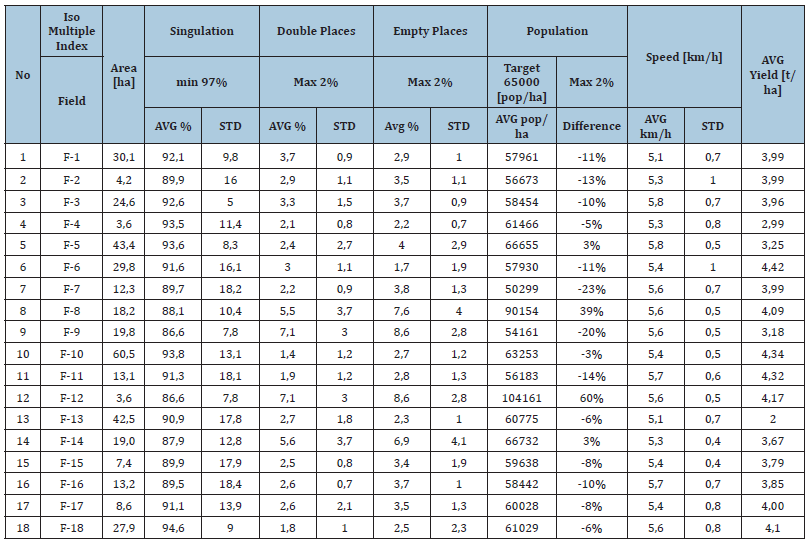
For each recorded individual layer, the processing and analysis of data in the software provides map, statistics for the entire parcel, as well as a histogram with a partition of surfaces with a certain parameter ranking. When the answer to the question about the size of the yield is requested after harvest, by overlapping the yield map with the sowing map, it can show the impact of sow quality on the yield. Sowing is an operation in which the advantages of the navigation systems are best seen. Sowing along an ideal straight line makes it easy to carry out the next operations and makes them more productive due to the possible higher speed of movement and making less damage to the crop. By using the sections control, the use of seed can be reduced to up to 5%. The shape of the plot is incorrect, savings are greater. The sowing of multiple seed planters on one plot during the day is a challenge, and almost impossible to realize during the night. If each planter is on a separate plot, it is often necessary to provide logistics on each plot because they are interchangeably distant, which is required by an additional telehandler, additional worker, a transport unit for seeds and fertilizer for each plot. If one planter sow large plots, an area of more than 200ha, it takes 2 to 3 days to complete the sowing of that parcel. The consequence of such a method is the uneven emergence. With the use of “Vehicle Sync” technology, has enabled 4 seeders to work on one plot, with only one telehandler, one assistant worker and one transport unit. In addition, the working time coefficient was about 82.5% with a standard deviation of 2.5%, that is, the seedlings work effectively 19.2 hours-20.4 hours per day. With a smaller number of seeders and lesser logistics, larger areas are sown and no more planters are needed (Table 1). The random sample system extracted data from big data records collected from over 18 parcels and an area greater than 380ha. The average seed population had a coefficient of variation from negative 23% to positive 60% in relation to the given seed rate. The average number of well-planted seeds ranged from 86.6% to 94.6%. The average number of double seeds ranged from 1.7% to 8.6%, and the average number of empty places ranged from 1.4% to 7.1%. Due to the large deviation and the characteristic cyclic repetition of the error in a big data sample, it was concluded that the sowing did not meet the required planting quality standards. Now when is clear that the problem exists due to unsatisfactory results of sowing, it was present to find reasons. Based on the conducted observations when measuring the seedlings in a row, the depth of sowing was very different. The range of change ranged from 15% to over 35% (random sample).
Table 1: Seeding analysis results.

In the case of NH seeder, the deviations were smaller, while more extensive dilations were recorded in the NG seeder. The reason for these differences in sow depth can be seen in the following photos. First, Figure 2 shows the direction of soil tillage. The tillage direction was about 30o in a negative mathematical direction from the sowing direction (the angle closing right 1 and 2 in Figure 2). Secondly, two planters are designed for direct planting of crops, while the other two are for sowing after conventional soil treatment. In Figure 3 two seeding zones are observed. The first zone is marked with A and the other with B. Two seeding zones were observed that differ in the fact that zone A, zone of compacted soil (untreated) and zone B, zone of loose tillage soil. These zones are formed in soil tillage with a combined low-speed soil compacting machine consisting of short discs (two separate segments) and tins (on elastic supports). Another factor that affected the poor sowing is caused by the depth of tillage. The tillage depth did not exceed 0.1m in zone A, and in Zone B, it was usually 0.05m. The consequence of shallow treating particularly caused problems on plots where there were a lot of harvest residues. Changing the depth of sowing and the appearance of zones of different depths is shown in Figure 4.
Figure 2: Line2 marks direction of planting and line 1 marks direction of tillage.

Figure 3: Marks A and B for formed different tillage zones.

Figure 4: Differences and variance of tillage depth.

The advantage of using precision farming systems, acquisition and then Big Data analysis is significant from the aspect of profitability of agricultural production. The registered error at the beginning will ensure quick and effective detection and removal of the cause.
Given collected and processed sowing data are obtained:
A. Precise information on the quality of the operation performed on the entire surface;
B. Mapping gives right information about the proper layout of the seed over the surface, or a trap of an average population without variation information is avoided;
C. There is accurate and precise information about the quality of sowing and business decisions are not made on the basis of assumptions about sowing quality.
© 2020 Stanko Opranica. This is an open access article distributed under the terms of the Creative Commons Attribution License , which permits unrestricted use, distribution, and build upon your work non-commercially.
 a Creative Commons Attribution 4.0 International License. Based on a work at www.crimsonpublishers.com.
Best viewed in


.jpg)


 Editorial Board Registrations
 Submit your Article
 Refer a Friend
 Advertise With Us
.jpg)


.jpg)


.bmp)
.jpg)
.png)
.jpg)


.jpg)


.png)

.png)


.png)


