- Submissions

Full Text
Modern Concepts & Developments in Agronomy
Nom-Invasive Determination of Potato Breaking Strength by Mid-Infrared Microspectroscopy
Huidan Xue1 and Wen Hao Su2*
1School of Agriculture and Food Science, University College Dublin, National University of Ireland, Belfield, Dublin 4, Ireland
2Department of Biological and Agricultural Engineering, University of California, Davis, One Shields Avenue, Davis, CA, 95616-5270, USA
*Corresponding author:Wen Hao Su, University of California, Davis, Department of Biological and Agricultural Engineering, One Shields Avenue, Davis, CA, 95616- 5270, USA
Submission: September 13, 2019;Published: October 10, 2019

ISSN 2637-7659Volume5 Issue2
Abstract
Breaking strength (BS) is a very important parameter for evaluation of potato texture. The BS depends significantly on tuber moisture content and cooking degree. Therefore, it is necessary to monitor the tuber BS during the industrial production. In this study, Fourier transform mid-infrared (FT-MIR) spectra and reference values of potato BS at different drying times were collected. The spectral features were linked to the tuber BS based on multivariate calibration models in terms of principal component regression (PCR) and support vector machine regression (SVMR). It was concluded that potato BS could be successfully determined based on FT-MIR microspectroscopy
Introduction
Potato (Solanum Spp.) play a pivotal role in our human diet by offering various desirable nutritional and health benefits. The potato is a drought tolerant and food security crop produced in the short days while can provide more edible energy than other starchy foods Nevertheless, a major drawback of tuber product is that the high moisture content (about 80%) greatly shortens its shelf-life. Microwave drying is proved to be an effective way to obtain storable imperishable potato products [1]. Compared with convective drying, microwave drying has great superiorities in considerably reducing drying duration and producing better quality dried products. The texture is an important sensory property and it is closely associated with the surface property and the microscopic structure of a food. The molecular substances such as starch, protein, non-starch polysaccharide and lignin are important supporting parts of the tuber structure [2]. During thermal processing, starch gelatinization and retrogradation behaviours are the main factors that produce tuber textural variations. The breakdown of middle lamellae structural components and various cell walls in tuber could have a big impact on tuber texture [3]. As a major textural property, the breaking strength (BS) is the maximum engineering stress level that can be reached when the material fails to withstand loads. The potato BS can indicate its biggest capability of sustaining external stress while being compressed. Traditional manual methods by taste and appearance for tuber texture assessments are time-consuming and have a lower efficiency.
Fourier transform mid-infrared (FT-MIR) imaging spectroscopy, which combines optical microscopy with MIR spectroscopy, exhibits big advantages for comprehensive analysis of both high-resolution image and spectral data for rapid spatial localisation and characterisation of microstructures of various materials [4, 5]. Moreover, the MIR in the attenuated total reflectance (ATR) mode has been utilized in the evaluation of physicochemical properties of food products and has showed great potential for rapid determinations [6]. Sample absorbance associated with fundamental vibrations of chemical bonds can be fully recorded at each waveband in the MIR region which consists of four subintervals, namely fingerprint region, double bond region, triple bond region, and X-H stretching region [7]. As far as we know, there is no research for using such technique to analyze potato BS. Therefore, the main aim of this study was to investigate the time series variations of potato BS by MIR imaging spectroscopy in the ATR mode.
Materials and Methods
Samples preparation
Fresh potato samples, including Desiree red potato (origin: UK) and Rooster red potato (origin: UK) were collected and then stored at a freshness keeping compartment (about 4 °C, relative humidity 85%) to restrain enzyme activity and moisture loss of tubers. Tuber samples (thickness of 10 mm, axial length of 15 mm) were respectively baked in a lab-scale microwave oven (800W) for 0, 10, 20, 30, and 35s, with 50 samples (2 × 5 × 5) for 2 potato varieties. Among them, 40 samples were randomly selected as the calibration, and 10 samples (2 samples from each time period) were used as the validation. After, such tuber samples were first scanned by a FT-IR spectral imaging system and then their reference values of breaking stress were acquired based on a texture analyser.
Hyperspectral imaging system
The spectral imaging measurements were performed based on a LUMOS FT-MIR microscope (Bruker Optics, Germany) in ATR mode (Cao et al., 2016; Woess et al., 2017). This system was equipped with a IR beam splitter, a germanium (Ge) ATR crystal, a digital charge coupled device (CCD) camera, a liquid nitrogen cooled narrow-band photoconductive mercury cadmium telluride (MCT) detector, a solid-state laser, a permanently aligned RockSolidTM interferometer, and a deuterated triglycine sulfate (DTGS) detector. In this study, the ATR crystal was cleaned with 70% ethanol to eliminate interference and dried with a pure cotton fabric. Prior to each sample scan, a background spectrum (4cm-1 spectral resolution with 32 co-added scans) was first collected. Based on the fast and highly resolving digital CCD camera, visual images of tuber samples were obtained. The successive 32 scans for each point of a sample were co-added and converted to absorbance based on the OPUS 7.2 software. The spectra (4000 to 600cm-1) of 5 typical points of each sample were recorded and averaged to represent that sample. Although measurements were recorded in the wavenumber range of 4000 to 600cm-1, only the spectra in the fingerprint region (1500 to 900cm-1) were adopted and further investigated in this study.
Data analysis
The collected tuber spectral data usually contain systemic noises and random offsets due to instrumental drifts and variations in the total light. To remove baseline offsets and reduce other undesirable information, the raw FT-IR spectra should be corrected by applying accepted mathematical pre-processing approaches, such as taking derivatives and fitting a baseline prior to modeling. Mean centering (MC) is also a preferred pre-processing approach, as it ensures that the model to be developed can be interpreted under most variation around the mean. The optimal pre-treatment combination should obtain the highest correlation coefficient (R) and the lowest root mean square error (RMSE) of cross validation (RMSECV). In this study, spectral data were preprocessed by baseline offset correction (BOC), area normalization (AN), second derivative (2nd Der), and MC. Principal component regression (PCR) is a two-step method to relate the variance in response variables to that of spectral variables.
For this, principal component analysis (PCA) is first carried out on the original X variables, then the generated PCs are used as predictors to fit a multiple linear regression (MLR) model. Support vector machine regression (SVMR) has been known as an effective approach that handles both linear and non-linear situations since the announcement of its theory and applications in many studies. The computational speed of SVMR can be improved based on a small subset of training points. Using the epsilon-intensive loss function, it is ensured that a global minimum is found and at the same time a generalization bound is optimized. The parameter epsilon controls the width of the epsilon-insensitive zone, which can be used to fit the training data. The value of epsilon can affect the number of support vectors used to construct the regression function. Normally, the bigger epsilon, the fewer support vectors are selected. Also, the parameter C in SVMR determines the tradeoff between the model flatness and the degree to which deviations larger than epsilon are tolerated in optimization formulation.
Results and Discussion
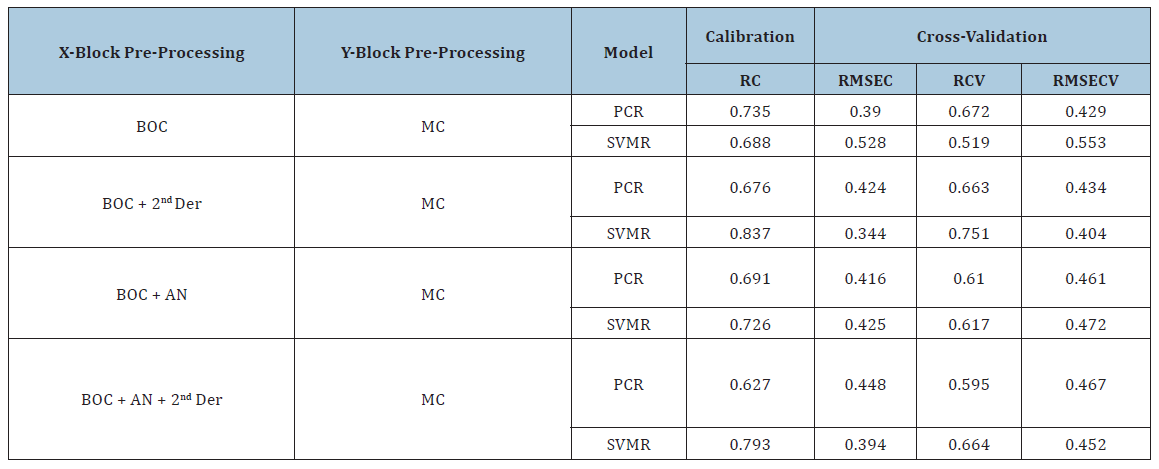
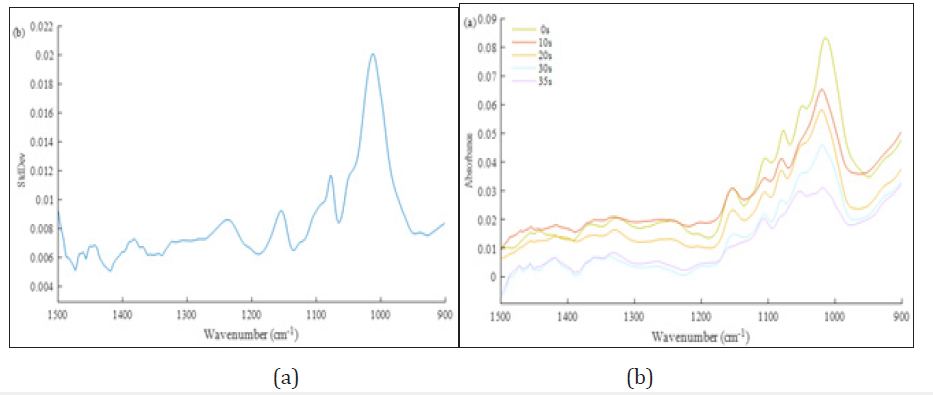
Figure 1 presents the raw FT-MIR spectra of potato samples in the fingerprint range of 1500 to 900cm-1. Similar trends of mean fingerprint spectra at various time points (0-35s) have been shown in Figure 1(a). As can be seen, the spectral amplitude and density are evidently influenced by heating time, especially for peak frequencies. The StdDev spectra (Figure 1(b)) were calculated based on the square root of the mean square of deviations from the mean. The StdDev amplitude and frequency showed the spread around of spectral variables and their mean values. Also, many molecular structures related to tuber texture could be recognized in the fingerprint region. When molecule interacts with the light from fingerprint region, chemical bonds will be able to vibrate more energetically, thus resulting in vibrational and rotational variations in the molecule. It is noticed that the vibrations of spectral amplitudes between 1250 and 950cm-1 are unusually intense. Specifically, the vibrations of C-C ring that are overlapped with the C-O-C glycosidic band vibrations and the stretching vibrations of C-O-H side groups are associated with the fingerprint spectra in the region of 1200 to 1000cm-1. Other spectral variations at 1429cm-1, 1357cm-1, and 1345c m-1 are assigned to C-N stretches and C-H deformations. The spectral absorption at 1015c m-1 is linked to the glucose and the vibration of C-O stretch is related to the absorption band at 1062c m-1. The crystalline state of starch could be assigned to the spectra located at round 1045c m-1. Based on the corrected spectra in the fingerprint region, PCR and SVMR models were established and compared to evaluate potato BS at five time points (0, 10, 20, 30, and 35s). The statistical parameters of both PCR and SVMR models for determining potato BS are shown in Table 1. Different spectral pre-treatment approaches were tested to assess the effect of these techniques in the model performance for predicting potato BS. In this study, all variables in Y-block were pre-processed using MC, and the spectral data in X-block were pre-treated by BOC, AN, 2nd Der or their combinations. The results presented in Table 1 illustrated that the model accuracies varied largely according to different modelling methods and spectral treatments. Based on PCR, BOC tended to show better performance than other pre-processing methods.
Table 1:Performance of fingerprint models for determination of potato BS

BOC: Baseline offset correction, 2nd Der: Second derivative, AN: Area normalization, MC: Mean centering, PCR: Principal component regression, SVMR: Support vector machine regression, RC: Correlation coefficient of calibration, RMSEC: Root mean square error of calibration, RCV: Correlation coefficient of cross-validation, RMSECV: Root mean square error of cross-validation.
Figure 1:(a) Raw FT-MIR absorption spectra and (b) StdDev spectra of all tuber samples in the fingerprint region (1500-900cm-1).

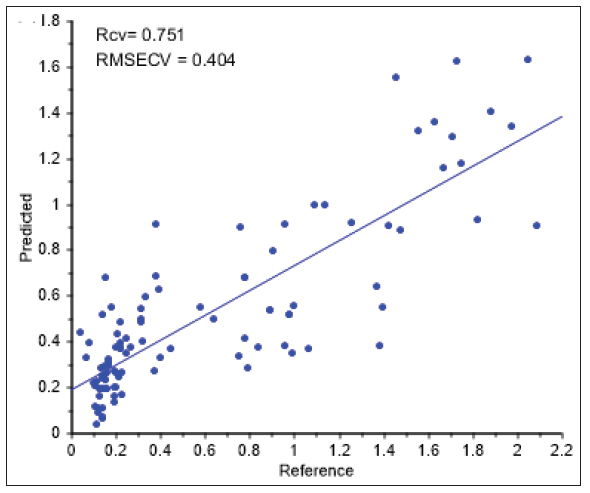
When the best PCR calibration model (RC=0.735 and RMSEC=0.390) developed using the BOC pre-treatment was applied to a cross-validation test set, acceptable detection results were achieved (RCV=0.672 and RMSECV=0.429), followed by cross-validation results of PCR with spectral pre-processing method of BOC plus 2nd Der (RCV=0.663 and RMSECV=0.434). Regarding SVMR, BOC plus 2nd Der was considered as the optimal pre-processing algorithm, followed by the method of BOC plus AN plus 2nd Der. Based on BOC plus 2nd Der pre-treatment, the highest accuracy (RCV=0.751 and RMSECV=0.404) (Figure 2) was obtained by applying the survived SVMR calibration model to its cross-validation test set. Such results confirmed that the model built by SVMR using the spectra in the fingerprint region had better performance than that of PCR in detecting potato BS. It is widely recognized that both the model prediction accuracy and the measurement of quality parameters will be affected by variations in reference data. In this study, a large variation was considered by collecting tuber samples from different categories, species, cooking degrees, and geographical locations, which meant that the mathematical model identified should have higher adaptability and forecast precision to unknown changes of external factors. Therefore, the SVMR model was assumed to be more robust for unknown tuber data.
Conclusion
This study demonstrated the potential of SVMR algorithm applied to MIR spectroscopy data in the fingerprint region (1500-900cm-1) to develop multivariate calibration models for determination of BS of potato products. The SVMR models are compared with those obtained with PCR models. Based on the measured BS values, the best result was obtained by the SVMR model, providing the RCV of 0.751 and the RMSECV of 0.404. Such results indicated that FT-MIR imaging spectroscopy was an effective approach for non-invasive and rapid determination of potato BS. In the future study, additional tuber origins and categories will be investigated to create more cooking time points to optimize developed models.
Figure 2:Performance of the SVMR model for determination of potato BS.

References
- Bondaruk J, Markowski M, Błaszczak W (2007) Effect of drying conditions on the quality of vacuum-microwave dried potato cubes. Journal of Food Engineering 81(2): 306-312.
- Kita A (2002) The influence of potato chemical composition on crisp texture. Food Chemistry 76(2): 173-179.
- Alvarez MD, Canet W (1998) Rheological characterization of fresh and cooked potato tissues (cv. Monalisa). Zeitschrift für Lebensmitteluntersuchung und-Forschung A 207(1): 55-65.
- Su WH, Bakalis S, Sun DW (2018) Fourier transform mid-infrared-attenuated total reflectance (FTMIR-ATR) microspectroscopy for determining textural property of microwave baked tuber. Journal of Food Engineering 218: 1-13.
- Su WH, Sun DW (2018) Fourier transform infrared and raman and hyperspectral imaging techniques for quality determinations of powdery foods: A review. Comprehensive Reviews in Food Science and Food Safety 17(1): 104-122.
- Trollope KM, Volschenk H, Görgens JF, Bro R, Nieuwoudt HH (2015) Direct, simultaneous quantification of fructooligosaccharides by FT-MIR ATR spectroscopy and chemometrics for rapid identification of superior, engineered β-fructofuranosidases. Anal Bioanal chem 407(6): 1661-1671.
- Su WH, He HJ, Sun DW (2017) Non-destructive and rapid evaluation of staple foods quality by using spectroscopic techniques: a review. Crit Rev Food Sci Nutr 57(5): 1039-1051.
© 2019 Wen Hao Su. This is an open access article distributed under the terms of the Creative Commons Attribution License , which permits unrestricted use, distribution, and build upon your work non-commercially.
 a Creative Commons Attribution 4.0 International License. Based on a work at www.crimsonpublishers.com.
Best viewed in


.jpg)


 Editorial Board Registrations
 Submit your Article
 Refer a Friend
 Advertise With Us
.jpg)


.jpg)


.bmp)
.jpg)
.png)
.jpg)


.jpg)


.png)

.png)


.png)


