- Submissions

Full Text
Modern Concepts & Developments in Agronomy
Evaluation and Breeding of Lowland Rice Varieties for their Yield and Tolerance to Biotic and Abiotic Stresses in Benin and Togo: Implication for Genetic Improvement of Rice in West Africa
Magloire Oteyami1*, Moussa Sie2 and Adam Ahanchede2
1Faculty of Agronomic Sciences, Benin
2Institute of Environment and Agricultural Research, Ouagadougou
*Corresponding author:Magloire Oteyami, Faculty of Agronomic Sciences, Benin
Submission: May 27, 2019;Published: June 13, 2019

ISSN 2637-7659Volume4 Issue4
Abstract
Background: The objective of this study is to evaluate and breed rice varieties for their yield ability and tolerance to biotic stresses, major abiotic of lowland ecologies in Benin and Togo.
Method The plant material consisted of 1901 interspecific and intraspecific lines. The integration resistance test results (DITER) developed by NOTTEGHEM (1977) were used for this research. Individuals from different lineages were multiplied to form the seedling plots. The measured parameters focused on: Sowing cycle (SC), Height at maturity (Hm), Tillering (T30 and T60), drought, iron toxicity, dead hearts, and leaf blast. Data were taken on ten plants from each of the Disjunct Lines (DL) in Benin and Togo. The use of descriptive rating scales from the Standard Evaluation System for Rice (SES) developed by IRRI (2010) was used during this research.
Key Results: Families from crossings WAB 638-1 x TOG 5681, WAB 638-1 x NERICAL35 TOG 7442 x NERICA- L41, TOG 5681 x NERICA-L41, TOG 5681 x NERICA-L42 and belonging to O. glaberrima x O. sativa, O. sativa x interspecific, O. glaberrima x O. interspecific, interspecific x O. glaberrima showed good behavior with respect to biotic and abiotic stresses and have a good Sowing Cycle (<120jas) and a very good tillering (20-50Talles) in both Benin and Togo.
Conclusion: They therefore have a very good adaptability to the agro-ecological conditions of Benin (low slope) and Togo (minor bed).
Keywords:Lines; Breeding; Stress; Rice; Benin; Togo
Introduction
Food security is one of the main development issues of African countries. The case of rice is a good example of the continent’s dependence on the outside (Del Villar et al., 2001). Indeed, rice imports have reached values such that they weigh in the countries’ trade balance. These annual imports are haemorrhages of foreign exchange that cause serious imbalance in the country’s trade balance, although the country is full of rice potential [1]. In order to offset these imports, an unavoidable need to increase local production is essential. This increase depends, on the one hand, on the area, on the increase in yield and on the other hand on the improvement of the final product. In this respect, the lowlands, although they represent only a small fraction (5%) of arable land in West Africa, constitute areas to be exploited to increase rice production. Indeed, with fertile soils and a relatively abundant water supply, they offer great potential for agriculture [2]. At a rate of more than 5% per year, rice demand is growing faster in West Africa than anywhere else in the world. The extra production needed to meet this demand will have to come largely from these lowlands.
Agriculture in Benin is traditionally carried out under rainfed conditions. By inappropriate use, soils that are already poorly fertile can only erode quickly and become depleted in nutrients. Moreover, the supply of water is sufficient only during the rainy season so that without artificial irrigation; agricultural production cannot take place all year long. Due to the high population growth and the reduction of cultivable land, the exploitation of lowlands is thus very important for the future of this region (Giertz, 2006). Rice is a highly adaptable crop that can be grown in all ecosystems (irrigated ecosystems, trays of rainfed lowland and mangrove), is faced with many constraints (abiotic and biotic) limiting production in different ecologies, particularly those of the lowlands. These hydrological, climatic (drought, flooding, extreme temperatures), edaphic (salinity, alkalinity, iron toxicity, phosphorus deficiency, Zinc) biological (blast virus, rice yellow mottle, weeds, insects, birds) and socio-economic factors. Among these constraints, those of biotic and abiotic order are the factors weighing on the gains of yield.
Area of study
This study was conducted in two countries in West Africa. It is a part of Benin and Togo on the other hand. For this purpose, the experiments were conducted respectively in the village of Sowe (Glazoue) and the village of Adeta (kpalime). Figure 1 below shows the evolution of the rainfall observed in Sowe and Kpalime. This observation takes into account the study period of 2012 as well as the arithmetic mean (OA) of cumulative rainfall from 2003 to 2012. The experimental plot was established at Sowe (Benin) and Adeta (Togo). These two sites were located respectively in the hydromorphic zone of transition of the shallow bottom, called lower slope, characterized by a sandy loam soil and then, in the lower zone of the so-called bottom bed whose soil is silty clay texture. The various sites, subject to experimental study, were designed to better conduct the experiment.
Figure 1:Rainfall trend observed at Sowe (b) and Adeta (a), Magloire O, 2013.

Matérial and Methods
• Plant material
The plant material consisted of 1901 interspecific and intraspecific lines. These are the lines of which some characters are segregated within each individual of the lineage. In addition to these different materials, witnesses and testers were used for this research. It is:
a. Three witnesses: WITA 12, WITA 4 and TGR19,
b. Testers: Bouake 189 (susceptible to blast and yellow variegation),
c. ITA 306 (AfRGM sensitive).
Experimental design
Figure 2:Diagram of a device in DITER (Notteghem, 1977).
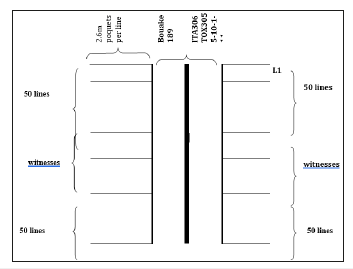
The device used for the implementation of the tests is the evaluation test of resistance with decreasing inoculum (DITER) developed by Nottingham (1977). The lines to be tested, the number of 1901 including controls, are sown perpendicularly to the infective band (sensitive band) in the device DITER. These lines are placed in plots consisting of two rows 2.6m long. The three indicators are inserted after 50 entries (Figure 2). In fact, two rows of interspecific lines 2.6m long and spaced 0.20m apart were created for this study. It is the same for those of F6 and F7. The infective band, sown in-line on the same day as the lines studied, was composed of a mixture of three varieties: Bouaké189 (susceptible to blast and yellow variegation) ITA 306 (sensitive to AfRGM) and TOX 3055-10 -1-1-1 (Blast sensitive). For this purpose, the spacing used between lines and between pockets is 20cm x 20cm.
Test management
Preparation of the test: The plots were prepared in lowland rainfed rice in Sowe in July, while in Adeta (Kpalime), they started in June. The soil preparation consisted first of all in a first disc plowing, carried out at a depth of 0.20m with burial of the straw, which took place 15days after mowing followed by a second plowing (a week after the first plowing), followed by manual grinding and mechanical leveling (harrowing). Then, a parcellation of the site was done, by means of the stakes and the decameter, to subdivide the field in blocks and parcels of dimensions allowing a good water management and an optimal exploitation of the site. Finally, bunds and drainage channels were made using hoes along the contours to delineate the rice pots planted and / or transplanted and to better conserve water. This activity has improved the structure and texture of the soil to promote root growth of rice plants. Following this work, labeling was carried out in order to better identify the different test plots.
Sowing and transplanting: In lowland rainfed rice (Sowe), direct seeding with three grains per pocket at 0.20m x 0.20m spacings. On the other hand, in flooded rice cultivation (Adeta), a nursery was carried out online on 01m x 10m planks. Transplanting was done 18 days after completion of the nursery. Each line is planted on two lines 2.6m long with the same spacing as Sowe. Controls were sown to assess the degree of disease pressure. The infesting band was sown in continuous lines on two lines with a spacing of 0.20m between the lines to homogenize the epidemic.
Fertilization
Basal manure used at planting is 200kg/ha of NPK (15-15-15) on the lines and on the infesting band. Urea was fed at 65kg/ha at the panicle initiation and 35kg/ha at the grain filling on the lines and 100kg/ha on the infesting band to increase the pressure of the inoculum. The different doses of fertilizer made to the rice were weighed, using a precision balance, in order to avoid the overdose.
Plot maintenance: Maintenance work was limited to manual weeding and the use of hoes. Indeed, three weedings were carried out according to the level of grassing of the parcels. Mating was carried out in lowland rainfed rice (Sowe) and lowland flooded rice (Adeta) at one plant per plant during the first weeding. No phytosanitary treatment has been carried out.
a. Measured parameters
Average number of tillers at 30 and 60 days after sowing or transplanting by pocket (T30, T60):This variable indicates the ability of the line to tillering. This is one of the most important indicators of good paddy grain yield. The count of the average number of tillers at 30 and 60 days after sowing or transplanting was carried out on 10 selected plants in the middle line of the plot.
Average height of mature plants (HM): Ten plants from each plot of the lines were chosen for measurements of plant height at maturity. This measurement (in cm) was taken from the bottom of the plant at the tip of the panicle leaf or at the end of the panicle using a graduated ruler taken from ten plants. This parameter is all the more important in that it contributes to the reduction of lodging.
Sowing Seasoning Cycle (SSC): This is the number of days after sowing after which half of the panicles are flowering. This parameter provides information on the earliness or tardiness of the plant with respect to biotic or abiotic stress.
Sensitivity to blastosis: IRRI (2012) scoring scale of 1 to 9 was used to estimate the incidence of disease at 56 days after planting or transplanting for leaf blast. For the evaluation of the blast in our experiment, we considered all the two lines which constitute the plot.
0: No lesions observed
1: small brown spots or large brown spots without sporulation
2: Small rounded or slightly elongated spots, spots
Necrotic gray
3: significant number of lesions are on the upper leaves
4: lesions 3 mm or more, infecting less than 4% of the surface
Foliar
5: lesions infecting 4-10% of the leaf area
6: lesions infecting 11-25% of the leaf area
7: lesions infecting 26-50% of the leaf area
8: lesions infecting 51-75% of the leaf area and many
Leaves are dead
9: More than 75% of leaf area is affected
Sensitivity to iron toxicity: The evaluation of iron toxicity is performed by giving a score ranging from 0 to 9 depending on the severity of the effect of iron on rice plants according to IRRI (2012). The observation was made 76 days after sowing or transplanting in the different plots.
0: almost normal growth and tillering
1: almost normal growth and tillering; reddish brown spots
3: almost normal growth and tillering; old red-brown leaves,
5: delayed growth and tillering; a lot of discolored leaves
7: growth and tillering ceases; most discolored leaves
9: almost all plants are dead or dying
Sensitivity to drought: The evaluation of this abiotic stress on the different disjunctive lineages, during the reproductive phase (heading stage), refers to the Standard Evaluation System (SES) rating scale of the IRRI (International Rice Research Institute).
0: no damage
1: normal heading, imperceptible damage
3: normal heading with poorly filled grain
5: normal heading with 50% sterility
7: heading with complete sterility of the grains
9: no heading
Behavior of the lines against insect attacks: The level of infestation of the lines by insects was first assessed by counting dead hearts on ten plants and then calculating the average of dead hearts. Then, a calculation on the percentage of infected tillers was carried out in order to better assess the incidence of stem borers attacks on all the lines. Thus, based on the percentage of infected tillers, ratings were assigned for each crossing number according to the SES.
0: no damage
1: 1-10%
3: 11-20%
5: 21-30%
7: 31-60%
9: more than 60%
Breeding:
a. Breeding principles
Breeding criteria, on which the selection of disjunctive lineages must be based, are on the one hand on the vegetative characters and on the abiotic and biotic constraints on the other hand, presented by these two backgrounds (bottom of slope) and minor bed) (Table 1).
b. Breeding approach
Table 1:Breeding of Field and Laboratory Lines.

Data analysis
Descriptive analysis of the agro-morphological quantitative variables used as descriptors was performed. Indeed, a study of the frequency distribution on these variables was carried out in order to analyze the performances of the lines with respect to the characters observed. Following this, a hierarchical ascending classification was carried out, by the Ward method, in order to constitute different groups of crossings. It is a statistical method that has the advantage of providing a spread of classes between the most trivial individuals (Fenelon, 1981 in Moukoumbi 2001). It uses average Euclidean distances and the aggregation is done according to the variance criterion. The representation is in the form of a classification tree or dendrogram. The knowledge of these groups is very useful in the choice of brood stock in breeding programs. This was done thanks to the STATISCA software. Analysis of the relationships between the parameters was performed using Principal Component Analysis (PCA) with the STATISCA software.
Result
Assessment of the performance of disjunctive lines in Togo for their agronomic traits
In order to better analyze agro-morphological variability, existing within the different lines in disjunction; the use of the hierarchical ascending classification (CAH) was adopted through Ward’s method. It was carried out on 1053 individuals from different crosses (F3-F7) and from six groups of lines. This classification was made from four (04) agro-morphological characters. The dendrogram thus produced by this method of Ward (CAH) allowed us to obtain three (0 3) large groups in which are distributed the different individuals numbered from V1 to V1053 (Figure 3). Aggregation distance was used to estimate intergroup distances when constructing this dendrogram. It made it possible to measure the gap existing between the different interspecific, intra-specific lineages and their respective groups. Thus, the number of class or group not being fixed in advance, the truncation of the dendrogram to the aggregation coefficient 20, allowed us to obtain three large groups containing 164, 372 and 519 observations. However, in order to better understand the classification criteria of the various dendrogram groups and their characteristics, the dynamic cloud method was chosen to respond to these concerns.
It consisted in analyzing the data of the different agromorphological observations inherent to each variable for the inter and intra-specific lines through an analysis of variance. The result from this analysis of variance (Table 2) allowed us to understand the discrimination of different individuals belonging to different lineages in the three groups of the dendrogram. The analysis of this table shows that the following variables measured tillering at 30 (Tal 30) and at 60 days (Tal 60) after seeding, the Height at maturity (Htm) are very highly significant (P <0.1%). It is therefore deduced that it is the measurements of these very highly significant variables that have mainly made it possible to explain the grouping of different individuals from different crosses (F3-F7) within the different groups of the dendrogram. In contrast, the Sowing cycle (SSE) variable is not significant at the 5% threshold and therefore does not determine the distribution of individuals in the different groups of the dendrogram. Analysis of the (Figure 4-6) illustrating the average performance of individuals in each dendrogram group, from different families and from intra and interspecific lines, as a function of the variables, indicates that the individuals belonging to groups II and III show a similarity of the agronomic characters morphological. These are groups whose expression of genetic potential is expressed in the same way for the different parameters measured. In addition, individuals belonging to groups (I and II) can be described as stable individuals while individuals in group 1 are said to be unstable individuals because they have not fully acquired the characteristics of their parents. Indeed, the figures above show a great variability within individuals from the same family and between families. Individuals belonging to group (I) are mostly discriminated against height because a comparative analysis of the characteristics of group I relative to the various statistical parameters evaluated, in particular the mean, the standard deviation and the variance, illustrates that the difference -type observed for the height is 18.09 compared to that of the other groups (II and III) where we note respectively 7.29 and 6, 92. The characters (Tallage, height and sowing cycle-heading) of the group I are considered to be segregated characters.
Figure 3:Dendrogram of the 1053 individuals from the six groups of lines.
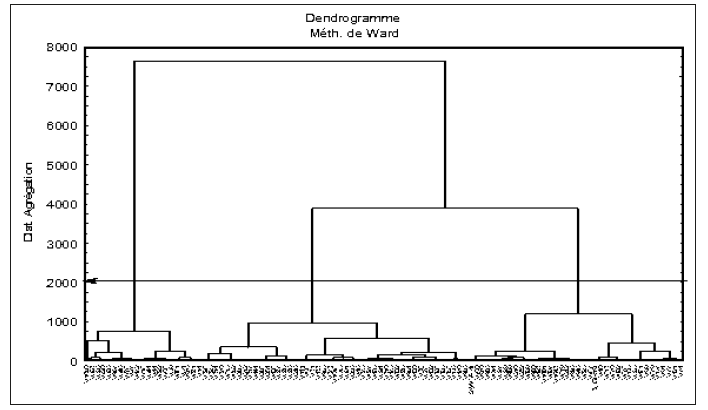
Figure 4:Performance of Individuals from Group I Crosses (Togo).
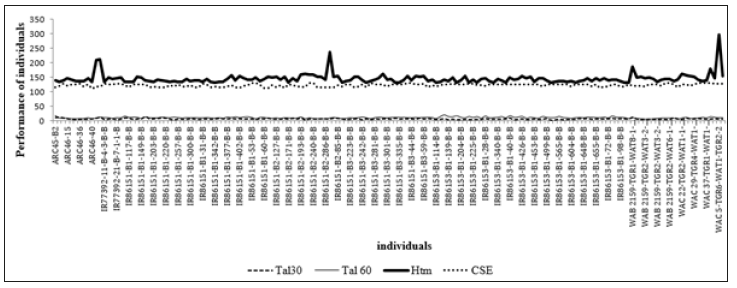
Figure 5:Performance of Individuals from Group II Crosses (Togo).
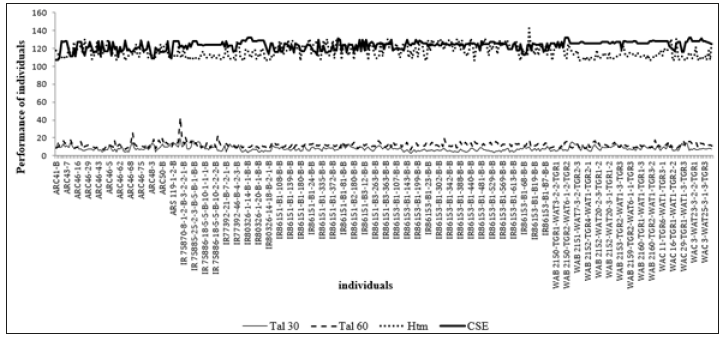
Table 2:Analysis of variance of different agro-morphological observations.

***: very highly significant (P<0.001); **: highly significant (P<0.01); *: significant (P<0.05); SC=mean square
Evaluation of the performance of disjunctive lines in Benin for their agronomic traits
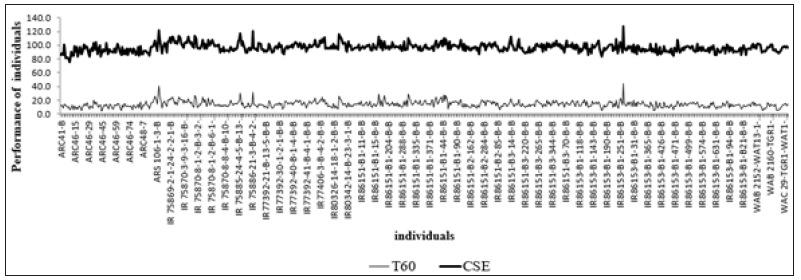
This classification was made from two (02) agro-morphological characters. The dendrogram thus produced by this method of Ward (CAH) allowed us to obtain two (02) large groups in which are distributed the different individuals numbered from V1 to V1053. (Figure7). The aggregation distance made it possible to measure the gap between the different interspecific and intra-specific lineages and their respective groups. Thus, the truncation of the dendrogram at the aggregation coefficient 15, allowed us to obtain two large groups containing 414 and 642 observations. The result from the analysis of variance (Table 3) allowed us to understand the discrimination of different individuals belonging to different lineages in the two groups of the dendrogram. The analysis in this table shows that 60-day tillering (Tal 60) after sowing and halfemergence are very highly significant (P <0.1%). It is therefore deduced that it is the measurements of these very highly significant variables that have mainly made it possible to explain the grouping of different individuals from different crosses (F3-F7) within the different groups of the dendrogram. The individuals belonging to group II can be qualified as stable individuals while individuals in group I are said to be unstable individuals because they have not fully acquired the characters of their parents. Indeed, the above (Figure 8&9) also show a great variability among individuals from the same family and between families. Individuals belonging to group (I) are especially discriminated against the sowing-heading cycle because a comparative analysis of the characteristics of group I relating to the various statistical parameters evaluated, in particular the mean, the standard deviation and the variance, illustrates that The standard deviation observed for the seedlingheading cycle is 6 compared to that of group II where the standard deviation is 3. The traits (Tallage and seedling-sowing cycle) of group I are considered to be traits in segregation.
Figure 6:Performance of Individuals from Group III Crosses (Togo).
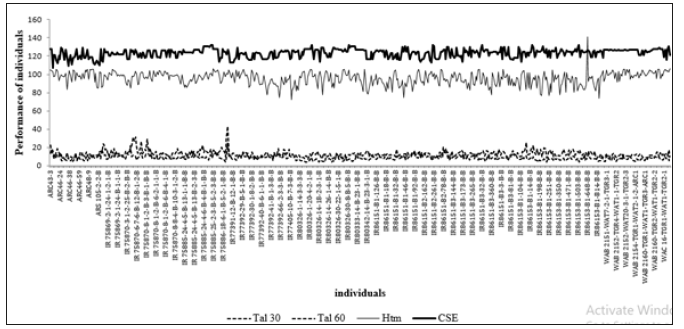
Figure 7:Dendrogram of the 1053 individuals from the six groups of lines.
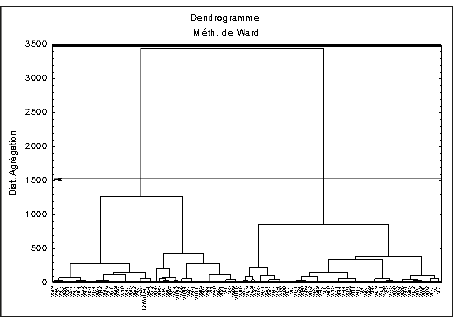
Figure 8:Performance of Individuals from Group I Crosses (Benin).
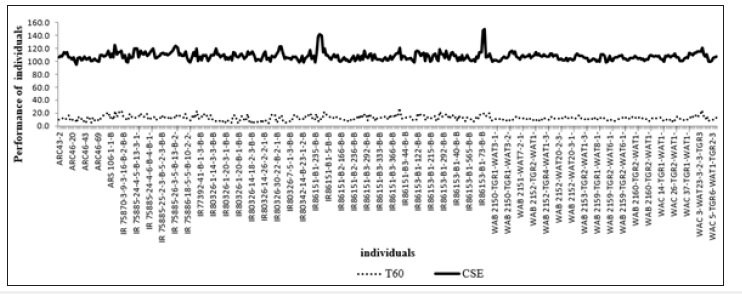
Figure 9:Performance of Individuals from Group II Crosses (Togo).
Assessment of the performance of the lines against biotic and abiotic stresses
Some lines (intra and interspecific) showed low susceptibility to foliar blast attacks. In fact, 69% of individuals who received grade 1 had small brown spots or large brown spots without any central sporulation. They are therefore tolerant to leaf blast. However, 0.30% are hypersensitive to leaf blast (Figure 10). These are the individuals who received the number 9 as a mark. In fact, more than 75% of their leaf area is affected by leaf blast. In addition to this category of individuals, 0.40% and 0.15% of the lines are also highly sensitive in the lines (Figure 10). These are the individuals who received grades 7 and 8. In fact, those who scored 7 indicate individuals whose foliar lesions occupy 21-50% of the leaf area. While those with a score of 8 are individuals with lesions occupying 51-75% of the leaf area. Lines (intra- and interspecific) behaved differently with respect to iron toxicity. Individuals from the lines also showed tolerance for iron toxicity. In fact, 95% of individuals maintain growth and tillering in an almost normal state, but with old leaves ranging in color from brown to orange yellow. While 1% of individuals maintain their growth and tillering in an almost normal state; but with reddish brown spots or orange discoloration on the tips of older leaves (Figure 11). The impact of drought on lineages is assessed at four levels. In fact, 85% of the individuals (Figure 12) belonging to O. glaberrima x O. sativa or O. sativa x O. glaberrima, O. sativa x interspecific, interspecific x interspecific, interspecific x O. sativa, O. sativa x O. sativa displayed a heading with complete sterility of the grains. While 7% of the O. glaberrima x O. sativa, O. sativa x O. glaberrima, O. sativa x interspecific and O. sativa x O. sativa lines exhibited normal heading with 50% sterility. Apart from these previous categories, it is also observed that 3% of the O. glaberrima x O. sativa or O. sativa x O. glaberrima, O. sativa x interspecific and O. sativa x O. sativa lines have a heading. With 2% of the O. sativa x O. glaberrima and O. sativa x O. sativa lines did not display heading.
Figure 10:Distribution of lines according to foliar blast susceptibility.
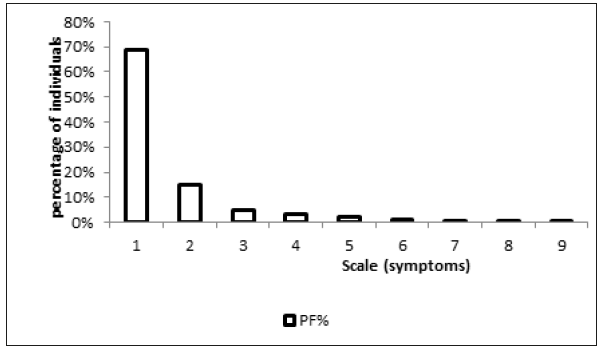
Figure 11:Lineage distribution according to susceptibility to iron toxicity.
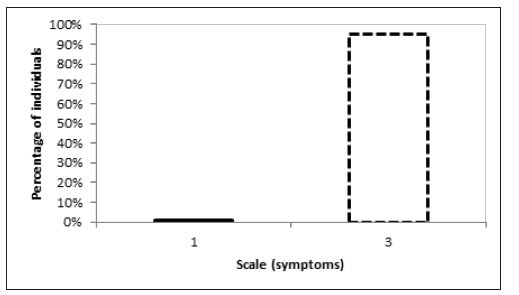
Figure 12:Distribution of lines according to the sensitivity to drought.
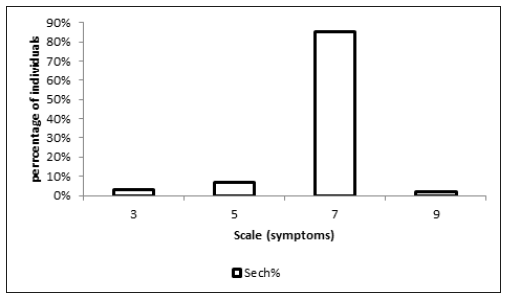
In view of these behaviors, it is found that drought has seriously affected all lines
Figure 13:Distribution of interspecific lines according to susceptibility to stem borers.
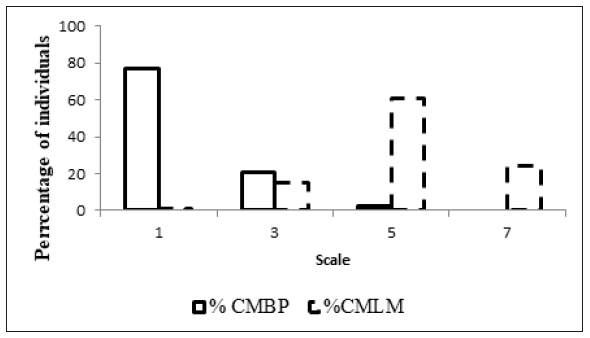
The performance of interspecific lines against the attacks of stem drillers at the bottom of the slope suggests three types of structuring. It is firstly 77.07% of individuals whose percentage of tillers infected by dead hearts is between 1-10%, then 20.7% of individuals whose percentage of infected tillers is between 11- 20%. Then 2.2% of individuals whose percentage of infected tillers is between 21-30% (Figure 13&14). On the other hand, on all interspecific lines (minor beds), there are four types of structuration. It is 0.18% of individuals whose percentage of infected tillers is between 1-10%, then 14, 97% of individuals whose percentage of infected tillers is between 11-20%. As a result, 60.62% of individuals whose percentage of infected tillers is between 21-30%. Finally, 24.21% of individuals whose percentage of infected tillers is between 31-60%. Compared to interspecific lines, the intraspecific lines of the two sites are not expressed in the same way against the attacks of stem borers. Indeed, on all the intraspecific lineages (bottom of slope), one notes two types of structuration. It is 82.25% of individuals whose percentage of infected tillers is between 1-10% and 12.38% of individuals whose percentage of infected tillers is between 21-30% (Figure 13). While on all the intraspecific lines (minor beds), 13,86% of the individuals whose percentage of infected tillers is between 11-20%, then 73,04% of the individuals whose percentage of infected tillers is between 21-30% and 13.08% of individuals whose percentage of infected tillers is between 31-60%.
Figure 14:Distribution of intrapecific lines according to susceptibility to stem borers.
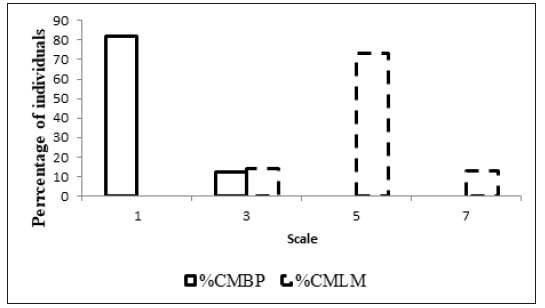
Partial conclusion: Intraspecific lines show more tillers infected by stem borers than interspecific lines. On the other hand, the minor bed favors the susceptibility of the lines to stemborer drillers than the bottom of the slope.
Lines of Breeding
Agro-morphological evaluation of 1053 individuals from intraand interspecific lines revealed genetic variability among them. This variability made it possible to select low-slope and low-bed lines based on biotic, abiotic, seedling-sowing and tillering stresses at 60 days after sowing. Thus, the selected families are those from interspecific lines. It thus appears that the WAB family’s 638-1 x TOG 5681, WAB 638-1 x NERICA-L35 ; TOG 7442 x NERICA-L41, TOG 5681 x NERICA-L41, TOG 5681 x NERICA-L42, from O. glaberrima x O. sativa, O. sativa x interspecific, O. glaberrima x O. interspecific and interspecific x O. glaberrima are those with a good seedling cycle and good tolerance to foliar blast, iron toxicity and drought.
Discussion
Evaluation of the performance of lines in disjunction
The lowest tilling’s, recorded at 30 days after sowing, were observed in O. sativa x interspecific, interspecific x O. sativa and O. sativa x O. glaberrima and O. sativa japonica x O. sativa japonica and on the witness TGR 19 met in the minor bed. While O. glaberrima x O. sativa, interspecific sativa x and families TOG5681 x NERICA-L42, NERICA-L56 x GAMBIAKA, NERICA-L15 x WITA 9, NRICA-L15 x FKR19, NERICA-L41 x FKR 19, IR68552-55-3-2 x TOG5674 and IR69502-6-SRN-3-UBN-1-B x TOG 7291 showed low tillering at 60 days after sowing at the bottom of the slope. The low tilling at 30 days after sowing recorded at the level of the minor bed can be explained by the fluctuation of the basic temperature of the genotypes during the juvenile phase. In fact, the juvenile phase is strongly determined by temperature and does not seem to be affected by either photoperiod or vernalization [3]. In addition, the genetic traits of the Asian species which come from most lines do not allow individuals from these lines to express good tillering. Indeed, the Asian species belonging to the subspecies javanica is characterized by low tillering (Matsuo, 1952, change and bardenas, 1965, jacquot and arnaud, 1979). On the other hand, low tillering at 60 days after sowing, recorded at the bottom of the slope, is justified by the water deficit of the soil, which does not allow the African species to produce additional tillers between 40 and 80 days after germination (Jones, 1997). This low tillage is also due to the action of the photoperiod because it has been postulated that the action of the photoperiod would act on the number of leaves [4].
On the other hand, the reduction in tillering observed from the lower bed to the lower slope in all O. glaberrima x O. sativa japonica lines could be explained by the different soil types at the two sites. Indeed, Curfs (1976) quoted by Diatta (1996) showed that the sandy soils of the lowlands of Nigeria are less productive than the loamy-clay soils, regardless of the soil preparation or the application of nitrogen. Because of the unfavorable chemical fertility of these soils. In addition, the shallow groundwater table in the minor bed would be involved in the nitrogen supply of rice due to its variable mineral nitrogen concentration [5] (Bertrand et al., 1973). On the other hand, the high number of tillers in the O. sativa x O. sativa lines at the bottom of the slope, unlike those of the minor bed, could be due to the early flooding which could have a depressive effect on tillering because the lines of the Asian species bear less fluctuations in the water table. Then, the earliness of the sowing-epiaison cycle observed at the level of a few rare lines of O. sativa x O. glaberrima, O. glaberrima x O. sativa, a few rare lines O. sativa x interspecific, WAB 638-1 x TOG 5681, NERICA-L41 x TOG 5672, TOG 7442 x NERICA-L41, TOG 5681 x NERICA-L41, TOG 5681 x NERICA-L42, WAB 638-1 x NERICA-L35 and the interspecific lines x O. sativa of the minor bed is also justified by the basic temperature of the genotypes. Indeed, it has been noted that the action of the photoperiod would act on the number of leaves, while the effects of temperature would influence the duration of the cycle [4]. In addition, this precocity is due to the duration of the vegetative phase of the different individuals from these lines. Because, the precocity of a cultivar is essentially a function of the duration of the vegetative phase (Bloc et al., 1983). In addition, this precocity is also explained by the level of generation of these lines (F3, F6 and F7). Indeed, Chang and Li. (1979) estimate that the heritability of the duration of the semisolid cycle is between 53 to 95% for F2. As a result, the lines being preselected at this generation level, would have acquired the majority of genes governing this trait. Crosses made between parents insensitive to photoperiod and having different juvenile phases, frequently show a dominance or a super dominance of precocity for F1. According to these same authors, this would be explained by the control of the juvenile phase by a series of dominant Ef genes controlling the duration of said phase. Chatel and Dechanet [6] also confirm dominance and super dominance for precocity with an average heritability of 30%. Ef genes could explain the monogenic or multigene control of the heading date with the partial dominance of early maturity on the long cycle (Chang and Li, 1979). The difference in sowing-heading cycles observed within the lines could be explained by the allelic presence on the E and Se locusts. On the other hand, all interspecific lines are early at the lower slope. This could be explained by the “early” carcass of the African species that is introgressed in the lineages.
In contrast to interspecific lines, the “early” carcass found in the O. sativa x O. sativa lineages of the lower slope is justified by the cultural practice that reduces the seedling-heading cycle of the Asian species. Indeed, the Asian species has a long sowingheading cycle [7]. Regarding the variable “height of the lines”, there is a very great variability within the plant material. The size of O. sativa japonica x O. glaberrima, interspecific x O. sativa, O. sativa x O. sativa and control TGR19 is greater than 110cm and can be classified as intermediate varieties proposed by Arraudeau and Vergara (1992) cited by Adeyemi and Vodouhe [8]. This type of interspecific line can be grown in strict rainfed rice or short-flood lowland rice cultivation. This intermediate size would favor a better vigor of the plants at emergence and make them more competitive with weeds in rainfed rice. On the other hand, the intermediate size of these lines could reflect a positive correlation between plant height and depth of rooting. As a result, they will be able to better value fertilizers and irrigation, thus responding to intensification. In contrast, WITA 4 and some O. sativa japonica x O. glaberrima, interspecific x O. sativa, O. sativa x O. sativa, are classified as semidwarf because of their height of 80cm. and 110cm. According to Yoshida [4], the semi-dwarf size makes it possible to improve the harvest index and consequently makes them more suitable for intensive cultivation. However, the difference in size observed for the same types of lines placed under the conditions of a minor bed and a low slope can be explained in relation to the height of the lines which is positively correlated with the thickness of the water slide [9]. In fact, Sié [10] write that 56% increase in the size of the varieties depending on the thickness of the water slide.
Evaluation of the lines against biotic and abiotic stresses
The low incidence of parasite pressure observed at the lower slope had to favor a better behavior of intra and interspecific lines. All intra- and interspecific lines did not show severe signs of blast or attack from stem borers during their vegetative cycle. In contrast, controls WITA 4, WITA 12 and TGR19 showed some symptoms related to leaf blast due to the high parasite pressure observed. However, [11] have shown from an evaluation of the varieties in natural condition of infestation that the incidence of blast disease can vary respectively from 2 to 100%. The behavior of interspecific lines with regard to diseases and insects could be explained by the expression of the “tolerance” character of the African species to these two biotic stresses [8]. Indeed, the African species, O. glaberrima has many qualities: resistance to drought; rusticity; the ability of the species to control weeds; resistance to blast; to helminthosporiosis; yellow variegation of rice; insects and nematodes. It also shows good plant vigor [8]. With regard to insect attacks, the percentages of infected tillers registered with the different genotypes are greater than 15% in both the lower and the lower beds. Insect attacks on the lines are much lower than those observed by the previous authors. Indeed, Hamadoun et al. [11] observed up to 1 to 34% of attacks by stem borers at M’ Pegnésso in Mali in lowland conditions. The low percentages of attacks recorded on intra- and interspecific lines during the current season could be explained at first glance by environmental conditions that did not allow the proliferation of insects. Subsequently, the behavior of interspecific lines could be expressed by the expression of resistance to insect attacks of the African species, which undoubtedly ensures resistance to interspecific lines. Complete grain sterility observed in O. glaberrima x O. sativa or O. sativa x O. glaberrima, interspecific O. sativa x, interspecific x interspecific, interspecific x O. sativa, O. sativa x O. sativa is due at the temperature observed during the test (30 °C). Indeed, a critical temperature of around 35 °C causes complete sterility of the grains [4] (Sereme 2002). In addition, the water deficit recorded during our tests varies between 50 and 150mm.
These amounts of rainfall are lower than the cumulative rainfall observed over ten years. As a result, rainfall amounts recorded during the trial period are significantly lower than the water requirements of paddy rice between 450 and 700mm [12]. As a result, the water table was insufficiently supplied, which resulted in rapid drying of the shallow. This does not allow lines to better express their potential for grain filling. The poor grain filling observed in some O. glaberrima x O. sativa or O. sativa x O. glaberrima, O. sativa x interspecific and O. sativa x O. sativa lines is due to temperature observed during the test (18 °C). In fact, a temperature whose minimum threshold is around 22 °C induces incomplete heading and delayed flowering [4]. Added to this is the order of appearance of the date of heading within the lines. Because it can be influenced by the minimum or maximum temperature [13-15]. The good response of interspecific lines to iron toxicity is explained by the “resistance” nature of the African species to this abiotic stress. Indeed, the African species has important traits that allow it to resist biotic and abiotic stresses. African rice shows resistance to salinity, drought and iron toxicity (Bezançon and Diallo 2006). It is a species that can survive under conditions of low input inputs and competitiveness with unwanted grasses (Sarla et al., 2005).
Lines of breeding
The different lineages are differentiated by the agronomic characteristics. In fact, the strong standard deviations are observed for tillering at 60 days after sowing (T60), height at maturity (HT), sowing-heading cycle (CSE) [16-18]. These noted discrepancies reflect genetic variability within the lineages. It is characterized by the very great heterogeneity found within the lineages. This justifies the use of breeding within the lineages for their improvement [19- 21]. Moreover, the orientation of the selection criteria (height, tillering, sowing-weeding cycle, panicles) for the selection of the lines is justified on the one hand by the fact that the decrease of the size of the plants and the production of the biomass could better valorize fertilizers and irrigation, thus responding to intensification and that shortening the length of sowing-heading cycles would allow a better optimization of the crop calendar on the other hand [22-24]. In addition, for adverse environments, breeding objectives include vigor, lodging resistance, a thin and deep root system, early maturity, average yield potential, long-lasting resistance to blast, kernels long and heavy and tolerance to aluminum toxicity (Chang, 1984). While for favorable environments, selection includes desirable morphological traits, high yield with many tillers, erect leaves, small plants with resistance to insects and diseases especially blast (De Datta et al, 1972).
Conclusion
The frequency distribution and the various notation scales used allowed classifications and groups to be made for the characters observed. Thus, the principal component analysis (PCA) followed by the hierarchical ascending classification (CAH) carried out on the intra and interspecific lines of Togo revealed three distinct groups, compared to that of Benin where we had two groups. The possibility of grouping the lines according to the observed variables leads us to say that the studied material abounds with important genetic potentialities. These potentialities revealed by this study will be exploited in the rice breeding program. In terms of the behavior of intra and interspecific lines with respect to disease and insect attack, drought and iron toxicity, the lines showed tolerance to foliar blast attack, and ferrous toxicity while sensitivity to drought was noted in these lines.
References
- FAO (2000) Trade yearbook, Rome, Italy Vol. 54.
- WARDA (1996) Annual Report p. 58.
- Summerfield RJ, Collinson ST, Ellis RH, Roberts H, Penning de Vries, F WT (1992) Photothermal responses of flowering in rice (Oryza sativa). Annals of Botany 69(2): 101-112.
- Yoshida S (1981) Fundamentals of rice crop science. International Rice Research Institute (IRRI), Los Banos-Laguna, Philippines, p. 269.
- Diatta S (1996) Gray basement soils on granito-gneisses in the central region of the Ivory Coast: Tolequential and spatial organization, hydrological functioning: consequences for rice cultivation. PhD thesis option: Agropedology, University of Nancy, France p. 53.
- Chatel M, Dechanet R (1978) Diallel analysis of some quantitative characters in rice. Agro Trop 4: 402-414.
- WARDA (2001-2002) Annual Report. Painting the Rice Red. Iron Toxicity in the Lowlands p. 29.
- Adeyemi P, Vodouhe SR (1996) Improvement of the productivity of the Oryza glaberrima Steud local varieties by intra and interspecific crosses with Oryza sativa Linne pp: 159-175
- Yon (2000) Characterization of interspecific (Oryza glaberrima X Oryza sativa) and intraspecific (Oryza sativa X Oryza sativa) hybrids for their adaptability to lowland rice cultivation. PhD thesis p. 82.
- Sie M (1991) Prospecting and genetic evaluation of traditional rice varieties (Oryza sativa L., and Orza glaberrima S.) from Burkina Faso. Ph.D. thesis, National University of Ivory Coast, p. 118.
- Hamadoun A, Traore M, Traore B (1996) Phytosanitary problems of lowland rice in southern Mali: review of research in development and development of lowlands in Mali. Balance sheet and national perspectives, interest for the West African savanna zone. Proceedings of the seminar. Sikasso, Mali Symposia, CIRAD, Montpellier, France, pp. 411-419.
- Doorenbos J, Kassam AH (1987) Response of yields to water. Irrigation and drainage bulletin N ° 33. FAO Rome, Italy, pp. 154-164.
- Cisse F, Doumbia Y (2004) Screening for dought resistance in Oryza glaberrima under lowland and lowland conditions in Mali. Proceedings of a wokshop held at Cuernavaca, Mexico, p. 355.
- Diatta S (1996) Gray basement soils on granito-gneisses in the central region of the Ivory Coast: Tolequential and spatial organization, hydrological functioning: consequences for rice cultivation. PhD thesis option: Agropedology, University of Nancy, France p. 53.
- FAO (2004) Production yearbook, Rome, Italy, vol.58.
- Fussel LK, Bioking FR, Bielev P (1991) Crop physiology and brooding for drought tolerance research and development. Field Crop Res p. 27.
- Gaft DF (1980) Photoplasmic tolerance of extreme water stress, in Adaptation of plants to water and light temperature stress, Turner NC, Kramer PJ (Eds.), Wiley interscience, New York, USA, pp: 89-103.
- Guiguaz M (2002) Memento of agronomy, new edition, Publishing House: CIRAD and GRET. p. 169.
- Hode G (2007) Study of the cultural and pathological variability of Grisea pyricularia an Abomey-Calavi in southern Benin Thesis for obtaining the Diploma of Engineering Works (DIT). pp. 5-38.
- Sie M (1982) The different types of rice cultivation practiced in Upper Volta and their improvement. Summary report, INERA, Farako-ba Station, Burkina Faso, p. 12.
- Sie M (1979) Varietal improvement of rainfed rice. Internship report. Institute of Tropical Agricultural Research and Food Crops (IRAT-CV). Ivory Coast, p. 150.
- Sie M (2004) Variety development and rice evaluation. Pre-base production techniques. Yamoussoukro, Côte d Ivoire.
- Sie M (2005) Breeding and varietal improvement of rice. Training workshop for promoting the use of PGRFA through selection and anonymous biotechnology. Singh BP, Das M.
- Sorho F (2006) The yellow variegation of rice in West Africa: phylogeograohy, pathogenesis and durability of natural resistance. Doctoral thesis, University of Cocodji, Ivory Coast, p. 177.
© 2019 Kirti PB. This is an open access article distributed under the terms of the Creative Commons Attribution License , which permits unrestricted use, distribution, and build upon your work non-commercially.
 a Creative Commons Attribution 4.0 International License. Based on a work at www.crimsonpublishers.com.
Best viewed in


.jpg)


 Editorial Board Registrations
 Submit your Article
 Refer a Friend
 Advertise With Us
.jpg)


.jpg)


.bmp)
.jpg)
.png)
.jpg)


.jpg)


.png)

.png)


.png)


