
- About Us
- Information
-

The Author ensures that the research has been conducted responsibly and ethically with adherence to all relevant regulations. read more..
- For Authors
- For Reviewer
- Manuscript Guidelines
- Membership
- Publication Ethics
-
- Journals
- Reprints
- e-Books
- Videos
- Policies
- Contact Us
 COVID-19
- Submissions


Full Text
Modern Concepts & Developments in Agronomy
Soil Tillage Systems Impact on Energy Use Pattern and Economic Profitability in Wheat Agroecosystems
Yousefi M1, Khoramivafa M1*, Mahdavi Damghani AM2, Mohammadi GR1, Beheshti Alagha A1
1Department of Agronomy and Plant Breeding, Campus of Agriculture and Natural Resources, Razi University, Kermanshah, Ir
2Department of Agroecology, Environmental Sciences Research Institute, Shahid Beheshti University, Tehran, Iran
3Department of Soil Science, Campus of Agriculture and Natural Resources, Razi University, Kermanshah, Iran
*Corresponding author: Khoramivafa M, Department of Agronomy and Plant Breeding, Campus of Agriculture and Natural Resources, Razi University, Kermanshah, Iran
Submission: December 12, 2018;Published: January 16, 2019

ISSN: 2637-7659 Volume3 Issue4
Abstract
The role of energy management is important and essential in sustainability of production systems. The aims of this study were evaluated the impact of different soil tillage on energy use in wheat agroecosystems. To purpose this research was carried on 2014 to 2016 years in research farm of Razi University in western Iran. The result of this study showed that total energy used in NT, RT, and CT systems was 31.39, 32.85, and 35.16GJha-1. In the other hands, production energy in NT, RT, and CT systems was 200.14, 207.68, and 195.26GJha-1. Accordingly, energy use efficiency (EUE) in NT, RT, and CT systems was 6.38, 6.32, and 5.55. Therefore, amount of EUE of different tillage systems followed the order of NT>RT>CT systems. In this research profitability of NT, RT, and CT systems were 3.23, 2.96, and 2.59. This result showed that more use of machinery and operation due to more use of energy resource can be reduced EUE, Net energy and profitability of agroecosystems.
Keywords: Energy use efficiency; Conservation Tillage; Sustainable production; Profitability; Economic
Abbreviations: EUE: Energy Use Efficiency; EP: Energy Productivity; CT: Conventional Tillage; RT: Reduced Tillage; NT: No Tillage
Introduction
Energy consumption in agricultural sector there has been an increasing trend from scratch to now. In the other hand by moving the pattern of agriculture trend from traditional agriculture to modern agriculture, the use of energy has increased particularly fossil fuel resources [1]. Farmers consumed energy directly in the form of gasoline, diesel, electricity, and seeds, and indirectly in energy-intensive inputs such as fertilizer and pesticides. Use of energy and Intensity of energy use is depending to high input and low input agriculture systems. Any amount the intensity of agricultural operations, chemical input and consumption of other energy inputs, was high it will increase the input energy in to agricultural production systems [2]. In addition of energy use, energy use efficiency was modified due to pattern of energy consumption in agroecosystems. More use of energy resource especially non-renewable energy resources will decrease the energy use efficiency (EUE) of agricultural production systems. Energy input-output analysis is usually applied to evaluate the efficiency and environmental impacts of production systems [3]. The International Energy Agency [4] and the Intergovernmental Panel on Climate Change [5] have calculated that use of energy efficiency measures drive south the greatest portion of emission reductions and stabilize the global climate. The renewed interesting the use of energy efficiency measure so mitigation assessment of greenhouse gases may also be attributed to the relationship between environmental pollutants, energy consumption and economic growth [6]. Studies have been done in this regard that in most studies related to this topic the patterns of tillage systems and use of chemical inputs have a special significance. In the most studies highest shear of input energy is involved to agricultural machinery. Farmers’ energy consumption also varies by tillage practice. Conservation tillage systems including reducing or no tillage are associated with lower fuel and input energy. In contrast, a conventional tillage system is associated with greater fuel and higher input energy. For this purpose assessment the impact of different tillage systems on energy and energy use efficiency in agroecosystems is essential problem. Therefore in this study we evaluated the impact of No tillage (NT) systems, Reduction tillage (RT) systems, and Conventional tillage (CT) systems on energy use and it efficiency in wheat agroecosystems in western of Iran.
Materials and Methods
Site description
The field experiments were conducted in cultivation years 2014 and 2015 in the research field in Campus of Agriculture and Natural Resources in Razi University (34° 21′ N latitude, 47° 9′ E longitude, and altitude 1319m above mean sea level), in Kermanshah province, western Iran. The soil texture at the experimental site was silt-clay with a pH of 7.6. Average seasonal rainfall during the experimental period (November-July) was above 440mm. Also the annual average of maximum and minimum temperature during experimental period was 32 °C and 20 °C, respectively.
Tillage systems
The tillage treatments were included conventional tillage (CT) system, reduced tillage (RT) system and no tillage (NT) system that explained below. No tillage system was including direct sowing without any tillage equipment. The RT system was consists of once chisel plow and seed drill in surface of field soil. The CT systems treatment was performed using a once moldboard plowing to 30-35cm depth, than once of chisel plow and with once of disk harrowing for crushing clods before planting by seed drill in fall. Use of other machinery such as combine and transporting machine were equal in all tillage systems.
Energy input and out pout and indices
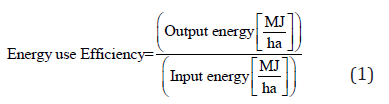
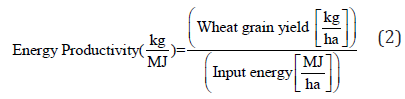
Total input and output energy was extracted in different tillage systems of wheat production systems and converted to energy equivalent. In each experimental treatment use of human labor (h), machinery (h), diesel fuel (L), water for irrigation (m3), electricity (Kwh), seed (kg) and chemical fertilizer (kg) as inputs and total biomass of wheat (involved grain yield, straw yield) as output were determined per hectare. The energy equivalents were calculated by multiplying the inputs and output quantities by their respective energy coefficients (Table 1). Energy indices were determined using data for energy input, grain yield and energy output. These indices were energy use efficiency as the ratio of energy output to energy input, energy productivity as grain yield divided by total energy used (kgMJ-1), net energy (MJha-1) and agrochemical energy ratio as the ratio of consumed energy for chemical input to total energy input (%). Energy indicators were calculated by applying Eqs 1-4 [7-9].
Table 1:Energy equivalents of input and output in wheat production systems.


Economic analysis
For economic analysis in wheat agroecosystems with NT, RT, and CT systems total costs, gross return, net return (gross return minus total cost), Profitability (cost to benefit ratio) and net energy value (total costs divided to total net energy) were calculated Eqs (5-7).
Net Return[USD/ha/year]=(Gross income)-(Totalcosts) (5)
Profitability ratio=(Net return)/(Totalcosts) (6)
Net energy value(MJ/ha)=(Net energy[MJ/ha])/(Total Costs [$/ha]) (7)
Results and Discussion
Input-output energy analysis in different tillage systems
Input and output energetic types in wheat agroecosystems by NT, RT, and CT systems and their energy equivalents are shown in (Table 2). Results showed that in NT systems were used 33h of human labour and 6.5h of machinery power per hectare of wheat agroecosystems. The amount of consumed diesel fuel per this equipment and operation was 85Lha-1. In RT systems was used of human labour, machinery power and consumed diesel fuel 38h, 9h, and 110L per hectare of wheat agroecosystems. In CT systems this amounts were 46h, 13h, and 150L per hectare respectively. Other input such as chemical fertilizer, manure, irrigation water, seed, and electricity power for water pumping in all three tillage systems were identical (Table 2). Accordingly, the total input energy in NT systems in wheat production was 31394.51MJha-1 in which the highest shares were recorded for electricity, N fertilizer, irrigated water and diesel fuel respectively (Figure 1).
Figure 1:The share of different source of input energy by NT system in wheat production.

Table 2:Consumed input and produced output by different tillage systems in wheat production.

Total energy input for RT systems in wheat production was 32844.31MJha-1 in which the highest shares were recorded for electricity, N fertilizer, diesel fuel, and irrigated water respectively (Figure 2). In wheat production by CT system consumed energy was 35163.99MJha-1 in which the highest shares were recorded for electricity, diesel fuel, N fertilizer, and irrigated water respectively (Figure 3). Accordingly amount of input energy in CT systems was more than RT and NT systems in wheat production. The shear of machinery and diesel fuel energy of input energy in NT, RT, and CT systems were 15, 19, and 24% respectively. In CT systems amount of machinery using and ultimately the use of fossil fuels are more than other tillage systems such as RT, and NT systems in wheat agroecosystems. Parallel with these results Sorensen et al. [10] reported that the total energy input was reduced by 26% for the reduced tillage system and by 41% for the no-tillage system ratio conventional tillage system.
Figure 2:The share of different source of input energy by RT system in wheat production.

Figure 3:The share of different source of input energy by CT system in wheat production.

Table 3:Input and output energy by difference tillage systems in wheat production.

Average grain yield in NT, RT, and CT systems in wheat production systems were 5180.4, 5157.79, and 5348.37kgha-1, respectively. In the other hand were produced 9919.2, 10548.91, and 9330.77 kgha-1 of straw in NT, RT, and CT systems in wheat production systems respectively. Total output energy (grain and straw yield) was calculated for all tillage systems (Table 2). Total out pout energy in NT, RT, and CT systems in wheat production systems were 200141.88, 207680.89, and 195255.66MJha-1 respectively. Summary, in this study the highest share of total input energy in all tillage systems was related to electricity energy that was used by electromotor for water pumping (Table 3). But also, CT systems in wheat production were very dependent to diesel fuel energy because of more tillage and other operation by machinery. Furthermore, CT systems used more than 2 times of fuel input they have not 2 times more energy output than other tillage systems including NT, and RT systems in wheat production per input energy in CT systems.
Energy indicators and forms in wheat production systems
Results of energy indicators for NT, RT, and CT systems in wheat production are shown in Table 4. Energy use efficiency was 6.38, 6.32, and 5.55 for NT, RT, and CT systems in wheat production, respectively. This amount was reported 2.8 for wheat production systems in Turkey [11], 2.9 to 5.2 for wheat in India [12], 4.83 for alfalfa production systems in Iran [13], and 2.67 in corn [9]. Yousefi et al. [2] reported that energy use efficiency in high input systems (3.03) was lower than of low input systems (3.94). Because energy use efficiency is affected by two items as output yield and consumption inputs. That it has direct relationship with increased the yield and it has an opposite relationship with increased of consumption inputs. Lower energy use efficiency in CT systems in wheat production is due to higher energy inputs such as diesel fuel in these systems compared by NT, and RT systems in wheat production. Efficient use of energy resources is vital in terms of increasing production, productivity, competitiveness of agriculture as well as sustainability of rural production systems [14]. In the other hands, energy productivity for NT, RT, and CT systems in wheat production was estimated 0.17, 0.16, and 0.15kg MJ-1. This is meaning that in NT, RT, and CT systems was produced 170, 160, and 150gr of wheat grain yield per consumed each MJ of input energy. In high input wheat production systems, energy productivity or grain yield per input energy unit was 0.11kgMJ-1, whereas this indicator was 0.14kgMJ-1 in low input wheat [2]. In other crops this amount recorded 1.53 for sugar beet [15], 0.26 for wheat in Turkey [16], and 0.09kgMJ-1 in sunflower agroecosystems [17]. For crops such as cereals which economic yield is a proportion of biologic yield, energy productivity is low, but this indicator seems to be higher in rooted crops and forage crops (cultivated to product forage) because of greater output [9]. High amount of energy productivity in NT systems compared to CT systems in wheat production is cased to more use of energy resource in CT system. The net energy per hectare for wheat production in NT, RT, and CT systems was about 168747, 174837, and 160092 MJha-1 respectively. Yousefi et al. [2] concluded that net energy in high input wheat production system (123,000MJha-1) was higher than low input wheat production system (42,000MJha-1) which is due to higher yields (grain and straw) in high input agroecosystems. This amount was observe in other crops 982,000MJha-1 for sugar beet [18], 9836.94MJha-1 for chickpea [19], and 190383.11 for alfalfa [13]. Agrochemical energy ratio of wheat production systems was another energy index that in NT, RT, and CT systems was calculated as 49, 41, and 44%, respectively, which illustrate more input energy per chemical fertilizers and pesticide for production. Higher ratio of agrochemical energy may imply higher carbon footprint [17]. Agrochemical energy ratio in low input agroecosystems as well as organic agroecosystems seems to be roughly near to zero, while in conventional intensive agroecosystems, due to dependence to agrochemical inputs, the share of this inputs is high percent of used energy [9] .
Table 4:Indicators of energy use by NT, RT, and CT systems in wheat production.

Economic analysis of wheat agro ecosystems under different tillage systems
Results of economic analysis of wheat agroecosystems whit NT, RT, and CT systems are shown in Table 5. The highest cost in wheat production with CT system was paid for diesel fuel and machinery operation (above 30% of total costs), while the highest cost in RT, and NT systems was paid for Fertilizer (Manure and Chemical) (above 20% of total costs). Profitability or benefit to cost ratio in wheat production with NT, RT, and CT systems was 3.23, 2.96, and 2.59 respectively. This indicates greater benefit per unit cost in wheat production with N tillage systems. Benefit to cost ratio was reported 1.10 for soybean, 1.98 for mustard, 2.03 for wheat and 2.30 for chickpea [20], 2.13 and 2.14 in organic and conventional apricot production systems [21]. Wheat production with NT and RT systems were more profitable ratio to CT systems [22-24]. As will NT system was 1.24 further beneficial than to CT systems. The main reason for this problem was the higher cost of tillage in these systems rather than NT systems [25,26].
Table 5:Economic analysis in wheat production by NT, RT, and CT systems.

In the last part of this research we calculated the cost of net energy or energy added value by different tillage systems in wheat agroecosystems. This ratio was calculated for NT, RT, and CT systems in wheat production as 0.004, 0.003, and 0.004USDMJ-1 which means higher cost per MJ of net energy in CT system ratio to other tillage systems. In the other words per expenditure any dollar of cost the amount of energy added value in NT, RT, and CT systems in wheat production was 364.50, 352.28, and 285.68MJ respectively.
Improving crop yield and decreasing production costs will cause increase in productivity of wheat agroecosystems. Therefore, it can be stated that in conservation tillage systems such as NT and RT systems the productivity is higher than other tillage systems such as CT system. Thus we can maintain crop production in a satisfactory level and sustainable with reducing the use of nonrenewable energy resource and optimized the energy consumption.
Conclusion
The present investigation was aimed at analyzing the energy consumption of wheat production by different tillage systems in western of Iran. The assessment was carried out in terms of energy used and produced, energy use efficiency, energy productivity, net energy and agrochemical energy ratio in wheat agroecosystems with NT, RT, and CT systems. It was disclosed that the higher amount of input energy was related to CT system in wheat production and lower amount was related to NT systems. The share of diesel fuel and machinery power of input energy in CT systems was more than other systems. Energy use efficiency and productivity in wheat agroecosystems with no tillage systems (6.38 and 0.17kgMJ-1) was more than conventional tillage systems (5.55 and 0.15kgMJ- 1). Therefore, amount of EUE of different tillage systems followed the order of NT>RT>CT systems. Finally, some economic indices in different tillage systems were incorporated in the present investigation such as net return, profitability and net energy value. The total net return in NT, RT, and CT systems was equal to 1496.77, 1468.34, and 1444.67$ha-1 was achieved for the surveyed region while the profitability of these tillage systems in wheat production was obtained to be 3.23, 2.96, and 2.59. This index was showed than wheat production with no tillage systems is eco-efficient. Calculated the net energy value showed that per compensated one dollar of cost amount of energy added value was 364.50, 352.28, and 285.68 in NT, RT, and CT systems in wheat production respectively. Consequently, can be improvement the sustainability and profitability of agroecosystems production with management approach such as optimized energy use, reducing production costs and use of renewable and conservation input and operation.
References
- Yousefi M, Khoramivafa M, Mondani F (2014a) Integrated evaluation of energy use, greenhouse gas emissions and global warming potential for sugar beet (Beta vulgaris) agroecosystems in Iran. Atmospheric Environment 92: 501-505.
- Yousefi M, Mahdavi Damghani A, Khoramivafa M (2016) Comparison greenhouse gas (GHG) emissions and global warming potential (GWP) effect of energy use in different wheat agroecosystems in Iran. Environ Sci Pollut Res 23(8): 7390-7397.
- Ozkan B, Akcaoz H, Fert C (2004) Energy input-output analysis in Turkish agriculture. Renew Energy 29(1): 39-51.
- IEA (2009) How the energy sector can deliver on acclimate agreement in Copenhagen-gen. International Energy Agency, France.
- IPCC (2007) Contribution of Working Group III to the Fourth Assessment Report. Intergovernmental Panel on Climate Change, Cambridge University Press, Cambridge, UK.
- Hamit HM (2012) Greenhouse gas emissions, energy consumption and economic growth: A panel counteractions analysis from Canadian industrial sector perspective. Energy Econ 34(1): 358-364.
- Khan S, Khan MA, Hanjra MA, Mu J (2009) Pathways to reduce the environmental footprints of water and energy input in food production. Food policy 34(2): 141-149.
- Pishgar KSH, Ghahderijani M, Sefeedpari P (2012) Energy consumption and CO2 emissions analysis of potato production based on different farm size levels in Iran. Journal of Cleaner Production 33: 183-191.
- Yousefi M, Mahdavi DA, Khoramivafa M (2014b) Energy consumption, greenhouse gas emissions and assessment of sustainability index in corn agroecosystems of Iran. Science of the Total Environment 493: 330-335.
- Sørensen CG, Halberg N, Oudshoorn W, Bjørn M, Dalgaard R (2014) Energy inputs and GHG emissions of tillage systems. Biosystems Engineering 120: 2-14.
- Canakci M, Topakci M, Akinci I, Ozmerzi A (2005) Energy use pattern of some field crops and vegetable production: case study for Antalya region, Turkey. Energy Conversion and Management 46(4): 655-666.
- Singh H, Singh AK, Kushwaha HL, Singh A (2007) Energy consumption pattern of wheat production in India. Energy 32(10): 1848-1854.
- Yousefi M, Mohammadi A (2011) Economic analysis and energy use efficiency in alfalfa production systems in Iran. Scientific Research and Essays 6(11): 2332-2336.
- Hatirli S, Ozkan B, Fert C (2006) Input energys crop yield relationship in greenhouse tomato production. Renewable Energy 31: 427-38.
- Erdal G, Esengun K, Erdal H, Gunduz O (2007) Energy use and economical analysis of sugar beet production in Tokat province of Turkey. Energy 32(1): 35-41.
- Adnan C, Altınta G, Erdal G (2009) Energy consumption patterns and economic analysis of irrigated wheat and rainfed wheat production: Case study for Tokat region. Turkey Journal of Food, Agriculture, Ecosystems and Environment 7: 639-644.
- Yousefi M, Khoramivafa M, Mahdavi DA (2017) Water footprint and carbon footprint of the energy consumption in sunflower agroecosystems. Environ Sci Pollut Res 24(24): 19827-19834.
- Yaldiz O, Ozturk HH, Zeren Y, Bascetincelik A (1993) Energy use in field crops of Turkey. 5th International Congress of Agricultural Machinery and Energy Kusadası Turkish.
- Yousefi M, Mahdavi Damghani AM (2012) Evaluation of energy flow and indicators of chickpea under rainfed condition in Iran. International Journal of Farming and Allied Sciences 1(2): 57-61.
- Mandal KG, Saha KP, Ghosh PK, Hati KM, Bandyopadhyay KK (2002) Bioenergy and economic analysis of soybean-based crop production systems in central India. Biomass and Bioenergy 23(5): 337-345.
- Gundogmus E (2006) Energy use on organic farming: A comparative analysis on organic versus conventional apricot production on small holdings in Turkey. Energy Conversion and Management 47(18-19): 3351-3359.
- Esengun K, Gunduz O, Erdal G (2007) Input-output energy analysis in dry apricot production of Turkey. Energy Conversations and Management 48(2): 592-598.
- Ghiyasi M, Pouryousef M, Myandoab M, Tajbakhsh A, Hasanzade Gorttape M, et al. (2008) The evaluation of energy balance of wheat under low input farming in West Azerbaijan. Research Journal of Biological Sciences 12(3): 1408-1410
- Mohammadi A, Omid M (2010) Economical analysis and relation between input energys and yield of greenhouse cucumber production in Iran. Applied Energy 87: 191-196.
- Rafiee S, Mousavi ASH, Mohammadi A (2010) Modeling and sensitivity analysis of energy inputs for apple production in Iran. Energy 35(8): 3301-3306.
- Samavatean N, Rafiee S, Mobil H, Mohammadi A (2010) An analysis of energy use and relation between energy inputs and yield, costs and income of garlic production in Iran. Renewable Energy 36(6): 1808- 1813.
© 2019 Khoramivafa M. This is an open access article distributed under the terms of the Creative Commons Attribution License , which permits unrestricted use, distribution, and build upon your work non-commercially.
Editor In Chief


.jpg)


Signup for Newsletter

Quick Links
 Editorial Board Registrations
 Submit your Article
 Refer a Friend
 Advertise With Us
Our Recent Edition

.jpg)


Top Editors


.jpg)


.bmp)
.jpg)
.png)
.jpg)


.jpg)


.png)

.png)


.png)


Financial Support

Sponsors

Latest e-Books

Latest Video

 a Creative Commons Attribution 4.0 International License. Based on a work at www.crimsonpublishers.com.
Best viewed in
a Creative Commons Attribution 4.0 International License. Based on a work at www.crimsonpublishers.com.
Best viewed in