- Submissions

Full Text
Modern Approaches in Drug Designing
Designing of Coenzyme Q10 Loaded Nano emulsion Using Qbd Approach for its Improved Oral Bioavailability and Efficacy
Goldie Moon, Iram Khan, Rao NJ, Alex Thomson, Jayamanti Pandit and Yasmin Sultana*
Department of Pharmaceutics, School of Pharmaceutical Education and Research, Jamia Hamdard, India
*Corresponding author: Yasmin Sultana, Department of Pharmaceutics, School of Pharmaceutical Education and Research, Jamia Hamdard, India
Submission: June 20, 2022;Published: October 12, 2022
ISSN: 2576-9170 Volume4 Issue1
Abstract
In the present study, an attempt was made to develop a nano emulsion formulation containing coenzyme Q10 (CoQ10NE) for solubility enhancement. A three-factor three-level Box Behnken design was chosen as Quality by design (QbD) approach to get optimized nano emulsion formulation. Nano emulsion was prepared by blending with high-energy ultrasonication method using Soyabean oil, and Soya lecithin as oil phase, and tween 20 as surfactant. Oil, surfactant, and sonication time was considered as loose independent variables. The optimized independent variables were lipid concentration (12.5%), surfactant concentration (1%), and sonication time (3min). The characteristics of the prepared formulation were found to be very close to the generated formula in terms of particle size (80.9nm), poly-dispersibility index (PDI) (0.198), furthermore, CoQ10NE showed characteristic scanning electron microscope and transmission electron microscopy images which depicts smooth and spherical surface of the CoQ10NE droplets and were in accordance with particle size determination. The particle size, PDI, peak melting temperature, and enthalpy (Delta H) of optimized formulation was found to be 80.9mm, 0.192, 49.858 °C, and 16.041(J/g) respectively. Confocal Laser Scanning Microscopy (CLSM) study indicated that the absorption of F2 (Rhodamine loaded nano emulsion) from the rat intestinal tissue was considerably higher than that of control (F1, Rhodamine solution). Pharmacokinetic profile of optimized CoQ10NE formulation was found to be AUC0-48 (mg.h/ml) 237.63, AUC0-α (mg.h/ml) 261.40, Cmax (mg/ml) 76.98, TMax 4 hours, K (hr-1) 0.231. The lipid peroxides were measured in the terms of malonaldehyde formed in the assay. It was observed that coenzyme Q10 nano emulsion significantly reduced the levels of malonaldehyde when compared to pure drug suspension administration. Further the histopathological evaluation showed that animal group treated with CoQ10NE formulation completely reversed to normal cellular anatomy as compared to the drug suspension group which showed only mild restoration. Thus, the designed coenzyme Q10 loaded nano emulsion showed enhanced antioxidant properties of coenzyme Q10.
Keywords: Coenzyme Q10; Nano emulsion; Bioavailability; Antioxidant; Box behnken design
Introduction
Coenzyme Q10 (CoQ10) (2,3 dimethoxy-5 methyl-6 decaprenyl benzoquinone) is a lipophilic, endogenous essential respiratory chain molecule found in eukaryotic cell. It can be synthesized in the body and for certain cases, the daily intake of CoQ10 through food is around 3-5mg [1]. CoQ10 is an antioxidant which ensures that all cells within the body have optimal growth but its production decreases with ageing [2,3]. It is a fat-soluble, vitamin-like quinine moiety that is commonly known as ubiquinone [4]. The largest concentrations of CoQ10 are found in organs with high metabolic rates, such as the heart, kidney, and liver, where it serves as an energy transfer molecule [5,6]. The four redox states of CoQ10 are reduced (ubiquinol), fully oxidized (ubiquinone), semiquinone (ubisemiquinone) and completely reduced (ubiquinol). It plays an essential part in the electron transport chain and as a radical-destructing antioxidant due to its ability to carry two electrons (moving between quinone and quinol type) (move between semiquinone and one such other form) [7- 9]. CoQ10 has shown therapeutic benefits in neurodegenerative diseases such as Friedreich’s ataxia, Huntington, Parkinson and Alzheimer disease [10]. Other pathological conditions such as periodontitis, migraine and asthenozoospermia can be treated with CoQ10 [11-13]. CoQ10 is listed as a Class II drug according to biopharmaceutical classification system [14,15]. Its high hydrophobic nature has lead to poor bioavailability and delivery [16]. Due to its low water solubility [17], the particle size reduction technique is not useful and leading to poor wettability and inability to formulate aqueous solution [18]. Its low bioavailability after oral administration is the main limitation of CoQ10 [Pravst I 2020]. Using nano technology, the solubility and bioavailability of CoQ10 can be enhanced by formulating it into nanoparticles, liposomes, solid dispersion, nanostructured lipid carriers, nano capsules, c-cyclodextrin and self-emulating drug delivery systems [19,20]. Most of the techniques referred to above are adoption of lipidbased supplies, increasing lipophilic absorption and bioavailability of the drug [21,22].
Nano emulsions are transparent and thermodynamically stable systems with nanosized droplets in the range of 1-100nm [23], Nano emulsion has been proved to be an effective carrier for improving the oral bioavailability of drugs through different absorption mechanism by the improvement of aqueous solubility and stability [24,25]. These have shown better oral bioavailability in rats and healthy human volunteers [26,27]. Nano emulsion protects the drug by encapsulating effect and prevents the recognition of P-glycoprotein. The drugs can be easily absorbed into the cell without being released out, which results in enhanced bioavailability of the drug when given orally [28]. Meat, fish, nuts, and certain oils are the highest dietary sources of CoQ10, with 10 to 50mg/kg. After fish oil and multivitamins, CoQ10 is the third most popular nutritional supplement in America. Deficiency can be caused by physio pathologic circumstances including acquired or inherited changes in metabolism or biosynthesis, as well as an insufficient intake of CoQ10 or its dietary precursors [29]. It was observed that Co Q10 nano emulsion showed significant reduction in the levels of malonaldehyde when compared to pure drug suspension resulting enhancement of antioxidant properties Histopathology examination of the control group showed typical tissue structure with well-arranged cardiac muscle cells and welldefined intercalated discs, well-preserved cytoplasm, noticeable nucleus and visible central veins. While the sections of doxorubicin intoxicated animals showed remarkable changes due to oxidative stress like tissue scarring, tissue degeneration, broad infiltration of cells and loss of cell boundaries. Treated animals with CoQ10 NE formulation completely reversed to normal cellular anatomy as compared to drug suspension group which showed only mild restoration.
Material and Methods
Materials
CoQ10 was obtained from Shilex Chemicals, Delhi, India. Oleic acid, castor oil and olive oil were received from SD fine chemicals, Mumbai. Coconut oil, soyabean oil, clove oil was received as a gift sample from Triveni chemicals, Gujrat, India. Tween 20 and span 20 were obtained from Merck India Ltd. All other chemicals were of analytical grade.
Methods
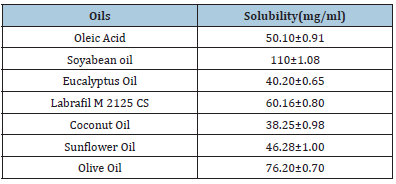
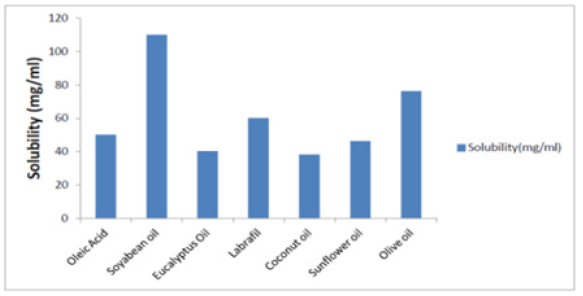
Screening and selection of oils: Oils showing maximum solubility were selected for nano emulsion preparation. Solubility of the drug in oil was determined by taking 1ml oil in 2ml eppendorf tube. To it, the excess drug was added and was left on the biological shaker for 48 hours. This was then centrifuged at 5000 rpm for 15min, the supernatant was taken and dissolved in hexane and quantified by UV spectrophotometer at 275 nm. The amount of drug dissolved in other excipients was determined from the calibration curve of CoQ10 in hexane. Surfactants were selected by storing the placebo Nano emulsion prepared with different surfactants and assessing their particle size. Stability of prepared Nano emulsion was assessed based on phase separation [30]. It is very essential to determine the solubility of the drug in oil phase before going for the formulation of nano emulsion because saturation solubility of the drug in the oil determines the quality of nano emulsion [31]. The result of solubility studies of CoQ10 in different oils are showed in Table 1 and depicted in Fig. 1 suggesting that CoQ10 is having maximum solubility in soyabean oil and was opted as lipid phase for the nano emulsion and Tween 20 was preferred as surfactant considering stability based on dispersibility and no phase separation.
Preparation of Coenzyme Q10 Containing Nano emulsion
The formulations of CoQ10-NANOEMULSION, listed in Table 1, were prepared by blending method combined with ultrasonication technique. Briefly, appropriate amounts of CoQ10, Soyabean oil, and Soya lecithin were blended and melted at 50 °C to form a clear and uniform oil phase. Meanwhile, the aqueous phase consisting of surfactant Tween 20 was dissolved in double-distilled water and was added dropwise to the oil phase at the same temperature with the help of agitation at 600rpm for 10min [32]. The coarse emulsion was then treated by a probe-sonicator (Hielscher, UP- 50H, Germany) for 3min. Afterwards, the dispersion was cooled to form nano emulsion at room temperature and then finally stored.
Table 1: Solubility of drug in different oils.
Data analysis by design expert software
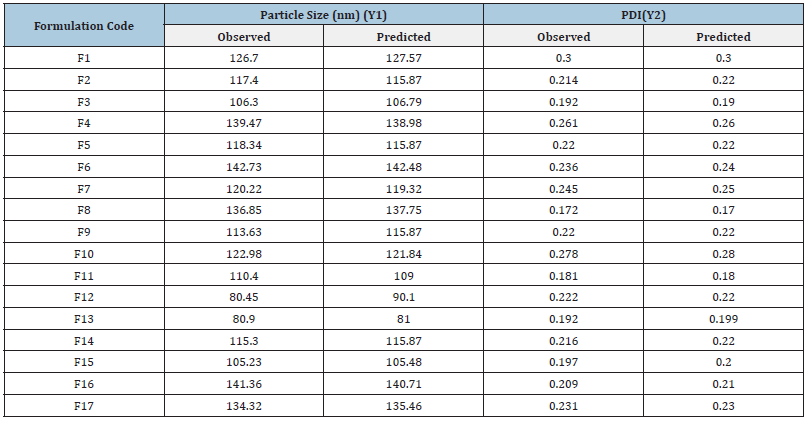
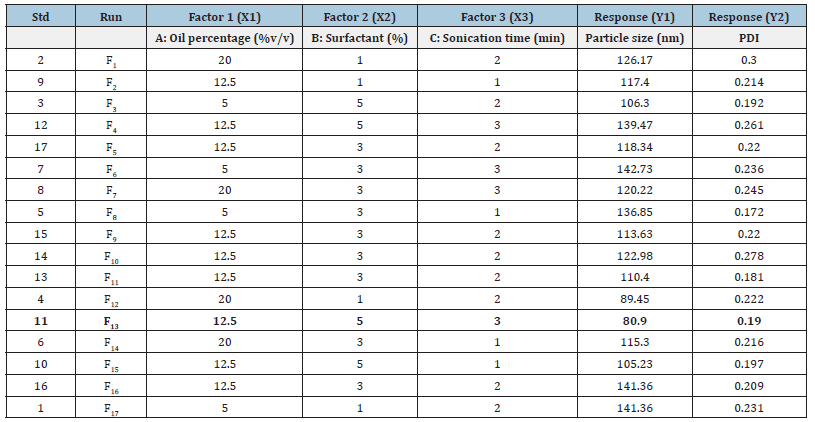
The independent variables selected had a significant influence on the responses observed with Y1 (80.45 to 142.73nm) and Y2 (0.172 to 0.300) as shown in Table 2. Based on the estimation of holistic parameters and checks for sequential p-values, lack of fitness and difference between adjusted and anticipated R2 values, mathematical fitness of Y1, Y2 and polynomial equation revolving around the main effect and interaction factors were determined. Table 3 lists the values observed and predictions obtained for all responses. Data showed that all responses were in line with the quadratic model and each response was calculated using ANOVA for individual p-values of every term. Furthermore, in the same equations, the intercept and coefficients for each duration of the quadratic equation produced by software indicate the decreasing or increasing effect on the response due to that factor before the coefficients of each factor [33].
Table 2: Variables in Box-Behnken design for preparation of Coenzyme Q10 loaded nano emulsion.

Table 3: Observed and predicted particle size values (Y1) and poly dispersion index (Y2) values for Box-Behnken design formulations.
In the surface analysis for each response, the effect of independent variables such as lipid content, surfactant concentration and sonic time for the response of the dependent variables (i.e., particle size and poly dispersion are illustrated in Figure 1) are shown in tridimensional model graphs and contour plots. The interaction effects of the 2 independent variables on dependent variables were examined in these 3D response surface plots and contour plots while the third factor was kept as a constant [34,35]. These plots can easily study the qualitative impacts of each variable.
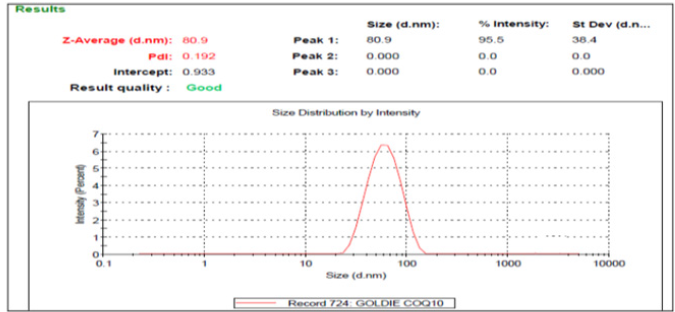
Figure 1: Representative graphs for particle size and PDI.
Effects of independent variables on particle size (Y1):The particle size varies between 80.45nm and 142.73nm for
NANOEMULSION-F12 to NANOEMULSION-F6 as per the result
shown in Table 3. All three independent variables influenced the
particle size. The following equation provides the mathematical
relation between independent variables and particle size [36].
Particle size (Y1) = +115.87+17.29 X1-1.20 X2-8.01 X3-0.55
X1X2+1.44 X1X3-0.058 X2X3-2.09 X12+9.65 X22+3.07 X32
The main effects of X1, X2 and X3 show the average result of one variable changing from low to high. The highly significant factor for particle size was the level of lipid (X1; p<0.0001, F values 677.25), and the concentration of surfactant, the sonication time was lower than the concentration of lipid (X2; p=0.1133, F-values 3.27 and X3; p<0.0001, F-value 145.43). From the above equation, it was clear that lipid levels have an increasing effect while surfactant and sonicative times decrease the particle size initially, but the overall effect on the particle size decreased due to sonicative time and surfactant concentration. The X1X2, X1X3, X2x3, X12, X22, and X32 interaction terms interlinked the change of particle size with simultaneous changes in the two variables.. In 3D response surface plots and contour plots as depicted in Figure 2, highlights that the effects of the interaction term on particle size can be easily studied. When the above data was applied to Box Behnken 17 formulation in terms of coded factors was achieved as given in the Table 4. Surface response plots were generated to visualize the simultaneous effect on each response parameter of every variable.
Figure 2: 3D response surface plots and contour plots showing the effect of different variables on polydispersity index.
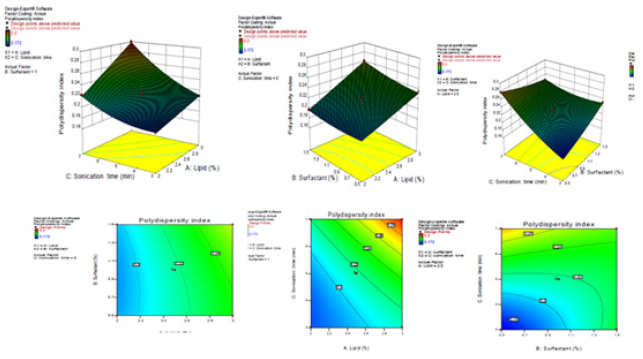
Table 4: Observed responses in Box-Behnken design for nano emulsion of coenzyme Q10.
Evaluation of nano emulsions
Particle size and polydispersity index: Photon Correlation Spectroscopy (PCS) was used in the determination of nano emulsion particle size and poly dispersion index. The particle size and PDI are determined by Zetasizer Nano-ZS (Malvern instruments UK) after suitable dilution with double distillation water.
Lyophilization of optimized nano emulsion:Lyophilization ensures chemical and physical stability by preventing the Ostwald’s ripening and hydrolysis reactions. During the freezing drying process, cryoprotectant mannitol was used to reduce the nano emulsion aggregation from stress. Before freezing, nano emulsion was added to the cryoprotectant. At -4 ˚C for 24 hours before lyophilization, the samples had been lyophilized by freezing the samples using a freeze dryer (Heto Dry Winner) for 24 hours. Mannitol (3%, w/v) was found to be an optimal cryoprotectant for lyophilization as it helps to attain a free-flowing dry powder of nano emulsion dispersion. For DSC, FT-IR, TEM, and SEM analyses, lyophilized samples were subjected.
Differential Scanning Calorimetry (DSC):In the present study, differential scanning calorimetry (DSC 6, Perkinelmer, USA) is used to obtain the thermal property of the lyophilized nano emulsion. Empty standard aluminium pans were used as references. Temperature scan programmed as following: sample and reference are held at 30 ºC for 1min and then heated to 200 ºC at 10 ºC/min After reaching 200 ºC they are held at 200 ºC for 1min. The Pyris (Perkinelmer, USA) software is used to analyse the data acquired during the scan. CoQ10 loaded nano emulsions are studied. Processed thermograms are obtained to study the thermal behaviour of different particles with different components. The onset temperature is measured since it is not significantly affected by cooling or heating gradient.
Morphology study of nano emulsion (Transmission Electron Microscopy (TEM) & Scanning Electron Microscopy (SEM)):Microscopy on the surface of nano emulsion Transmission Electron (TEM) was performed by Tecnai T12, Japan. After appropriate dilution of prepared nano emulsion, a drop of was negatively stained by uranyl acetate deposing over copper grid coated with the carbon film, dried and then observed by TEM for observing the morphology of nano emulsion. Scanning Electron Microscopy (SEM), by model Zeiss EVO 50 VP (Carl Zeiss Germany), also determined the surface morphology of the lyophilized CoQ10, and loaded nano emulsion. The samples were mounted on a circular brass stub to perform the SEM study. Gold-palladium alloy was covered in an argon atmosphere with a sputter coating device. The sputtering took almost 2 minutes to get a consistent sample coverage that enabled good quality SEM pictures when seen with the electron’s scan microscope at different resolution [37].
In-vitro drug release studies
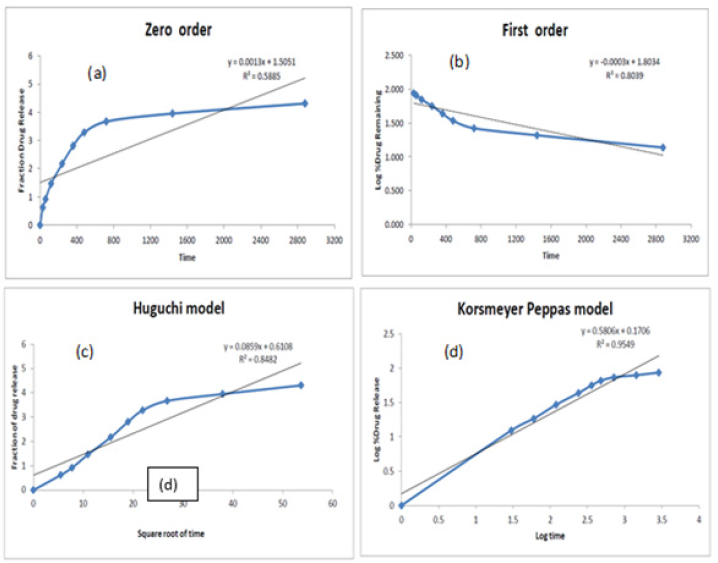
The dialysis bag diffusion technology with minor modifications evaluated the in-vitro release of the drug from nano emulsion. The release studies of nano emulsion CoQ10 were performed with acetone as a co-solvent in a phosphate buffer (pH 6.8). The 2ml aqueous nano emulsion dispersion was placed in a pre-activated dialysis bag, MW 12000-14000 Da, (Hi Media, Mumbai) which was sealed at both ends. The dissolution vessel, which contained about 200 ml of dissolution medium (containing 10 % acetone to maintain the sink), was stirred at 100 rpm and maintained at 37±2 ˚C. To prevent evaporation of the dissolving medium, the receptor compartment was covered. A predetermined 2ml sample aliquot was removed by a fresh dissolution medium at an interval of 0.5,0.1,0, 2.0, 4.0, 6.0, 8.0, 12.0, 24.0, and 48.0 hours. The samples were diluted with acetone and filtered with a filter membrane of 0.22 microns, using UV set at 275 nm the samples were analysed. All tests have been repeated three times and average values were recorded. In-vitro release analysis was adapted to a range of models, including zero order, first order, Higuchi, and Kors Meyer Peppas. As a best-fit model for drug release, the model giving R2 values nearer to 1 was chosen.

Confocal Laser Scanning Microscopy (CLSM)
The absorption enhancement of optimized formulation in the small intestine was studied via Confocal Laser Microscopy (CLSM). The study was performed in a rat model (Albino Wistar 200-250gm). Two formulations were prepared F1 and F2 for conducting tissue uptake studies. F1 was prepared by dissolving a small quantity of rhodamine B in water, which served as a control formulation whereas F2 was formulated similarly as nano emulsion except with the incorporation of rhodamine B dye. A rat was sacrificed and nearly 5cm intestine section was incised and cleaned for producing the closed-loop, the proximal end of each intestinal section was tied up before introducing F1 and F2 formulation (0.5ml) via a syringe and the distal end was then ligated to form a closed-loop. This closed loop was tied via clamp stand in a beaker containing 100ml of physiological solution (Krebs solution) and stirred at 50 rpm for 6 hours at 37 ˚C with adequate aeration. The intestine was cut in such a way that the lumen was visualized under CLSM.
Pharmacokinetic study
The pharmacokinetic study was carried out to assess the bioavailability of the developed optimized nano emulsion of CoQ10 with its marketed capsule formulation. The animals utilized for the in-vivo study (Adult wistar rat of either sex) were obtained after approval (Project approval no: 1323) from Central Animal House of Jamia Hamdard University, New Delhi, India which is an institutional ethics committee and their guidelines were followed throughout the course of in-vivo studies. For the study adult female wistar rat (200-250g) were taken as the animal model. Animals were maintained at a temperature of 25 ºC±2 ˚C and relative humidity of 55±5%, under standard laboratory conditions. The livestock had access to food and water freely in polypropylene cages. The animals were divided into three categories i.e., 1st group was kept as control, the 2nd group was given optimized nano emulsion of CoQ10 and the third group was given marketed CoQ10 capsules. The formulation that showed the highest drug release during invitro studies was selected for in-vivo studies. The animal dose was calculated based on the body surface ratio of rats to that of human beings. For the present study 10mg/kg of CoQ10 was fed to each rat of the optimized formulation group and Marketed drug group. The control group was kept on a normal saline solution.
Pharmacodynamic study
The pharmacodynamic study of antioxidant effect of the drug was performed biochemically using the Lipid peroxidation test and histopathological examination of cardiac tissue.
Treatment plan for pharmacodynamic study:The rats were randomly divided into 4 groups and dosing was conducted as per the treatment schedule presented in Table 5.
Table 5: Dosage regimen for pharmacodynamic study.

Determination of antioxidant enzyme levels (Lipid Peroxidation (LPO)):The cervical dislocation was done to sacrifice animals and the heart was isolated quickly. They have been washed with saline, blotted dry on filter paper and weighed. In icecold KCl (1.15%, pH7.4) homo genisation was conducted to yield 10%(w/v) homogenous tissue and to test the lipid peroxidation. The underlying principle of this test is the formation of the product of LPO, Malonaldehyde (MDA), which reacts with Thoi Barbituric Acid (TBA) to form a pink chromogen TBA reactive product. The standard used was 1,1,3,3-tetraethoxypropan for the calibration curve and expressed as mole/mg protein. Homogenizing the icecold by 0.9% KCl of isolated mitochondrial fraction with the heart tissue produced 10% homogenates, followed by centrifugation by 800 to 10 minutes. The supernatant obtained was re-centrifuged to the mitochondrial fraction at 12000 rpm for 15 minutes. Approximately 0.2ml of that fraction was added with 1.5ml with a 20% acetic acid solution (pH 3.5) and 1.5ml of a 0.8% TBA vial to 8.1% (w/v) sodium-dodecyl sulphate solution. At last, the volume with distilled water was adjusted to 4ml and each bottle was heated and cooled for 60 minutes. 10% TBA was added and centrifuged at 1000rpm for each vial containing blank and test samples. Instead of TBA, the control group consisted of distilled water. Absorption was taken at a 532nm UV-visible spectrophotometer (Shimazu, Japan), and concentration was expressed in the mol MDA/g of heart tissue.
Histopathological examination:On the last day of our study, tissue samples of the heart were excised. They were washed with phosphate buffer, tamped dried with tissue paper and placed in 10% formalin immediately [38]. It was then embedded in paraffin and microtome sections (4μm) and were stained with hematoxylin and eosin after which they were examined under a microscope at 400x (Motic, Japan).
Result and Discussion
Excipients screening
It is essential to determine the solubility of the drug in oil before going for the formulation of nano emulsion because saturation solubility of the drug in the oil determines the quality of nano emulsion. The result of solubility studies of CoQ10 in different oils are showed in Table 1 and given in Figure 3 which depicts Q10 having maximum solubility in soyabean oil. Based on maximum solubility soyabean oil was selected as lipid phase for the nano emulsion. Tween 20 surfactants were selected based on the stability of prepared nano emulsions with various surfactants, such as ease of redispersibility, no phase separation. Thus, soyabean oil was preferred for formulation due to higher solubility of the drug. The size and surface morphology of nano emulsions are considerably influenced by oil content. It has been reported that as oil content increases up to 30%w/v, the particles are expected to show a pronounced smaller size and more regular morphology in a spherical shape with a smooth surface.
Figure 3: Solubility of coenzyme Q10 in different oils (mg/ml).
Selection of optimized formulations/b>
As per the results of Design Expert software three formulations (F2, F5, F9, F13, F14) were selected out of seventeen formulations based on comparatively smaller particle size and PDI. The primary emphasis was given to the particle size range between 80-125nm. It was interesting to note that all these formulations were the centre point of the Box-Behnken model (i.e middle values of all variables) with the composition of 12.5%w/v lipid mixture, 1%w/v surfactant and 3 minutes sonication time. Among all these formulations, formulation F13 was selected for further characterization and evaluation in the present study, based on its fit to the desired properties (mainly particle size and PDI) and their observed values were closed to the predicted values provided (Table 4) by Box- Behnken design shown [39].
Evaluation of nano emulsions
Particle size and Polydispersity index: The optimised formulation F13 had a particle size and PDI of 80.9nm and 0.192, respectively, as shown in Figure 1. In the dynamic light dispersion technique used to measure the nanoparticle size, the intensity of dispersed light, caused by the movement of particles in the nano emulsion, is fluctuating. This technique covers a range of sizes from several nm to approximately 3μm [40]. One of the most important parameters for determining nano emulsion stability is particle size distribution Table 6. The PDI indicator indicates the uniformity of the formulation size distribution. As the highest homogeneity is shown, the low PDI value is considered the optimal value (Figure 4).
Table 6:Fit summary for Polydispersity index.

Figure 4: (a) DSC thermogram of pure Coenzyme Q10 and 4 (b) DSC thermogram of Lyophilized nano emulsion.
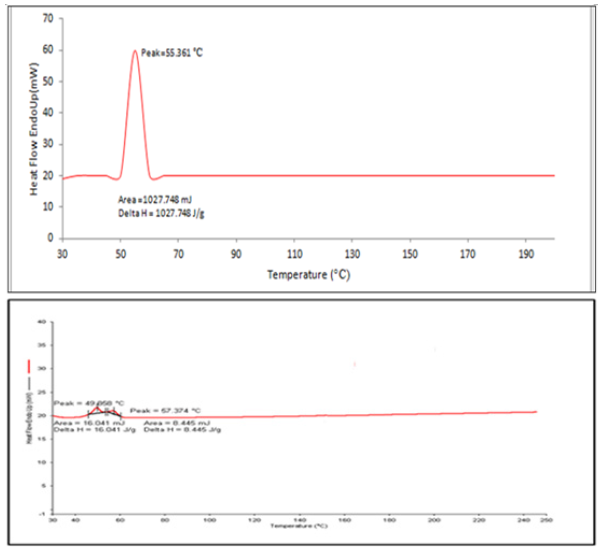
Differential Scanning Calorimetry (DSC):DSC is a tool for investigating crystalline material’s melting and re-crystallization behaviour. DSC thermogram of the pure drug CoQ10, and optimized nano emulsion formulation was shown in Figure 5. The corresponding melting temperature, area, and enthalpy (Delta H) were reported in Table 7. Nano emulsion formulation was amorphous thus the melting temperature was depressed no matter whether the drug was free or not and no sharp peaks were observed. The small effect and the Thomson equation can be explained by the decrease of the starting point and maximum temperature [41].
Figure 5: (a) represents TEM and 5 (b) SEM represents optimized formulation of nano emulsions.
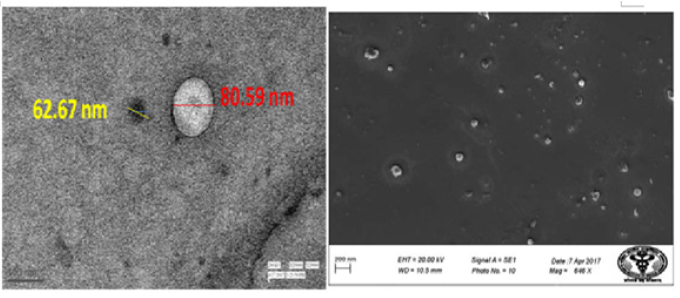
Table 7:Peak Melting temperature and enthalpy (Delta H).

Morphology study of Nano emulsion (Transmission Electron Microscopy (TEM) & Scanning Electron Microscopy (SEM)):TEM image of nano emulsion revealed particle of spherical shape and globule-like structure with uniform particle size distribution and as shown in Figure 5(a). In this field of micrograph, the diameter of droplets was found to be in the range of 52.67nm to 91.99nm with two particles of 62.67nm and 80.59nm size. The average particle size of this field is 83.34nm. This result of uniform particle size distribution was in accordance with the particle size and small PDI as obtained by Photon correlation microscopy. The SEM images of optimized nano emulsion samples Figure 5(b) clearly showed the presence of nanodroplets that were spherical. It also shows the size of the nano emulsion was in the range that was obtained with a zeta sizer, which indicated that the nano emulsion prepared in this study were mono-disperse.
In-Vitro drug release studies of coenzyme Q10
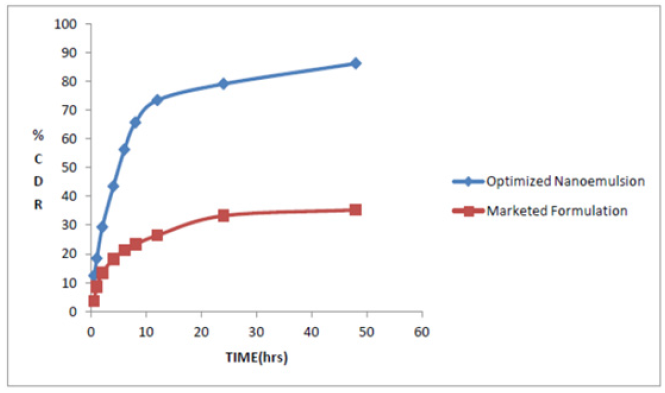
In vitro release studies of nano emulsion were carried out for 48 hours and graphically represented as Cumulative Percentage drug released v/s time profile. The % Cumulative drug release after 48 hours for optimized nano emulsion formulation of coenzyme Q10 was found to be 86.21% in phosphate buffer pH 6.8 with tween 20 as surfactant and from marketed formulation i.e., coenzyme Q10 capsule it was only 35.28%. The nature of the lipid and its concentration can affect the release of the drug from nano emulsion. As the concentration of surfactants was optimised by 10%, other parameters like the lipid nature, lipid solubility, partition coefficient and particle size affected the drug release profile. The diagram Figure 6 shows that nano emulsion release of drugs was biphasic with burst release followed by continuous release.
Figure 6:Comparative in vitro release profile of optimized formulation (nano emulsion) and coenzyme Q10 capsule in Phosphate buffer pH 6.8 with tween 20 as surfactant.
In vitro drug release kinetics: The kinetic in vitro release study has been determined by the integration in the standardized release equation, i.e., zero order, first order, Higuchi and korsmeyer pepass data from in vitro releases studies. Based on the coefficient of correlation value of different models, the model best suited to the release data was selected (Figure 7 and Table 8). The result illustrates that the release of drug from nano emulsion of CoQ10 follows Korsmeyer peppas kinetics as indicated by higher R2 values of 0.954. When the release data was analysed using the Korsmeyer Peppas equation, the value of release exponent n was found to be less than 0.5 which indicates that the mechanism of drug release from nano emulsion was by fickian diffusion.
Table 8:Coefficient of correlation for optimized nano emulsion formulation.

Figure 7:In vitro release kinetics of nano emulsion by (a) zero order (b) first order (c) Higuchi and (d) korsmeyer peppas.
Confocal Laser Scanning Microscopy (CLSM)
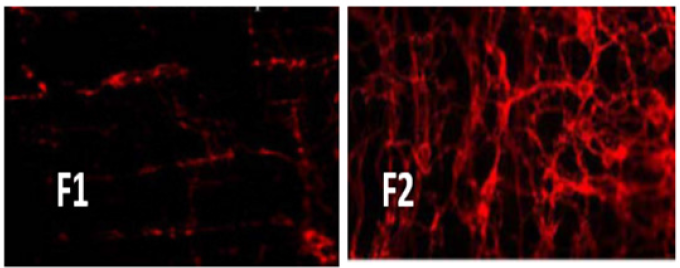
The result of Confocal Laser Microscopy (CLSM) studies which was conducted and indicates that the absorption of F2 (Rhodamine loaded nano emulsion) from the rat intestinal tissue was considerably higher than that of control (F1). The composition of F2 was same as that of the optimized formulation except rhodamine B was incorporated in place of the drug. The results suggested that F2 formulation was efficiently absorbed in the intestinal segment indicating the enhanced uptake of optimized nano emulsion by incorporation of excipients as showed in Figure 8(a) & 8(b).
Figure 8:Confocal image of (a) control (F1) and of (b) nano emulsion formulation (F2).
Pharmacokinetic study
The optimized formulation and API suspension of CoQ10 were orally administered to albino wistar rats (200-250gm) for conducting oral bioavailability studies. The plasma concentration of CoQ10 after oral administration of optimized formulation (nano emulsion) and API suspension are reported in Table 9 respectively. Comparative observation for in vivo bioavailability studies shows that there is a significant increase in the plasma concentration of nano emulsion as compared to API suspension depicted in the plasma concentration-time curve in Figure 9 and Table 10 portrays the pharmacokinetic parameters (Cmax, Tmax and AUC0-12) after oral administration of formulations. Cmax of optimized formulation was 2.14 times higher than the corresponding API suspension. The relative bioavailability of optimized formulation (nano emulsion) was 4.03 times that of API suspension. Statistically, the difference in Cmax of nano emulsion formulation was highly significant (p<0.001) when compared with the API suspension. In addition, AUC0-48 of nano emulsion formulation was 237.63mg.h/ml which is very significant (p<0.001) in contrast to the AUC0-48 of API suspension (64.81mg.h/ml). These results showed incorporation of Coenzyme Q10 into nano emulsion related to its enhanced absorption after oral administration [42]. The corresponding plasma concentration was calculated from the regression equation of calibration curve of CoQ10 in rat plasma i.e., Y= 171.51X+456.22 where y is the peak area and x is the plasma concentration. The main impediment in the efficient absorption of CoQ10 is its poor water solubility that prevents the drug to cross the unstirred water layer of the enterocytes lining of small intestine and even the drug is also susceptible to enzyme degradation in the gut wall. Thus, nano emulsion formulation enables lipophilic drug such as CoQ10 to successfully address such obstacles and thereby improving their in vivo performance. Another important factor of nano emulsion formulation that contributes to its improved oral bioavailability of CoQ10 is the small particle size of the nano emulsion formulation, such smaller size lipid nanoparticles could have efficient gastrointestinal tissue uptake. The in vivo procedure of Co Q10 is also increased by the high dispersibility of nano emulsion in the intestinal environment. In addition, nano emulsion could efficiently adhere to the intestinal wall, thereby extending its residence time and therefore its absorption. Importantly, the enhancement in bioavailability of CoQ10 is also attributed to the incorporation of excipients/surfactants like tween 20, because of which nano emulsion can minimize the drug efflux. Besides the above benefit, another important advantage of nano emulsion is to protect the fluid in the formulation against chemical and enzyme degradation and therefore to delay its in-vivo metabolism. To conclude, these are the possible mechanism for the enhanced absorption of CoQ10 loaded nano emulsion from the intestine.
Table 9:Drug plasma concentration after oral administration of optimized formulation and API suspension.
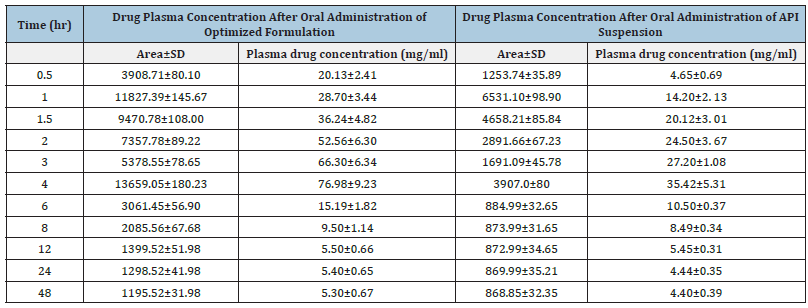
Figure 9:Comparative coenzyme Q10 concentration in plasma after oral administration in rats.
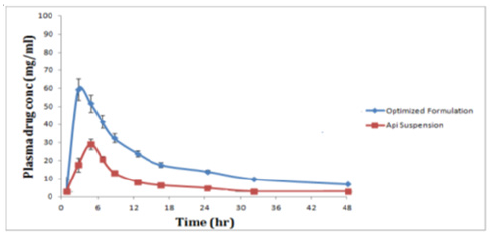
Table 10:Relative pharmacokinetic parameters of different formulations.

Pharmacodynamic study
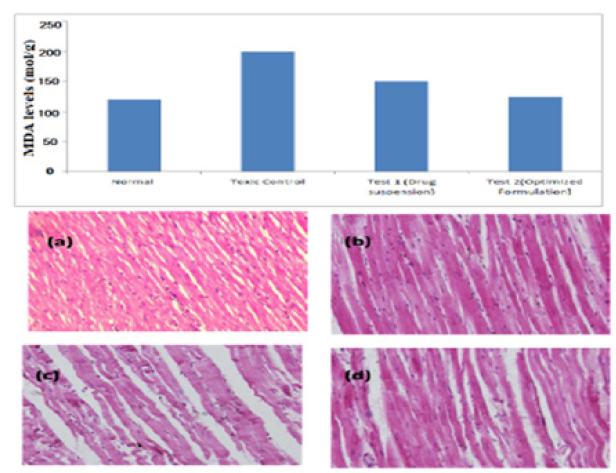
Determination of antioxidant enzyme levels by lipid peroxidation (LPO):The lipid peroxides were measured in the terms of malonaldehyde formed in the assay. It was observed that coenzyme Q10 nano emulsion significantly reduced the levels of malonaldehyde when compared to pure drug suspension administration. Thus, showing enhanced antioxidant properties than drug suspension. The relative levels of MDA (product of lipid peroxidation) after various treatments are presented in Figure 10(a).
Histopathological examination:Histopathology of the normal control group showed typical tissue structure with arranged cardiac muscle cells and well-defined intercalated discs, well-preserved cytoplasm, noticeable nucleus and visible central veins. While the sections of doxorubicin intoxicated animals showed remarkable changes due to oxidative stress such as tissue scarring, tissue degeneration, broad infiltration of cells and loss of cell boundaries (Figure 10(b)). Treated animals with CoQ10 nano emulsion completely reversed to normal cellular anatomy as compared to the drug suspension group which showed only mild restoration.
Figure 10:(a) Relative levels of malonaldehyde after the study period and (b) represents histology slides of heart tissue of A) Normal control B) nano emulsion treated C) Toxic control D) Drug suspension treated group.
Conclusion
In conclusion Coenzyme Q10 containing nano emulsion formulation was developed to a satisfactory level in terms of lower surfactant concentration, optimum particle size. Minimum PDI, increased dissolution rate as well as enhanced bioavailability. The present study illustrated nano emulsion to be a promising choice over the conventional oral formulation of CoQ10 with a merit of improved dissolution rate and enhanced oral bioavailability. The developed nano emulsion can be employed in food processing sector as well as in pharmaceutical industry utilizing CoQ10 in their preparations.
Acknowledgment
The authors are thankful to CIF Lab for providing the necessary facilities of Jamia Hamdard, Delhi, India. And authors are also thankful to Shilex Chemicals, Delhi, India for sending as a gift CoQ10 and Coconut oil, soyabean oil, clove oil were received as gift sample from Triveni chemicals, Gujarat, India.
References
References
- Hidalgo Gutiérrez A, González García P, Díaz Casado ME, Barriocanal Casado E, López Herrador S, et al. (2021) Metabolic targets of coenzyme q10 in mitochondria. Antioxidants (Basel) 10(4): 520.
- Belhaj N, Dupuis F, Arab Tehrany E, Denis FM, Paris C, et al. (2012) Formulation, characterization and pharmacokinetic studies of coenzyme Q₁₀ PUFA's nano emulsions. Eur J pharm sci 47(2): 305-312.
- Safar A, Dellimore MC (2007) The effect of povidone iodine flush versus drops on conjunctival colonization before intravitreal injections. International Ophthalmology 27(5): 307-312.
- Liu M, Zhu H, Hu X, Zhu Y, Chen H (2020) Efficacy of coenzyme Q10 supplementation on glucose metabolism, lipid profiles, and biomarkers of inflammation in women with polycystic ovary syndrome: A protocol for a systematic review and meta-analysis. Medicine 99(46): e23130.
- Ernster L, Dallner G (1995) Biochemical, physiological and medical aspects of ubiquinone function. Biochimica biophysica acta 1271(1): 195-204.
- Santos GCD, Antunes LMG, Santos ACD, Bianchi MDLP (2009) Coenzyme Q10 and its effects in the treatment of neurodegenerative diseases. Brazilian Journal of Pharmaceutical Sciences 45(4): 607-618.
- Katsouli M, Tzia C (2019) Development and stability assessment of coenzyme Q 10-loaded oil-in-water nano emulsions using as carrier oil: extra virgin olive and olive-pomace oil. Food and Bioprocess Technology 12(1): 54-76.
- Gokce EH, Korkmaz E, Tuncay-Tanrıverdi S, Dellera E, Sandri G, et al. (2012) A comparative evaluation of coenzyme Q10-loaded liposomes and solid lipid nanoparticles as dermal antioxidant carriers. International journal of nanomedicine 7: 5109-5117.
- Gutierrez-Mariscal FM, Arenas-de Larriva AP, Limia-Perez L, Romero-Cabrera JL, Yubero-Serrano EM, et al. (2020) Coenzyme Q10 supplementation for the reduction of oxidative stress: clinical implications in the treatment of chronic diseases. Int J Mol Sci 21(21): 7870.
- Wear D, Vegh C, Sandhu JK, Sikorska M, Cohen J, et al. (2021) Ubisol-Q10, a nano micellar and water-dispersible formulation of coenzyme-q10 as a potential treatment for Alzheimer’s and Parkinson’s disease. Antioxidants (Basel): 10(5): 764.
- Patri KC, Penmets, GS, Kommula MM (2021) Comparative evaluation of coenzyme Q10 dentifrice Vs. commercially available dentifrice in treatment of gingivitis: a randomized double blinded clinical trial. European Journal of Molecular & Clinical Medicine 8(3): 1143-1149.
- Sazali S, Badrin S, Norhayati MN, Idris NS (2021) Coenzyme Q10 supplementation for prophylaxis in adult patients with migraine-a meta-analysis. BMJ open 11(1): e039358.
- Alahmar AT, Calogero AE, Singh R, Cannarella R, Sengupta P, et al. (2021) Coenzyme Q10, oxidative stress, and male infertility: A review. Clinical and experimental reproductive medicine 48(2): 97-104.
- Liu ZX, Artmann C (2009) Relative bioavailability comparison of different coenzyme Q10 formulations with a novel delivery system. Alternative Therapies in Health and Medicine 15(2): 42-46.
- Shikh E, Zozina V, Kondratenko S, Melnikov E, Kukes V (2020) The particulars of certain drugs' effect on the endogenous coenzyme Q10 plasma level in patients with cardiovascular diseases. Drug Metabolism and Personalized Therapy 35(2).
- Balakrishnan P, Lee BJ, Oh DH, Kim JO, Lee YI, et al. (2009) Enhanced oral bioavailability of coenzyme Q10 by self-emulsifying drug delivery systems. Int J Pharm 374(1-2): 66-72.
- Gursoy RN, Benita S (2004) Self-Emulsifying Drug Delivery Systems (SEDDS) for improved oral delivery of lipophilic drugs. Biomedicine Pharmacother 58(3): 173-182.
- Serajuddin AT (1999) Solid dispersion of poorly water-soluble drugs: early promises, subsequent problems, and recent breakthroughs. J pharm sci 88(10): 1058-1066.
- Alam M, Ahmed S, Nikita Moon G, Aqil M, Sultana Y (2018) Chemical engineering of a lipid nano-scaffold for the solubility enhancement of an antihyperlipidemic drug, simvastatin; preparation, optimization, physicochemical characterization and pharmacodynamic study. Artificial Cells, Nanomedicine and Biotechnology 46(8): 1908-1919.
- Pastor-Maldonado CJ, Suárez-Rivero JM, Povea-Cabello S, Álvarez-Córdoba M, Villalón-García I, et al. (2020) Coenzyme Q10: novel formulations and medical trends. Int J Mol Sci 21(22): 8432.
- Ma Y, Li H, Guan S (2015) Enhancement of the oral bioavailability of breviscapine by nano emulsions drug delivery system. Drug Dev Ind Pharm 41(2): 177-182.
- Shukla M, Jaiswal S, Sharma A, Srivastava PK, Arya A, et al. (2017) A combination of complexation and self-nanoemulsifying drug delivery system for enhancing oral bioavailability and anticancer efficacy of curcumin. Drug Dev Ind Pharm 43(5): 847-861.
- Kawakami K, Yoshikawa T, Moroto Y, Kanaoka E, Takahashi K, et al. (2002) Microemulsion formulation for enhanced absorption of poorly soluble drugs I Prescription design. J Control Release 81(1-2): 65-74.
- Vatsraj S, Chauhan K, Pathak H (2014) Formulation of a novel nano emulsion system for enhanced solubility of a sparingly water-soluble antibiotic, clarithromycin. Journal of Nanoscience.
- Laxmi M, Bhardwaj A, Mehta S, Mehta A (2015) Development and characterization of nano emulsion as carrier for the enhancement of bioavailability of artemether. Artificial Cells, Nanomedicine, and Biotechnology 43(5): 334-344.
- Trauschke T, Werner H, Gerlinger T (2009) On the diagnosis and frequency of dementia diseases. Journal of Gerontology and Geriatrics 42(5): 385-390.
- Hatanaka J, Kimura Y, Lai-Fu Z, Onoue S, Yamada S (2008) Physicochemical and pharmacokinetic characterization of water-soluble coenzyme Q(10) formulations. Int J Pharm 363(1-2): 112-117.
- Chen S, Zhang J, Wu L, Wu H, Dai M (2018) Paeonol nano emulsion for enhanced oral bioavailability: optimization and mechanism. Nanomedicine (Lond) 13(3): 269-282.
- Kapoor P, Kapoor A (2013) Coenzyme Q10-a novel molecule. J Indian Acad Clin Med 14(1): 37-45.
- Ahmad I, Pandit J, Sultana Y, Mishra AK, Hazari PP, et al. (2019) Optimization by design of etoposide loaded solid lipid nanoparticles for ocular delivery: Characterization, pharmacokinetic and deposition study. Mater Sci Eng C Mater Biol Appl 100: 959-970.
- Mehnert W, Mäder K (2001) Solid lipid nanoparticles: production, characterization and applications. Advanced Drug Delivery Reviews 47(2-3): 165-196.
- Myers RH, Montgomery DC, Anderson-Cook CM (2016) Response surface methodology: process and product optimization using designed experiments. John Wiley & Sons.
- Zheng M, Falkeborg M, Zheng Y, Yang T, Xu X (2013) Formulation and characterization of nanostructured lipid carriers containing a mixed lipids core. Colloids and Surfaces A: Physicochemical and Engineering Aspects 430: 76-84.
- Wang F, Chen L, Jiang S, He J, Zhang X, et al. (2014) Optimization of methazolamide-loaded solid lipid nanoparticles for ophthalmic delivery using Box-Behnken design. Journal of Liposome Research 24(3): 171-181.
- Müller RH, Mäder K, Gohla S (2000) Solid Lipid Nanoparticles (SLN) for controlled drug delivery-a review of the state of the art. European Journal of Pharmaceutics and Biopharmaceutics 50(1): 161-177.
- Thapa C, Ahad A, Aqil M, Imam SS, Sultana Y (2018) Formulation and optimization of nanostructured lipid carriers to enhance oral bioavailability of telmisartan using Box-Behnken design. Journal of Drug Delivery Science and Technology 44: 431-439.
- Kawish SM, Ahmed S, Gull A, Aslam M, Pandit J, et al. (2017) Development of nabumetone loaded lipid nano-scaffold for the effective oral delivery; optimization, characterization, drug release and pharmacodynamic study. Journal of Molecular Liquids 231: 514-522.
- Singh A, Ahmad I, Akhter S, Jain GK, Iqbal Z, et al. (2013). Nanocarrier based formulation of Thymoquinone improves oral delivery: stability assessment, in vitro and in vivo Colloids Surf B Biointerfaces 102: 822-832.
- Soni K, Rizwan Ullah M, Kohli K (2018). Development and optimization of sulforaphane-loaded nanostructured lipid carriers by the Box-Behnken design for improved oral efficacy against cancer: in vitro, ex vivo and in vivo Artif cells Nanomed Biotechnol 46(sup1): 15-31.
- Woitiski CB, Veiga F, Ribeir A, Neufeld R (2009) Design for optimization of nanoparticles integrating biomaterials for orally dosed insulin. Europ J Pharm Biopharma 73(1): 25-33.
- Siekmann B, Westesen K (1994) Thermoanalysis of the recrystallization process of melt-homogenized glyceride nanoparticles. Colloids Surf B Biointerfaces 3(3): 159-175.
- Qin L, Niu Y, Wang Y, Chen X (2018) Combination of phospholipid complex and submicron emulsion techniques for improving oral bioavailability and therapeutic efficacy of water-insoluble drug. Mol Pharm 15(3): 1238-1247.
© 2022 Yasmin Sultana. This is an open access article distributed under the terms of the Creative Commons Attribution License , which permits unrestricted use, distribution, and build upon your work non-commercially.
 a Creative Commons Attribution 4.0 International License. Based on a work at www.crimsonpublishers.com.
Best viewed in


.jpg)


 Editorial Board Registrations
 Submit your Article
 Refer a Friend
 Advertise With Us
.jpg)


.jpg)


.bmp)
.jpg)
.png)
.jpg)


.jpg)


.png)

.png)


.png)


