
- About Us
- Information
-

The Author ensures that the research has been conducted responsibly and ethically with adherence to all relevant regulations. read more..
- For Authors
- For Reviewer
- Manuscript Guidelines
- Membership
- Publication Ethics
-
- Journals
- Reprints
- e-Books
- Videos
- Policies
- Contact Us
 COVID-19
- Submissions


Full Text
Modern Approaches in Drug Designing
Quantative Structural Modeling of Coumarin -Linked 1,2,4-Oxadiazoles as Selective Tumor-Associated Carbonic Anhydrase, XII Inhibitors
Sarvesh Datta Dixit and Shalini Singh*
Department of Chemistry, India
*Corresponding author: Shalini Singh, QSAR & Cheminformatics Laboratory,Department of Chemistry, Bareilly, India
Submission: May 05, 2022;Published: May 25, 2022

ISSN: 2576-9170 Volume3 Issue5
Abstract
Substituted coumarins, such as sulfocoumarins (1,2-Benzoxathiine-2,2-dioxides) are the most important class of potent and isoform-selective inhibitors of Tumor-Associated Carbonic Anhydrase, CA XII. The regression analyses were carried out using regular as well as Ridge multiple regression analyses. Application of a variety of statistics, namely (δ) statistics, Ridge regression and parameters derived therefrom were used for modeling the CA XII activity. We have attempted to build QSAR models to explore the correlations between the calculated molecular descriptors on a pool of 17 compounds and their experimental CAXII inhibitory activities. The quality of prediction is high enough (Coefficient of Variation 0.0695, r2 =0.9138, F =31.7984, Adj R2= 0.8850). The innovation of this work consists in not only exploring the structural attributes of bioactive molecules
Keywords: Carbonic anhydrase inhibitors; PRECLAV; Tumor-associated carbonic anhydrase XII; Sulfocoumarins; Dragon
Introduction
Carbonic Anhydrases are a superfamily of metalloenzymes with basic function of catalyzing Carbon dioxide hydration and dehydration reactions. These enzymes have been classified into seven genetically different families bearing Latin names, α, β, γ, δ, ζ, η and θ Carbonic Anhydrases (CAs) [1-3]. All Carbonic Anhydrases found in human beings are of the α- class and fifteen isoforms of this class of the enzyme have been discovered and characterized, so far. Out of these fifteen types, only twelve are catalytically active and these are hCAs I to IV, VA, VB, VI, VII, IX, XII to XV. These hCAs can be further divided into four separate subsets on the basis of their presence in the cellular matrix. Thus, hCA I, II, III, VII, VIII, X, XI, XIII are cytosolic proteins, hCA VA, VB are present in the mitochondria, hCA VI is the enzyme, which is secreted, hCA IV is a Glycosylphosphatidylinositol (GPI), an anchored protein and hCA IX, XII and XIV are trans membrane isoforms. These enzymes are of ubiquitous by its presence and are responsible for a wide range of physiological processes of vital importance in living beings viz. electrolyte secretion in a variety of tissues, biosynthetic reactions like gluconeogenesis, lipogenesis, ureagenesis, bone resorption, calcification etc. Dysregulated expression or abnormal activity of these enzymes can culminate in severe pathological conditions, including growth of malignant tumours [4-7]. hCAs IX and XII need a special mention as these are used as markers of disease progression in case of hypoxic tumours and their exclusive or targeted inhibition has the therapeutic effect of reducing both primary tumours and metastases.
The two ubiquitous isoforms, hCA I and II are normally the off- target isoforms as their inhibition along with that of the hCA IX and XII isoforms leads to undesired effects. Thus, the isoform specific CA inhibition has caught the attention of scientists during past few years. The off- target inhibition is associated mainly with the use of the so called classical ‘sulphonamide’ inhibitors. Many non-classical CA inhibitors have been developed and their efficiency tested in recent years. Coumarins are one such important group of non-classical inhibitors [8]. These are widely distributed in nature and are endowed with a variety of pharmacological properties like antioxidant, anti- tubercular, anti-bacterial, anti-coagulant, anti-fungal, antihypertensive, antihyperglycemic, enzyme inhibition etc. These have also been found to be selective and effective hCA IX and hCA XII inhibitors by way of occlusion to the active site entrance. Further, the five membered heterocycle, 1,2,4-oxadiazole is a neutral heterocycle which acts as a substitute for amides and carboxylic acids and possesses excellent pharmacological activity.
Therefore, it was decided to club both the heterocycles, synthesize
coumarin-1,2,4-oxadiazole hybrid with different substituents on
the adjacent benzene ring and test its efficiency towards selective
inhibition of physiologically and pharmacologically active relevant
hCAs using acetazolamide as a standard. The group comprising
Pavitra et al. [9] have worked on this project. They synthesized
various substituents of coumarin-1,2,4-oxadiazole hybrid (from a
to q) and determined Ki (inhibition constant) values for obtaining
an inhibitory potential towards different hCAs [9]. They drew
following conclusions.
A. The two cytosolic enzymes, hCA I and hCA II were not
inhibited by any of the derivatives of the synthesized hybrid
compound as evidenced by the Ki value of 10000nM or above for
all of these.
B. The tumour related isoform, hCA IX was inhibited to the
maximum extent (Ki=23.6nM) by the derivative of the hybrid
containing a methoxy group in the para position of the phenyl ring
located at the 5th position of the 1,2,4-oxadiazole.
C. The other tumour related isoform, hCA XII was best
inhibited by the derivative of the hybrid containing a tertiary
butyl group in the para position of the phenyl ring located at the
5th position of the 1,2,4-oxadiazole (Ki=1.00).
Materials and Methods
Data set for analysis
Figure 1:

The inhibitory activity of 17 sulfocoumarins against hCAs XII was obtained from literature [9]. The known structure and a known value of the inhibitory activity were taken in calibration set to develop a QSAR model and is presented in Table 1 and their structures are shown in Figure 1. Ki activity originally determined in nanomolar values was converted in ‘A’ by means of equation A = log(c/Ki) * where c was taken as 100000 in order to obtain large values of ‘A’. The inhibitory activity value ‘A’ of the molecules under the study spanned in a range from 3 to 5 is more suggestive. Dragon calculated several pharmacokinetic properties-Lipinski violations, [10] flexibility as well as several common measures of bioavailability for each potential analog.
Table 1: Value of the Predictors used in QSAR study of Calibration set and prediction set and CA XII activities (in μM and A = log10000/c), Estimated activities, hat diagonal, Standardized Residual, R |Student| of the calibration set molecules 1-17.

Drug like indices
The drug-like indices are dummy variables having values equal to one when all the criteria of the consensus definition of a drug-like molecule are satisfied, 0 otherwise. These are filters used to extract good drug candidates from large collections of compounds. A drug-like score is a real value ranging from 0 to 1, calculated as the fraction of criteria satisfied. A score of 1 indicates that a compound is a good candidate to be a drug, whereas a score of 0 indicates that a compound will likely not be a drug [11]. The index DLS_01 is a drug-like score based on the Lipinski’s rules. The finding of new bioactive molecule is the most important mean of computational drug discovery by QSAR Model.
Descriptor Calculation
The minimum energy geometry for each compound is performed by the conformational search capability of the hyperchem program [12]. Isomeric SMILES notation was used as program input in order to avoid any influences on conformational model generation by presenting 3D seed structures. The conformations of the minimal energy obtained by molecular mechanic calculations were further minimized by quantum chemical calculations. The semi empirical PM6 method [13-15] included in the MOPAC 2009 software [16], optimized the geometry more thoroughly.
The energy minimized structure is used to compute special molecular properties, as well as physicochemical, electronic, constitutional, virtual fragmentation descriptors, and whole molecule quantum chemical (global) descriptors. MOPAC [16] and [PRECLAV [17] programs are calculated over many descriptors for each molecule. The parameters to be computed are different descriptors that are investigative of molecular structure and used as independent variable.
Chemometric tools
The QSAR model, built by dependent variables, is the experimental information related with biological activity. The parameters to be calculated are various descriptors that are indicative of molecular structure and used as an independent variable. The PRECLAV algorthim [17] was used for obtaining the parameters and for the statistical analysis as reported earlier [18-28]. Regression analysis was done by NCSS [29] software by maximum correlation method, the thumb rule in statistics and calculated. Here, CV is a coefficient of variance, R is a multiple correlation coefficient, R2A is an adjustable R2, and F is the Fishers statistics.
Comment on R2A
Before proceeding further, it is necessary to comment on R2A [30]. By definition it takes into account the adjustment of R2. If a variable is added that does not contribute its fair share, the R2A will decline. R2A is a measure of the % explained variation in the dependent variable that takes into account a relationship between the number of compounds and the number of independent variables in the regression model. Whereas R2 will always increase when an independent variable is added, R2A will decrease if the added variable doesn’t reduce the unexplained variation enough to offset the loss of degrees of freedom.
Variance Inflation Factor (VIF) and eigen values
We now discuss the variance inflation factor (VIF) and eigen
values section, of the parameters involved in the model. These
values are presented.
The VIF is defined as:
VIF = 1 / (1-R2i) (5)
Where Ri is the multiple correlation coefficient of the ith
independent variable on all other independent variables. Thus, a
VIF is defined for each variable in the equation, not for the equation
as a whole, and all the VIF values should be less than 10. All VIF
values for both models 5 and 9 are around 2, and thus much lesser
than 10, indicating these models reach the statistical requirements
and that there is no co-linearity problem. The conclusions arrived
at from VIF values are further confirmed from the respective
correlation matrix, eigen values and Ridge statistics (Figure 2).
Figure 2:Correlation of observed vs. estimated KI in the calibration set and validation set.

Applicability of domain and detection of outliers
Predictive power of a model on the new data set is influenced by the similarity of the chemical nature between the calibration set and prediction set [31]. A QSAR model can be used for screening new compounds if its domain of application defines [29-32] the need to typify the model applicability of the domain which is also reflected in the OECD guidelines for QSAR model validation [32,33]. QSAR model should only be used for making predictions of compounds that fall within the particular domain and may be considered reliable. One simple approach to define-the applicability of the domain is extent of extrapolation [34-36]. This is based on the calculation of the hat diagonal (leverage, hi) for each chemical, where the QSAR model is used to predict its activity [37-39].
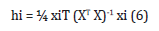
Where, xi = the descriptor-row vector of the query molecule and X = k x n matrix containing the k descriptor values for each one of the n training molecules. A hat diagonal (leverage) value >3(k + 1) ⁄n (leverage warning limit [27] is considered large.
Outliers are observations that poorly fit the regression model. Outlying compounds should not be removed unless a proper reason for their removal is present. The variance of the observed residuals is not constant which makes comparisons among them difficult. One of the solutions to standardize the residuals [38,39] is by dividing them by their standard deviations. This provides a set of residuals with constant variance. |R Student| (cross-validated Leave one out standardized residuals) [40] is a standardized residual that has the impact of a single observation removed from the mean square error. A molecule is defined as an outlier in which |R Student| > 2 [40]. To visualize the applicability of domain of a developed QSAR model, William plot was used. In the William plot, |R Student| versus leverage values (hi) are plotted. This plot could be used for a direct and simple graphical finding of both the response outliers and structurally important compounds in a mode.
Results and Discussion
Using only the “significant” descriptors, PRECLAV computed
ten thousand QSPR type multilinear equations. The quality of the
obtained equations can be reflected by the value of the Q function
and also by values of some usual statistical functions. During the
NCSS MLR analysis, it was observed that the equation with the
highest value of the R function is 4-parametric model and also that
this model holds the highest predictive power, which is as follows:
Dependent property: hCA XII inhibitory activity.
Molecules number in calibration set: 17
Number of “significant” descriptors in presence of prediction set
= 242
log Ki (hCAXII) =84.5050-2.4191 (0.3024) ifd -0.0149(0.0020)
ban -10.4590(1.5848) SM5_B(p)+ 5.7437 (1.9428) DLS_cons
Whereas the quality of correlation is described by the statistical
indices:
Coefficient of Variation 0.0695, r2 =0.9138, F =31.7984, Adj
R2r2cv 0.8850=
Se = standard error of values, r2=Pearson square correlation, F =
Fisher function, R2A is adjustable R2
If d=Spherical shape index
ban =minimum aromaticity of aromatic chemical bonds
SM5_B(p) =Spectral moment of the order 5 from burden matrix
weighted by polarizability
DLS_cons=Dragon consensus drug –like score Drug-like indices
The negative correlation of if d (Spherical shape index) and ban (minimum aromaticity of aromatic chemical bonds), as computed by Preclav descriptor shows that an increase in the value of these descriptor decreases the activity and SM5_B(p).
A dragon descriptor (spectral moment of order 5 from burden matrix weighted by polarizability) shows that as the negative correlation of this descriptor increases the value of the descriptor decreases the activity. The computational alert is a filter that identifies compounds lying in a region of property space
where the probability of useful oral activity is very low. A compound that fails the alert will likely be poorly bioavailable because of poor absorption or permeation. This alert index is a dummy variable taking value 1 when two or more properties are out of range. DLS index is a drug like score based on the Lipinski’s rules.
External validation of the computation method
In this work, the molecules with rank 2,7,10 and 17 for QSAR study constituted the validation set and the remaining molecules formed the reduced calibration set. The validation set of 04 molecules (22% of the database) captured all the features and spanned the activity range of the entire dataset. We may suppose that the reduced calibration set obtained in this method is a representative sample for the calibration set [19]. The remaining 12 molecules formed the reduced calibration set. In case, there is a validation set, the most important tool is the correlation between the estimated and experimental values of the QSAR equation for the molecules in the validation set.
Hence, we can state that the estimated values for the molecules in the validation set are close to the experimental ones and have ordered the molecules in a series according to the actual CAXII activity value. This was confirmed by the graph (Figure 2) between observed and estimated values of the calibration set and the validation set.
Applicability domain
Figure 3:Normal probability plot of residuals of obs. act. |RStudent| of observed vs. Hat Diagonal.

|R Student| of observed inhibitory activity and Hat diagonal (leverage) are used to assign applicability of domain (AD). Table 1 shows the values for leverage calculated for both the calibration set and the prediction set compounds. William plot (Figure 3) shows the applicability of domain for the developed model of the calibration set. The points with leverage value higher than the warning limit are the influential compounds. Therefore, it is not considered an outlier. William plot shows that all molecules in the calibration set lie in the application domain of the developed model (Figure 3). If the residuals are normally distributed, the data points of the normal probability plot will fall along a straight line. Major deviations from this ideal picture reflect departures from normality. Stragglers at either end of the normal probability plot indicate outliers. Curvature at both the end of the plot indicates long or short distributional tails. Convex, or concave curvature indicates a lack of symmetry. Gaps, plateaus, or segmentation indicate clustering and may require a closer examination of the data or model. Of course, use of this graphic tool with very small sample sizes is unwise. If the residuals are not normally distributed, the t-tests on regression coefficients, the F-tests, and the interval estimates are not valid. This is a critical assumption to check (NCSS reference) (Table 2).
Table 2:

Figure 4:Ridge trace section.

This is the famous ridge trace that is the signature of this technique (Figure 4). The plot is really very straight forward to read. It presents the standardized regression coefficients on the vertical axis and various values of k along the horizontal axis. Since the values of k span for several orders of magnitude, adopt a logarithmic scale along this axis. The points on the left vertical axis (the left ends of the lines) are the ordinary least squares regression values. These occur for k equal zero. As k is increased, the values of the regression estimates change, often wildly at first. At some point, the coefficients seem to settle down and then gradually drift towards zero. The task of the ridge regression analyst is to determine at what value of k these coefficients are at their stable values. A vertical line is drawn at the value selected for reporting purposes. It is anticipated that you would run the program several times until an appropriate value of k is determined. In this example, our search would be between 0.0001 and 0.1. The value selected on this graph happens to be 0.066237, the value obtained from the analytic search. We might be inclined to use an even smaller value of k such as 0.01. Remember, the smaller the value of k, the smaller the amount of bias that is included in the estimates (NCSS reference).
This is a plot that we have added that shows the impact of k on the variance inflation factors (Figure 5). Since the major goal of ridge regression is to remove the impact of multicollinearity, it is important to know at what point multicollinearity has been dealt with. This plot shows this. The currently selected value of k is shown by a vertical line. Since the rule-of-thumb is that multicollinearity is not a problem once all VIFs are less than 10, we inspect the graph for this point. In this example, it appears that all VIFs are small enough once.
Figure 5:Ridge regression report.

Conclusion
Statistically, significant linear QSAR models imply the proposal of CA XII activity for data representation, data modeling and data prediction. The excellent correlation with drug like indices established this model. The model shows that polarizability of the compounds does not play a dominant role for the activity. Thus, an attempt has been made to design and develop novel QSAR models against CA XII activity decreases the test and fault issue and predicts the biological activity before synthesis.
Acknowledgment
This article is dedicated to the memory of the late Prof. Padmakar V. Khadikar (1936-2012).
References
- Supuran Claudiu T (2008) Carbonic Anhydrases: novel therapeutic applications for inhibitors and activators. Nat Drug Discov 7(2): 168-181.
- Alterio V, Fiore A Di, Ambrosio KD, Supuran CT, Simone G De (2012) Multiple binding modes of inhibitors to carbonic Anhydrases: how to design specific drugs targeting 15 different isoforms? Chem Rev 112(8): 4421-4468.
- Supuran Claudiu T (2016) Structure and function of carbonic Anhydrases. Biochem J 473(4): 2023-2032.
- Nocentini A, Supuran Claudiu T (2018) Carbonic anhydrase inhibitors as anti-tumour/anti metastatic agents. A patent review (2008-2018) Expert Opin Ther Pat 28(10): 729-740.
- Burmaoglu S, Yilmaz AO, Polat MF, Kaya R, Gulcin I, et al. (2019) Synthesis of novel tris-chalcones and determination of their inhibition profiles against some metabolic enzymes. Arch Physiol Biochem 127(2): 153-161.
- Bayindir S, Caglyan C, Karaman M, Gulcin I (2019) The green synthesis and molecular docking of novel N-substituted rhodamines as effective inhibitors for carbonic anhydrase and acetylcholinesterase enzymes. Bioorg Chem 90: 103096.
- Bottas M, Taslimi P, Yavari MA, Gulcin I, Sahin E, et al. (2019) Synthesis and biological evaluation of bromophenol derivatives with cyclopropyl moiety: ring opening of cyclopropane with monoester. Bioorg Chem 89: 103017.
- Lomelino CI, Supuran CT, Mckenna R (2016) Non-classical inhibition of carbonic Anhydrase. Int J Mol Sci 17(7): 1150.
- Pavitra ST, Andrea A, Omkar SA, Prerna LT, Mohammed A, et al. (2020) Design, synthesis and biological evaluation of coumarin linked 1,2,4-oxadiazoles as selective carbonic anhydrase IX and XII inhibitors. Journal of Bioorganic Chemistry 98: 103739.
- Lipinski CA, Lombardo F, Dominy BW, Feeney PJ (1997) Experimental and computational approaches to estimate solubility and permeability in drug discovery and development settings. Adv Drug Devil Rev 23(1-3): 3-25.
- (2007) TALETE SRL, DRAGON Plus for windows software for molecular descriptor calculations version 5.5, Milano, Italy.
- Hyper chem Software.
- Tresadern G, Bemporad D, Howe T (2009) A Comparison of ligand based virtual screening methods and application to corticotropin releasing factor 1 receptor. J Mol Graph Model 27(8): 860-870.
- Hagler TA (1999) MMFF VI. MMFF94s option for energy minimization studies. J Comput Chem 20(7): 720-729.
- Stewart JJP (2007) Optimization of parameters for semi empirical methods. V. Modification of NDDO approximations and application to 70 elements. J Mol Model 13: 1173-213.
- Stewart JJP (2012) MOPAC2012, Stewart Computational Chemistry, Colorado Springs CO, Colorado, USA.
- (2010) PRECLAV v. 1011, Center of Organic Chemistry -Bucharest, Romania.
- singhIn S (2017) In silico study on the carbonic anhydrase activators: Activation of the humanm transmembrane isozyme XIV useful in Alzheimer’s disease with amino acids and amines. J Indian Chem Soc 94: 543-550.
- Shalini S, Mohan BK (2017) Chemometric modeling on the aromatic sulfonamide’s inhibitors of the human trans membrane carbonic anhydrase isozymes XIV by CoMFAJ. Indian Chem Soc 94: 1-6.
- Singh S (2016) Computational deign and QSPR study on carbonic anhydrase mitochondrial isozymes VA inhibitors: As a anti-obesity agent. Journal Indian Chemical Society 93: 775-780.
- Shalini S, Supuran CT (2016) In silico modeling of β-carbonic anhydrase inhibitors from the fungus Malassezia globosa as antidandruff agents. Journal of Enzyme Inhibition and Medicinal Chemistry 31(3): 417-424.
- Shalini S (2015) In silico molecular modeling of Carbonic anhydrase inhibitors: Inhibition of Plasmodium falciparum carbonic anhydrase with aromatic/heterocyclic sulfonamides. Bioorganic & Medicinal Chemistry Letters 25: 133-141.
- Shalini S (2015) In silico study on the Carbonic anhydrase activators: Activation of the human cytosolic- isozyme III and membrane- associated isoform IV with amino acids and amines. J Indian Chem Soc 92(2): 223-234.
- Singh S, Supuran CT (2014) Chemometric modeling of breast cancer associated carbonic anhydrase IX inhibitors belonging to the ureido-substituted benzene sulfonamide class. J Enzyme Inhib Med Chem 29(6): 877-883.
- Shalini S, Supuran CT (2013) Chemometric QSAR modeling and in silico design of carbonic anhydrase inhibition of a coral secretory isoform by sulfonamide. Bioorganic & Medicinal Chemistry 21(6): 1495-1502.
- Shalini S (2012) QSAR study on the inhibition of the human carbonic anhydrase cytosolic isozyme VII. Journal of the Indian Chemical Society 90 (2): 245-252.
- Shalini S, Supuran CT (2012) QSARs on human carbonic anhydrase VA and VB inhibitors of some new not yet synthesized, substituted aromatic/heterocyclic sulphonamides as anti-obesity agent. J Enzyme Inhib Med Chem 27(5): 666-672.
- Shalini S, Khandekar, Pad Makar V (2011) Comparative QSAR studies on the cyclopentene dicrboxylic acid amides as DHODH inhibitors using PRECLAV and DRAGON descriptor. Proc Nat Acad Sci India 82: 201-209.
- NCSS (Statistical Software Delux package), 329 North 1000 East; Kaysville, UT, USA.
- Chaterjee S, Hadi AS, PriceB (2000) Regression Analysis by Examples. (3rd edn), Wiley, New York, USA.
- Eriksson L, Jaworska J, Worth AP, Cronin MTD, Mc Dowell, et al. (2003) Methods for reliability and uncertainty assessment and for applicability evaluations of classification and regression based QSARs. Environ Health Perspect 111(10): 1361-1375.
- Golbraikh A, Tropsha A (2002) Beware of q2!. J Mol Graph Model 20(4): 269-76.
- Osten DW (1998) Selection of optimal regression models via cross-validation. J Chemom 2(1): 39-48.
- (2007) Organization for Economic Co-operation and Development Guidance Document on the Validation of (Quantitative) Structure-Activity Relationship QSAR Models, OECD Document ENV/JM/ MONO 2.
- Worth AP, Aldenberg T, Benjamin I, Cronin MTD, Gramatica P, et al. (2005) Quantitative structure activity relationships-the report and recommendations of ECVAM workshop 52. Altern Lab Anim 33(2): 155-73.
- Tropsha A, Gramatica P, Gombar VK (2003) The importance of being earnest: validation is the absolute essential for successful application and interpretation of QSPR models. Comb Sci 22(1): 69-77.
- Weaver S, Gleeson MP (2008) The importance of the domain of applicability in QSAR modeling. J Mol Graph Model 26(8): 1315-26.
- Melagraki G, Afantitis A (2013) Enalos KNIME nodes: Exploring corrosion inhibition of steel in acidic medium. Chemometrics and Intelligent Laboratory Systems 123: 9-14.
- Zhong L Xu, Ping G Yu, Zhao W Bi, Akber AH (2008) Quantitative structure-activity relationship study of antifungal analogues of 3,4-substituted 5-((1H-1, 2, 4-triazol-1-yl)methyl)-4H-1,2,4-triazole. Structural Chemistry 19: 959-965.
- Dennis R Cook (1982) Residuals and influence in regression, Chapman and Hall, New York, USA.
© 2022 Shalini Singh. This is an open access article distributed under the terms of the Creative Commons Attribution License , which permits unrestricted use, distribution, and build upon your work non-commercially.
Editor In Chief


.jpg)


Signup for Newsletter

Quick Links
 Editorial Board Registrations
 Submit your Article
 Refer a Friend
 Advertise With Us
Our Recent Edition

.jpg)


Top Editors


.jpg)


.bmp)
.jpg)
.png)
.jpg)


.jpg)


.png)

.png)


.png)


Financial Support

Sponsors

Latest e-Books

Latest Video

 a Creative Commons Attribution 4.0 International License. Based on a work at www.crimsonpublishers.com.
Best viewed in
a Creative Commons Attribution 4.0 International License. Based on a work at www.crimsonpublishers.com.
Best viewed in