- Submissions

Full Text
Journal of Biotechnology & Bioresearch
The Mass-Produced Compound Extract from Antlered form of Ganoderma Lucidum and Red Quinoa Effectively Protects the Liver by Antioxidant and Anti-Inflammatory Mechanisms in Carbon Tetrachloride-Induced Liver Fibrosis Animal Model
Chin-Feng Liu1, Chong-Ming Pan2 and Chun-Lin Lee2*
1Continuing Education Program of Food Biotechnology Applications, National Taitung University, Taitung, Taiwan
2Department of Life Science, National Taitung University, Taitung, Taiwan
*Corresponding author:Chun-Lin Lee, Department of Life Science, National Taitung University, 369, Section 2, University Rd., Taitung 95092, Taiwan
Submission: May 05, 2024;Published: May 21, 2024
Volume5 Issue2May 21, 2024
Abstract
Long-term liver inflammation can lead to severe liver conditions, including cancer. The antlered form of Ganoderma lucidum (G. lucidum AF) and Taiwan red quinoa have been shown to contain potent ingredients, like ganoderic acid, Ganoderma polysaccharides, and rutin, known for their antioxidant, anti-inflammatory and hepatoprotective properties. This study aimed to harness the antioxidant, antiinflammatory, and hepatoprotective properties of the antlered form of G. lucidum AF and red quinoa, also known as red quinoa, to create a compound extract granulated powder (GQE). The extraction process was scaled up using a 300-L extractor, yielding a granulated powder containing ganoderic acid A, rutin and Ganoderma polysaccharide. Efficacy was assessed in a mouse model with carbon tetrachlorideinduced liver fibrosis. Results revealed reduced levels of liver function indicators (aspartate transaminase and alanine transaminase) in the GQE-administered group. GQE also mitigated liver cell damage and collagen buildup. Additionally, GQE significantly reduced the expression of tumor necrosis factor-α and interleukin-6, thereby alleviating liver inflammation. For liver fibrosis, GQE effectively decreased the expression of connective tissue growth factor, transforming growth factor β1, and α-smooth muscle actin, thereby inhibiting excessive extracellular matrix accumulation. Hence, the compound product of G. lucidum AF and red quinoa holds potential as a functional extraction powder to ameliorate liver fibrosis.
Keywords:Liver fibrosis; Antlered form of Ganoderma lucidum; Red quinoa; Extraction trial production; Extract granulated powder
Introduction
Chronic inflammation and untreated liver damage can lead to the development of liver fibrosis, a pathological condition characterized by abnormal healing due to repeated liver injury and repair [1]. This process involves the activation of hepatic stellate cells (HSCs), which promote the synthesis and excessive accumulation of extracellular matrix (ECM) components, including type I and type III collagen and fibronectin [2,3]. The imbalance between ECM synthesis and degradation, favoring fibrogenesis over resolution, drives the progression of liver fibrosis towards cirrhosis. Currently, therapeutic strategies primarily focus on inhibiting ECM synthesis and accumulation, as well as promoting apoptosis of activated HSCs [4].
Ganoderma, a widely utilized traditional medicinal mushroom in various Asian countries, has been associated with health promotion, vitality enhancement, and anti-aging effects [5]. Among the numerous known species of Ganoderma, certain varieties, such as red, purple, and black Lingzhi, have been scientifically validated to possess functional constituents. G. lucidum AF, known as Antler Lingzhi, is a variant with a distinct antler-like structure, often found rarely in the wild due to its slower respiratory rate caused by higher levels of carbon dioxide. This impediment hinders the formation of fruiting bodies [6]. As a consequence, a significant concentration of functional compounds is present at the white tip of the Antler Lingzhi. Studies have confirmed that polysaccharides and triterpenoids found in Lingzhi exhibit potent antioxidant properties, effectively reducing oxidative stress and inhibiting the generation of reactive oxygen species and free radicals [7,8]. These properties make Lingzhi a potential therapeutic agent for preventing liver fibrosis.
This study aimed to optimize the extraction conditions of ganoderic acid A, Ganoderma polysaccharides and quercetin from antler Ganoderma and quinoa, and to apply them to pilotscale production and granulation. To investigate the effects of the compound drops and granules of antler Ganoderma and quinoa on liver fibrosis, carbon tetrachloride-induced liver fibrosis mouse models were used to evaluate the improvement of granules and drops. Carbon tetrachloride is converted to trichloromethyl radical (CCl3˙) and trichloromethyl peroxyl radical (CCl3OO˙) in the endoplasmic reticulum of the liver by cytochrome P450(CYP), which causes lipid peroxidation and oxidative stress [9] and produces inflammatory factors that induce non-parenchymal cells in the liver to secrete pro-fibrotic and pro-inflammatory factors, leading to HSC activation and excessive ECM accumulation, resulting in liver fibrosis [10].
This study measured the changes of liver function indicators aspartate transaminase (AST) and alanine transaminase (ALT); Sirius red and hematoxylin-eosin staining; pro-inflammatory factors interleukin-1β (IL-1β), interleukin-6 (IL-6), cyclooxygenase (COX-2) and tumor necrosis factor-α (TNF-α); pro-fibrotic factors transforming growth factor β1 (TGF-β1), connective tissue growth factor (CTGF) and α-smooth muscle actin (αSMA).
Method and Materials
Chemicals
The following reagents and kits were used for extraction and analysis: 95% ethanol (Echo Chemical Co., Ltd, Miaoli, Taiwan), methanol and acetonitrile (Avantor Inc., Radnor, PA, USA), formic acid (Honeywell Taiwan Ltd., New Taipei, Taiwan), ganoderic acid A (Chengdu Must Bio-Technology Co Ltd, Chengdu, China), rutin and β-glucan (Sigma Co., St. Louis, MO, USA), and BCA protein assay kit (23225) (Merck KGaA (Millipore), Darmstadt, Germany). Carbon tetrachloride (ALPS GHEM Co., LTD, New Taipei, Taiwan) was used to induce liver fibrosis in mice. The following recombinant proteins and antibodies were used for ELISA analysis: Mouse TNF-α protein (50349-MNAE) and mouse IL-6 protein (50136-MNAE) (Sino Biological Inc., North Wales, PA, USA), CTGF protein (LS-G26584) (Lifespan Biosciences Inc., Seattle, WA, USA), rabbit anti-mouse TNF-α polyclonal antibody (AB2148P) (EMD Millipore Corporation, Temecula, CA, USA), mouse anti-rat IL-6 monoclonal antibody (sc-57315) (Santa Cruz Biotechnology, Inc., Dallas, TX, USA), anti- TGF-β1 polyclonal antibody (39303) (Signal way Antibody, College Park, MD, USA), anti-ACTA2 monoclonal antibody (04-1094) (EMD Millipore Corporation, Temecula, CA, USA), and anti-CTGF antibody (FNab02054) (Wuhan Fine Biotech Co. Ltd., Wuhan, China).
Extraction conditions
In this study, G. lucidum AF and quinoa provided by GE’s health research and development Co. (Taitung, Taiwan) were used to examine the extraction conditions. 5 g each of coarsely ground G. lucidum AF powder and quinoa were mixed with 100ml of 0%, 35%, 55%, 75% and 95% ethanol solutions. The mixture was then shaken at 60 °C for 1h to evaluate the effect of different ethanol concentrations on the extraction of ganoderic acid A, Ganoderma polysaccharide, and quercetin. The optimal ethanol concentration was determined according to the results of previous studies, and the same extraction ratio was used, and the mixture was shaken for 1hr at temperatures of 50 °C, 60 °C, and 70 °C each. This study aimed to evaluate the effects of different temperatures on the extraction of Ganoderma acid A, Ganoderma polysaccharides and quercetin. Finally, choose the optimal ethanol concentration and temperature, and shake the mixture for 0.5h, 1h, and 2h, respectively, using the previous extraction ratio. The purpose of this analysis was to investigate the effects of different extraction times on the extraction of Ganoderma acid A, Ganoderma polysaccharides and quercetin. By synthesizing the results of these three experiments, the researchers obtained the optimal extraction conditions for extracting active ingredients from . lucidum AF and quinoa.
Extraction scale study
The experiment yielded the optimal extraction conditions for scaling up the extraction of G. lucidum AF and quinoa. The extractto- solvent ratio was adjusted from 5g of G. lucidum AF and quinoa added to 100mL of solvent to 100g of G. lucidum AF and quinoa added to 2L of solvent. The resulting extract was then compared to the content of ganoderic acid A, Ganoderma polysaccharides, and quercetin obtained from small-scale extraction.
Investigating the impact of extracting and concentrating G. lucidum AF and quinoa using a 300-L tank
According to the optimal extraction conditions derived from the previous two experimental conditions, the final conditions for conducting a 300-L extraction were determined based on the specific requirements of the 300-L extraction and concentration tank. Initially, 20kg of G. lucidumAF and 3kg of quinoa were separately introduced into the 300-L extraction tank. Subsequently, 200L of RO water was added at a temperature of 80 °C for the initial stirring extraction, which lasted for 2hrs. Following the extraction process, the extract was transferred to a temporary storage barrel for preservation. Next, an additional 100L of RO water was added to the extraction tank at 80 °C for the second stirring extraction, which lasted for 1hr. After the extraction, the extract was drained and combined with the first extract. The resulting mixture was then subjected to vacuum concentration to obtain the water extract concentrate. Subsequently, 120L of ethanol was added to the tank at a temperature of 70 °C for the third stirring extraction, which lasted for 2hrs. Following the extraction, the extract was drained into a temporary storage barrel for preservation. Then, 80L of ethanol was added to the extraction tank at 70 °C for the fourth stirring extraction, which lasted for 1hr. After the extraction, the extract was drained and mixed with the third extract. Finally, vacuum concentration was performed to obtain the ethanol extract concentrate.
Preparation of granulated extraction powder (G. lucidum AF and quinoa granulated extraction powder, GQE)
An appropriate quantity of mixed concentrate was poured into the feed tank of the fluidized bed granulation and drying equipment for the purpose of heating and stirring. Subsequently, maltodextrin powder was poured into the product tank of the fluidized bed granulator and dryer, where it remained on standby. The machine was initiated to spray the mixed concentrate onto the maltodextrin powder in the air lift, causing the maltodextrin powder to absorb moisture from the concentrate and form small granules. Once the spraying of the mixed concentrate was complete, the feed tank was turned off, and only the drying mode of the fluidized bed was activated to dry the granulated extraction powder at a low temperature. Finally, a sample was taken to determine the moisture content, which needed to be below 5% for the GQE compound product. The product was then collected, dried for storage and subsequently subjected to testing, analysis, and animal experiments.
Ganoderic acid A analysis method
To analyze the content of ganoderic acid A, we utilized the methodology described by [11] with certain modifications. The drops and granulated extraction powder were dissolved in methanol at a 1:4 ratio, then appropriately diluted the resultant solution or extract based on the desired concentration. Subsequently, the solution was filtered through a 0.45μm filter head and conducted HPLC analysis using a YMC-Triart C18/S- 5μm/12μm column (250×4.6mm). The mobile phase consisted of acetonitrile (solvent A) and water with 0.1% formic acid (solvent B). The gradient conditions were as follows: during the initial 0 to 25 mins, the proportion of solvent A increased from 30% to 40.7%, while the proportion of solvent B decreased from 70% to 59.3%; from 25 to 40mins, solvent A increased from 40.7% to 100%, while solvent B decreased from 59.3% to 0%; from 40 to 50mins, solvent A remained at 100%, while solvent B remained at 0%; from 50 to 55mins, solvent A decreased from 100% to 30%, while solvent B increased from 0% to 70%; and finally, from 55 to 60mins, solvent A was maintained at 30%, while solvent B was maintained at 70%.
The flow rate was set to 1mL/min, the wavelength was set to 253nm, the injection volume was 20μL, and the column temperature was 40 °C.
Rutin analysis method
To analyze the content of rutin, we followed the method with some modifications [12]. We reconstituted the drops and granulated extraction powder in methanol at a ratio of 1:4, and then diluted the resulting solution or extract according to the concentration requirement. After filtering through a 0.45μm filter head, we performed HPLC analysis using an Ascentis®C18 column (5μm, 25cm×4.6nm). The mobile phase consisted of acetonitrile (solvent A) and water with 0.1% formic acid (solvent B). The gradient condition was as follows: from 0 to 20min, solvent A was kept at 17%, while solvent B was kept at 83%; from 20 to 25min, solvent A increased from 17% to 65%, while solvent B decreased from 83% to 35%; from 25 to 35 min, solvent A was kept at 65%, while solvent B was kept at 35%; from 35 to 40min, solvent A increased from 65% to 100%, while solvent B decreased from 35% to 0%; from 40 to 45min, solvent A was kept at 100%, while solvent B was kept at 0%; from 45 to 50min, solvent A decreased from 100% to 17%, while solvent B increased from 0% to 83%; and from 50 to 55min, solvent A was kept at 17%, while solvent B was kept at 83%. The flow rate was set at 1mL/min, the wavelength was set at 250nm, the injection volume was set at 20μL, and the column temperature was set at 40 °C.
Preparation of crude polysaccharides
G. lucidum AF and water were shaken at 90 °C for 1hr at a ratio of 1:10. After the extraction, the extract and 95% ethanol were mixed at a volume ratio of 1:4 to precipitate the polysaccharides for 24hr. Then, the supernatant was removed, and the precipitate was dried to obtain the crude polysaccharides of antler Ganoderma.
Animal feeding, grouping and dosing
The BALB/c inbred mice utilized in this animal experiment were obtained from the National Animal Experiment Center in Taipei, Taiwan. The mice were 8 weeks old, with 7 mice assigned to each group. The mice were housed in a controlled environment with a temperature of 24±1 °C, humidity set at 60%, and a 12-hr light cycle (8:00-20:00) in the cubicle. Throughout the experiment, the mice had unrestricted access to food and water. The feeding dosage was determined based on the guidelines provided by the US Food and Drug Administration (FDA). Specifically, the dose per kilogram of mouse was 12.3 times higher than the recommended daily intake per kilogram of body weight for a 60kg adult. The conversion formula employed was as follows: Human dose divided by 60, multiplied by 12.3, equals the Mouse dose (US Food and Drug Administration, 2005).
The NOR group served as the control group and received intraperitoneal injections of olive oil only. The CCl4 group, which acted as the negative control, received intraperitoneal injections of tetrachloromethane dissolved in olive oil at a dosage of 0.4μL/g B.W. The GQ powder group (GQ group) received a mixture of antler Ganoderma and quinoa powder with a recommended daily intake of 2g per person. The corresponding mouse dose was 410mg/kg after conversion. The GQ extraction powder 1x group (GQE 1x group) and 5x group (GQE 5x group) had recommended daily intakes of 0.37g and 1.85g per person, respectively. The mouse doses for these groups were 75.25mg/kg and 379.25mg/kg after conversion. The crude polysaccharide extract 1x group (PS 1x group) and crude polysaccharide extract 5x group (PS 5x group) received Ganoderma crude polysaccharide extract at 1-fold and 5-fold concentrations, respectively. The recommended daily intakes for these groups were 0.2g and 1g per person, respectively. The corresponding mouse doses were 41mg/kg and 205mg/kg after conversion.
Induction of liver fibrosis mouse model
The liver fibrosis mouse model was modified from previous studies [13]. BALB/c male mice were used as experimental animals. Except for the NOR group, the other groups started intraperitoneal injection of CCl4 (0.4μL/g B.W) three times a week from the third week, for a total of 18 times in six consecutive weeks.
Animal sacrifice and blood collection
The mice were fasted for 14hrs before sacrifice. On the day of sacrifice, the mice’s body weight after fasting was measured, and they were euthanized using carbon dioxide. Once it was confirmed that the mice had no respiration, heartbeat, or pain response, dissection, blood collection, and liver harvesting were performed. The blood was centrifuged after a 2-hr incubation period, and the serum in the supernatant was frozen at -20 °C for later analysis. The liver was removed from the mouse’s body, photographed, and weighed. A portion of the liver was cut off and placed in 10% formalin for later histopathological sectioning. The remaining liver was washed with 0.9% saline, stored in a zip lock bag, and preserved at -80 °C for later analysis.
Liver function blood biochemical analysis
The liver function indicators AST and ALT were entrusted to Shangjie Medical Laboratory Clinic (Tainan, Taiwan) for testing with a biochemical automatic analyzer (Beckma-700, Fullerton, CA, USA).
Histopathological analysis
The liver tissue was fixed in formalin and cut with a scalpel to a thickness of 0.3mm and placed in a tissue embedding box. Then, the Animal Technology Institute (Miaoli, Taiwan) was entrusted to perform paraffin embedding, sectioning and hematoxylin and eosin (H&E) staining. In addition, the paraffin sections were dewaxed and stained with picrosirius red for collagen. Finally, the stained sections were observed and photographed under a microscope (magnification 40X, 100X, 400X).
Tissue protein analysis
0.1g of liver was weighed and placed in a frozen tube, and 1 milliliter of 0.1M PBS (2.76mg of Na2HPO4; 0.35mg of NaH2PO4) was added for homogenization. After homogenization, the homogenate was centrifuged at 10,000xg at 4 °C for 10mins, and the supernatant was extracted. This step was repeated three times until there was no liver tissue debris in the supernatant. Finally, the supernatant was frozen at -80 °C for later analysis. A commercially available BCA protein assay kit was used for measurement. It consisted of reagent A (BCA), reagent B (CuSO4), and standard bovine serum albumin (BSA). First, 25mL of tissue homogenate and standard were pipetted into a 96-well plate. Then, reagent A and reagent B were mixed at a ratio of 50:1, and 200mL were pipetted into the 96-well plate containing the tissue homogenate and standard. The mixture was then reacted at 37 °C for 30mins. Finally, the absorbance at 526nm was measured. A calibration curve was prepared with the standard, and the protein content of the sample was calculated from the absorbance value.
Statistical Analysis
The experimental results are expressed as mean ± standard deviation (mean ± SD). One-way ANOVA was performed using SPSS 22.0 system for statistical analysis, and then Duncan’s Multiple Range Test was used for intergroup comparison. A p value of less than 0.05 indicated a significant difference.
Result
Investigation of extraction conditions for ganoderic acid A, ganoderma polysaccharides and rutin
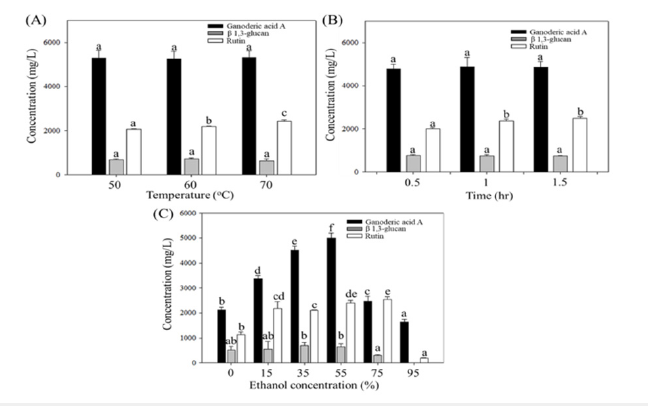
In this experiment, G. lucidum AF and quinoa were extracted for ganoderic acid A and rutin components under different temperatures, times, and ethanol concentrations. As shown in Figure 1, there was no significant difference in ganoderic acid A under different temperature and time extraction (p>0.05), while increasing ethanol concentration could improve the extraction efficiency of ganoderic acid A, and the best effect was achieved at 55% ethanol extraction concentration (p<0.05), but the concentration of ganoderic acid A was significantly decreased at 75% and 95% ethanol extraction (p<0.05). The polysaccharide concentration had no significant difference under different temperature and time extraction (p>0.05), and the highest polysaccharide concentration was obtained at 35% and 55% ethanol extraction, but no polysaccharide was dissolved at 95% ethanol extraction. The rutin concentration increased with increasing temperature and reached the highest concentration at 70 °C (p< 0.05), and after extracting for 1hr and 1.5hrs, the rutin concentration was significantly higher than extracting for 0.5hr (p<0.05), but there was no significant difference between groups (p>0.05). In addition, at 55% and 75% ethanol extraction, it was significantly higher than 0%, 35% and 95% ethanol extraction (p<0.05), and there was no significant difference between groups (p>0.05).
Figure 1:Concentration changes of Ganoderma A, Ganoderma lucidum polysaccharides, and rutin in the extraction
solution under different extraction conditions.
(A) Extraction temperature
(B) Extraction time
(C) Extraction ethanol concentration. Different letters indicate significantly different values according to a one-way
ANOVA using Duncan’s multiple test (p<0.05).
Amplified extraction of ganoderic acid A and rutin
As presented in Table 1, the optimal extraction conditions were determined by thoroughly investigating various extraction experiments. The extraction conditions were then amplified 20 times for comparison. The results revealed that after the amplification process, ganoderic acid A, Ganoderma polysaccharides, and rutin increased by 11.5%, 11%, and 14.7%, respectively. Hence, amplified extraction remains highly effective in extracting the active ingredients of G. lucidum AF and quinoa.
Table 1:The effect of 100mL and 2-L extraction scales on ganoderic acid A, crude polysaccharide, and rutin.

Pilot production of granulated extraction powder of G. lucidum AF and quinoa
This experiment utilized a 300-L stirred ethanol extraction tank, and the extract underwent concentration using a continuous vacuum concentrator. Referring to the pilot production process in Table 2, a single batch of G. lucidum AF and quinoa weighed 23kg. The subsequent steps involved water extraction, ethanol extraction, vacuum concentration, and finally drying and granulation of the concentrated liquid using a fluidized bed. This process yielded 50kg of granulated extraction powder. The granulated extraction powder exhibited the following composition: 1.463mg/g of ganoderic acid A, 0.9746mg/g of Ganoderma polysaccharides, and 0.771mg/g of rutin.
Table 2:The effects of granulated extraction powder of G. lucidum AF and red quinoa on the body weight gain of CCl4- induced liver fibrosis in mice.

Two groups of mice were administered with olive oil (NOR group) or 0.4μL/g B.W. CCl4 (CCl4 group) by intraperitoneal injection without the administration of test materials, respectively. Other liver fibrosis mice were administered with G. lucidum AF and red quinoa powder (410mg/kg/day, GQ), granulated extraction powder (75.25mg/kg/day, GQE 1x), granulated extraction powder (379.25mg/kg/day, GQE 5x), crude polysaccharide (41mg/kg/ day, PS 1x), crude polysaccharide (205mg/kg/day, PS 5x). Data are presented as mean ± SD (n=7). Different letters indicate significantly different values according to a one-way ANOVA using Duncan’s multiple test (p<0.05).
The effect of G. lucidum AF and quinoa granulated extraction powder on body weight, liver weight and liver weight to body weight ratio in carbon tetrachlorideinduced liver fibrosis mice
Previous studies have demonstrated that injecting CCl4 intraperitoneally into mice causes weight loss and increases liver weight and liver weight to body weight ratio [12]. The results of this study (Table 2) revealed no difference in initial body weight among the groups at week 0 (p>0.05). However, by the 2nd week, the CCl4 group exhibited significantly lower body weight compared to the NOR group (p<0.05), indicating that the intraperitoneal injection of CCl4 reduced mouse body weight. After eight weeks of animal experiments, administering GQE at 1x and 5x doses, as well as PS at 1x and 5x doses, significantly increased body weight compared to the CCl4 group (p<0.05). However, the GQ group (powder group) still did not achieve a significant increase in body weight recovery (p>0.05). The results presented in Table 3 demonstrated a significant increase in liver weight for the CCl4 group compared to the NOR group (p<0.05), indicating that intraperitoneal injection of CCl4 increased mouse liver weight. In contrast, although the GQE 1x and GQE 5x groups exhibited a tendency to decrease liver weight, the difference was not statistically significant (p>0.05). On the other hand, the GQ, PS 1x, and PS 5x groups significantly reduced liver weight (p<0.05) compared to the CCl4 group. Analyzing the ratio of liver weight to body weight, it was evident that CCl4 injection resulted in a significant increase in this ratio (p<0.05 vs. NOR group). However, all test substance groups managed to significantly reduce the ratio of liver weight to body weight caused by CCl4 injection (p<0.05), with the most effective outcome observed in the PS 5x group.
Table 3:The effects of granulated extraction powder of G. lucidum AF and red quinoa on body weight, liver weight and liver weight-to-weight ratio of CCl4-induced liver fibrosis in mice.

Two groups of mice were administered with olive oil (NOR group) or 0.4μL/g B.W. CCl4 (CCl4 group) by intraperitoneal injection without the administration of test materials, respectively. Other liver fibrosis mice were administered with G. lucidum AF and red quinoa powder (410mg/kg/day, GQ), granulated extraction powder (75.25mg/kg/day, GQE 1x), granulated extraction powder (379.25mg/kg/day, GQE 5x), crude polysaccharide (41mg/kg/ day, PS 1x), crude polysaccharide (205mg/kg/day, PS 5x). Data are presented as mean ± SD (n=7). Different letters indicate significantly different values according to a one-way ANOVA using Duncan’s multiple test (p<0.05).
The effect of antler Ganoderma and quinoa granulated extraction powder on liver function indicators in carbon tetrachloride-induced liver fibrosis mice
Abnormal elevation of AST and ALT activity in the serum is an important indicator of liver injury [14]. The results presented in Table 4 demonstrate a significant increase in AST activity after the injection of carbon tetrachloride in the CCl4 group (p<0.05). This suggests that liver cells were damaged by the injection of CCl4, leading to a substantial release of AST into the bloodstream. However, when animals were fed with GQE 5x and PS 5x, there was a significant reduction in serum AST activity (p<0.05). In contrast, the GQE 1x, GQ, and PS 1x groups only exhibited a downward trend in AST activity, which was not statistically significant (p>0.05). Furthermore, compared to the NOR group, the CCl4 group showed a significant increase in ALT activity (p<0.05), indicating the effective induction of liver cell injury by CCl4 injection. Nevertheless, the administration of GQE 5x and PS 5x led to a significant reduction in ALT activity induced by CCl4 (p<0.05), while the GQE 1x, GQ, and PS 1x groups demonstrated only a downward trend (p>0.05). These results highlight that feeding granulated extraction powder and crude polysaccharides at five-fold doses effectively mitigates the increase in liver function indicators induced by CCl4.
Table 4:The effects of antler granulated extraction powder of G. lucidum AF and red quinoa on AST and ALT activities in serum of mice with CCl4-induced liver fibrosis.
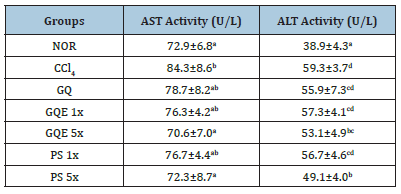
Two groups of mice were administered with olive oil (NOR group) or 0.4μL/g B.W. CCl4 (CCl4 group) by intraperitoneal injection without the administration of test materials, respectively. Other liver fibrosis mice were administered with G. lucidum AF and red quinoa powder (410mg/kg/day, GQ), granulated extraction powder (75.25mg/kg/day, GQE 1x), granulated extraction powder (379.25mg/kg/day, GQE 5x), crude polysaccharide (41mg/kg/ day, PS 1x), crude polysaccharide (205mg/kg/day, PS 5x). Data are presented as mean ± SD (n=7). Different letters indicate significantly different values according to a one-way ANOVA using Duncan’s multiple test (p<0.05).
Histopathological analysis of liver sections from carbon tetrachloride-induced liver fibrosis mice treated with G. lucidum AF and red quinoa extract granulated powder
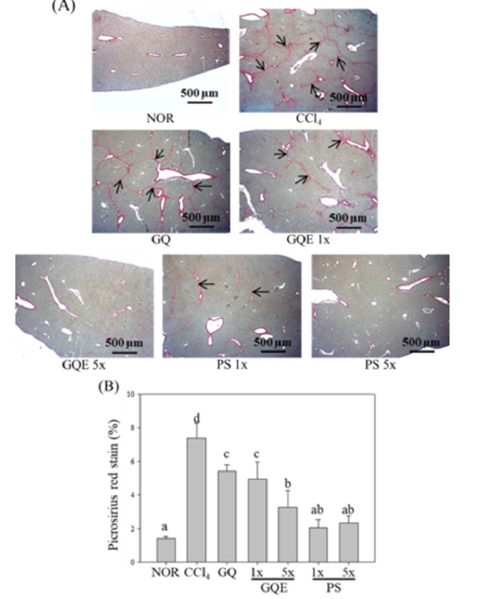
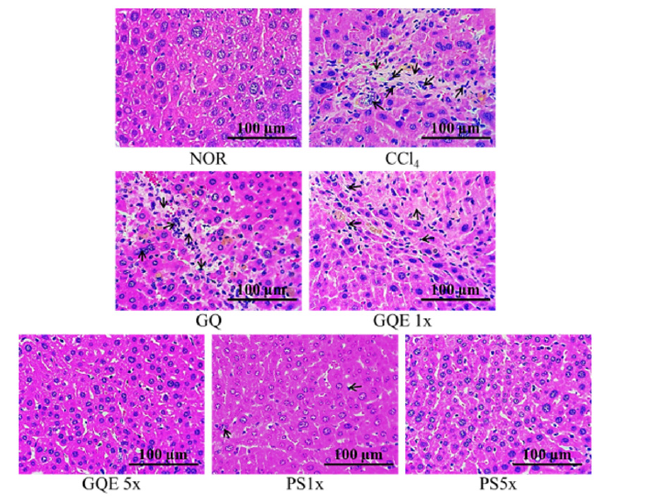
This study utilized H&E staining and Sirius red staining to assess the extent of liver damage and fibrosis. Figures 2 and 3 depict the liver H&E staining, revealing disordered hepatocyte arrangement, cell membrane damage, and nuclear shrinkage resulting from CCl4 injection in the CCl4 group, leading to a noticeable shrinkage of damaged hepatocytes. Feeding GQE 5x and PS 1x significantly mitigated hepatocyte aggregation caused by cell damage, while GQE 1x, GQ, and PS 1x still exhibited some hepatocytes with abnormal arrangement. Figure 3 displays the liver Sirius red staining, illustrating a substantial amount of red collagen distributed in the liver of the CCl4 group, whereas the NOR group showed no significant accumulation compared to the CCl4 group. The quantification graph indicated that feeding PS (1x and 5x) significantly reduced collagen accumulation, with an effect comparable to the NOR group (p<0.05). Furthermore, GQE 5x, GQE 1x, and GQ groups all reduced collagen accumulation compared to the CCl4 group (p>0.05).
Figure 2:The effects of granulated extraction powder of G. lucidum AF and red quinoa on hepatic pathological changes of CCl4-induced liver fibrosis mice model. (100X) Two groups of mice were administered with olive oil (NOR group) or 0.4μL/g B.W. CCl4 (CCl4 group) by intraperitoneal injection without the administration of test materials, respectively. Other liver fibrosis mice were administered with G. lucidum AF and red quinoa powder(410mg/kg/ day, GQ), granulated extraction powder (75.25mg/kg/day, GQE 1x), granulated extraction powder (379.25mg/kg/ day, GQE 5x), crude polysaccharide (41mg/kg/day, PS 1x), crude polysaccharide (205mg/kg/day, PS 5x). Data are presented as mean ± SD (n=7). Different letters indicate significantly different values according to a one-way ANOVA using Duncan’s multiple test (p<0.05).l
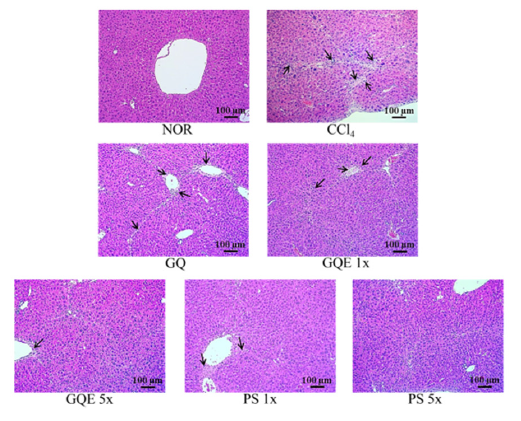
Figure 3:The effects of granulated extraction powder of G. lucidum AF and red quinoa on hepatic collagen staining analysis in CCl4-induced liver fibrosis mice model. (40 X). (A) The photogram of picosirius red stain; (B) The integral area percentage of the picosirus red stain in liver section. Two groups of mice were administered with olive oil (NOR group) or 0.4μL/g B.W. CCl4 (CCl4 group) by intraperitoneal injection without the administration of test materials, respectively. Other liver fibrosis mice were administered with G. lucidum AF and red quinoa powder (410mg/kg/ day, GQ), granulated extraction powder (75.25mg/kg/day, GQE 1x), granulated extraction powder (379.25mg/kg/ day, GQE 5x), crude polysaccharide (41mg/kg/day, PS 1x), crude polysaccharide (205mg/kg/day, PS 5x). Data are presented as mean ± SD (n=7). Different letters indicate significantly different values according to a one-way ANOVA using Duncan’s multiple test (p<0.05).
The effect of G. lucidum AF and quinoa granulated extraction powder on liver pro-inflammatory factors in carbon tetrachloride-induced liver fibrosis mice
CCl4 can activate macrophages in the liver, inducing the production of cytokines IL-1β, IL-6, and TNF-α, which cause liver inflammation [15] and lead to liver damage. The study’s results (Figure 4) demonstrate that the expression levels of IL-1β, IL-6, and TNF-α in the CCl4 group were significantly higher than those in the NOR group (p<0.05), indicating a considerable increase in the expression of inflammatory factors in the liver tissue due to CCl4 exposure. When subjects were given GQE (1x and 5x) and GQ, there was a significant reduction in the expression of IL-1β in the liver (p<0.05). Additionally, feeding PS (1x and 5x) significantly reduced the expression of IL-6 in liver tissue (p<0.05), while the GQE 1x, GQE 5x, and GQ groups showed only a downward trend (p>0.05). Furthermore, GQE (1x and 5x) and PS 5x significantly reduced the expression of TNF-α (p<0.05), whereas the GQ and PS 1x groups showed only a downward trend (p>0.05). CCl4 induced NF-κB in Kupffer cells of the liver, promoting the expression of the downstream inflammatory factor cyclooxygenase (COX-2) [16]. In this study (Figure 5), the COX-2 expression level in the CCl4 group was significantly higher than that in the NOR group (p< 0.05). However, feeding GQE 5x and PS (1x and 5x) resulted in a significant reduction in COX-2 expression (p<0.05), while GQE 1x showed a downward trend (p<0.05). Notably, feeding GQ did not reduce the expression level of COX-2 (p>0.05).
Figure 4:The effects of granulated extraction powder of G. lucidum AF and red quinoa on the expressions of IL- 1β, IL-6 and TNF-α in liver of mice with CCl4-induced liver fibrosis. Two groups of mice were administered with olive oil (NOR group) or 0.4μL/g B.W. CCl4 (CCl4 group) by intraperitoneal injection without the administration of test materials, respectively. Other liver fibrosis mice were administered with G. lucidum AF and red quinoa powder (410mg/kg/day, GQ), granulated extraction powder (75.25mg/kg/day, GQE 1x), granulated extraction powder (379.25mg/kg/day, GQE 5x), crude polysaccharide (41mg/kg/day, PS 1x), crude polysaccharide (205mg/kg/day, PS 5x). Data are presented as mean ± SD (n=7). Different letters indicate significantly different values according to a one-way ANOVA using Duncan’s multiple test (p<0.05).
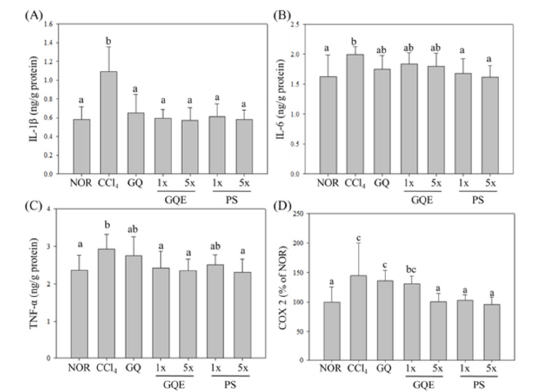
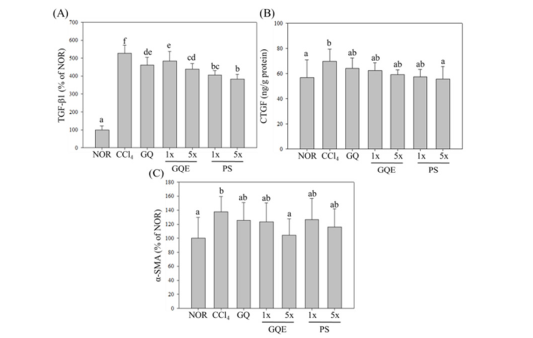
Figure 5:The effects of granulated extraction powder of G. lucidum AF and red quinoa on the expressions of TGF-β1, CTGF and α-SMA in liver of mice with CCl4-induced liver fibrosis. Two groups of mice were administered with olive oil (NOR group) or 0.4μL/g B.W. CCl4 (CCl4 group) by intraperitoneal injection without the administration of test materials, respectively. Other liver fibrosis mice were administered with G. lucidum AF and red quinoa powder (410mg/kg/day, GQ), granulated extraction powder (75.25mg/kg/day, GQE 1x), granulated extraction powder (379.25mg/kg/day, GQE 5x), crude polysaccharide (41mg/kg/day, PS 1x), crude polysaccharide (205mg/kg/day, PS 5x). Data are presented as mean ± SD (n=7). Different letters indicate significantly different values according to a one-way ANOVA using Duncan’s multiple test (p<0.05).
The effect of G. lucidum AF and quinoa granulated extraction powder on liver fibro genic factors in carbon tetrachloride-induced liver fibrosis mice
CTGF is a downstream regulator of TGF-β1 and works synergistically with TGF-β1 to enhance ECM production, leading to liver fibrosis [17]. Figure 6 illustrates that the expression level of TGF-β1 in the CCl4 group was significantly higher than that in the NOR group (p<0.05), indicating that CCl4 injection promoted the development of liver fibrosis. The study results demonstrate that administering each test substance significantly reduced the increased expression level of TGF-β1 caused by CCl4 injection (p<0.05). Among the test groups, the polysaccharide group receiving five times the dose (PS 5x group) showed the most effective reduction in TGF-β1 expression, and the GQE 5x group had a better effect than the GQ powder group (GQ group). The expression level of CTGF in the CCl4 group was significantly higher than that in the NOR group due to CCl4 injection (p<0.05). However, after administering different test substances, the GQE 5x, PS 1x, and PS 5x groups had significantly lower CTGF expression levels than the CCl4 group (p<0.05). On the other hand, the GQE 1x and GQ groups only showed a downward trend, indicating that the unextracted powder and lower concentration extraction powder had a less pronounced effect on reducing CTGF expression levels. Furthermore, activated HSCs can induce myofibroblasts to secrete α-SMA, leading to the accumulation of extracellular matrix and ultimately causing liver fibrosis [18]. The study results (Figure 6) reveal that the expression level of α-SMA in the CCl4 group was significantly higher than that in the NOR group (p<0.05), indicating that CCl4 metabolism activated myofibroblasts and increased the expression level of fibro genic factors. However, after administering the test substances, the GQE 5x group significantly reduced α-SMA expression levels (p<0.05), whereas the GQE 1x, PS (1x and 5x) groups only showed a downward trend (p>0.05). Based on the above results, it can be speculated that GQ extraction and administration at five times the dose can significantly decrease the expression of pro-inflammatory factors TGF-β1 and α-SMA in mice with liver fibrosis induced by CCl4 (p<0.05).
Figure 6:The effects of granulated extraction powder of G. lucidum AF and red quinoa on hepatic pathological changes of CCl4-induced liver fibrosis mice model. (100X) Two groups of mice were administered with olive oil (NOR group) or 0.4μL/g B.W. CCl4 (CCl4 group) by intraperitoneal injection without the administration of test materials, respectively. Other liver fibrosis mice were administered with G. lucidum AF and red quinoa powder (410mg/kg/ day, GQ), granulated extraction powder (75.25mg/kg/day, GQE 1x), granulated extraction powder (379.25mg/kg/ day, GQE 5x), crude polysaccharide (41mg/kg/day, PS 1x), crude polysaccharide (205mg/kg/day, PS 5x). Data are presented as mean ± SD (n=7). Different letters indicate significantly different values according to a one-way ANOVA using Duncan’s multiple test (p<0.05).
Discussion
The effect of different conditions and scales on the extraction of ganoderic acid A, Ganoderma polysaccharides and rutin
In this study, small-scale experiments were conducted, as shown in Figure 4, to investigate the extraction of ganoderic acid A and Ganoderma crude polysaccharides from antler Ganoderma. It was found that the main factor influencing the extraction process was the concentration of ethanol. When the ethanol concentration increased to 55%, the highest concentration of ganoderic acid A and Ganoderma crude polysaccharides could be obtained. However, further increase in ethanol concentration led to a decrease in the release of these compounds. The extraction time and temperature had no significant effect on the process. Conversely, for the extraction of rutin from quinoa, increasing the time, temperature, and ethanol concentration resulted in a higher concentration of rutin, but when the ethanol concentration reached 95%, only a small amount of rutin could be extracted. Based on these results, the optimal extraction conditions were determined to be 55% ethanol at 70 °C for 1hr. Subsequently, these optimal conditions were scaled up 20 times for extraction. It was observed that ganoderic acid A, Ganoderma crude polysaccharides, and rutin increased by 11.5%, 11%, and 14.7%, respectively. This outcome demonstrates that increasing the extraction ratio while maintaining the same conditions remains stable. Furthermore, the optimal extraction conditions were applied to a 300-L extraction tank for extraction and concentration. The final products obtained were G. lucidum AF and quinoa granulated extraction powder, with quantities of 50kg and 2.3kg, respectively. Additionally, granulated extract drops were also produced based on specific requirements.
The improvement effect of G. lucidum AF and quinoa granulated extraction powder on liver function indicators and histopathology in CCl4-induced liver fibrosis mice
AST and ALT are stored in the normal liver, and when the liver is damaged, AST and ALT are released into the bloodstream. Therefore, measuring AST and ALT activity in the serum is considered an indicator of liver function. Previous studies have shown that after injecting CCl4 in mice, AST and ALT activity in the serum significantly increase, but feeding Ganoderma water extract polysaccharides can significantly reduce AST and ALT activity [1]. In this study, as shown in Table 4, injecting CCl4 induced liver injury in mice, resulting in significantly higher AST and ALT activity than in the NOR group (p<0.05). Among them, the GQE 5x group had the best effect in reducing AST and ALT activity, while the GQE 1x and GQ groups only showed a downward trend (p>0.05). This result is consistent with previous studies. Additionally, GQ after extraction granulation had a better effect in reducing AST and ALT activity compared to the GQ powder group. H&E staining is a common method to assess the liver’s pathological condition. Some studies have indicated that CCl4-induced liver fibrosis leads to necrosis and apoptosis of hepatocytes, promoting the development of liver fibrosis [2]. In this study, as shown in Figures 2 and 3, the CCl4 group exhibited disordered hepatocyte arrangement, numerous apoptotic bodies, and necrotic hepatocytes, indicating severe liver damage caused by CCl4. After administering the test substances, the liver still showed varying degrees of damage, but the GQE 5x group displayed more normal cell arrangement, fewer apoptotic bodies, and a more even distribution. In contrast, the GQ group did not show significant improvement in hepatocyte arrangement and cell status. Furthermore, Sirius red staining was used to mark collagen distribution in the liver’s extracellular matrix. As shown in Figure 4, collagen accumulation in the CCl4 group was not only present around the blood vessels but also in a band-like pattern between the liver tissues. After feeding GQE 5x, the collagen accumulation between the liver tissues disappeared, leaving only residual collagen around the blood vessels. However, after feeding GQ, there was still collagen accumulation between the liver tissues. The quantification chart clearly indicates that the GQE 5x group had a significantly better effect in improving collagen accumulation compared to the GQE 1x and GQ groups (p<0.05).
The improvement effect of G. lucidum AF and quinoa granulated extraction powder on inflammatory factors in CCl4-induced liver fibrosis mice
In the liver, CCl4 is converted by CYP2E1 into trichloromethyl radical (CCl3˙), which participates in free radical reactions and lipid peroxidation [3,4], leading to hepatocyte apoptosis, Kupffer cell activation and inflammation [5]. Previous studies have shown that injection of CCl4 increases the expression of IL-1β, IL-6 and TNF-α in mouse liver and feeding Ganoderma crude extract polysaccharides can reduce their expression [1,6,7]. In this experiment (Figures 5 and 6), after CCl4 induction, the expression of pro-inflammatory factors TNF-α, IL-6, IL-1β and COX 2 in mouse liver was significantly increased (p<0.05). In TNF-α expression, GQE 1x and 5x both significantly reduced it to a similar level as NOR group and PS group (p<0.05), which is consistent with previous studies. GQ had a downward trend but no significant difference (p>0.05). This indicates that GQ had a better effect in improving TNF-α expression after extraction. In terms of IL-6 expression, GQ and GQE groups could reduce its expression, which is consistent with previous studies, but there was no significant difference between GQ and GQE groups (p>0.05), indicating that whether extraction had no significant effect on IL-6 expression. In terms of IL-1β expression, GQ and GQE groups could significantly reduce IL-1β expression (p<0.05), which is consistent with previous studies. In addition, there was no significant difference between GQ and GQE groups (p>0.05), also indicating that whether extraction had no significant effect on IL-1β expression. In addition, in COX 2 expression, GQE 5x could significantly reduce COX 2 expression (p<0.05), but GQ did not significantly reduce it (p>0.05), indicating that GQ had a significant effect in improving COX 2 expression after extraction.
The above results show that GQ after extraction can reduce the expression of inflammatory factors IL-1β, TNF-α and COX 2 in CCl4-induced liver fibrosis mice but has no significant effect on IL-6 expression. This may be because the reduction effect has reached the upper limit, so even if the component content is increased by extraction, it cannot reduce more IL-6 expression.
The improvement effect of G. lucidum AF and quinoa granulated extraction powder on fibro genic factors in CCl4-induced liver fibrosis mice
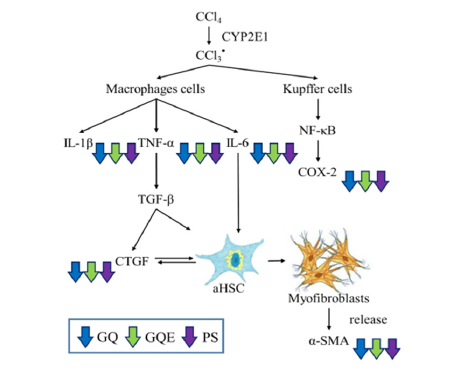
Pro-inflammatory factors such as IL-6 and TNF-α can increase the expression of TGF-β1, and further activate HSC [19] and induce the differentiation of myofibroblasts to produce α-SMA and CTGF, causing excessive accumulation of extracellular matrix and leading to liver fibrosis [2,20]. Previous studies have found that feeding Ganoderma polysaccharides can reduce the expression of TGF-β1 in CCl4-induced liver fibrosis mice [21]. In this experiment (Figure 7), after CCl4 induction, the expression of fibro genic factors TGF-β1, α-SMA and CTGF in mouse liver was significantly increased (p<0.05). In terms of reducing TGF-β1 expression, GQ and GQE (1x and 5x) groups could significantly reduce it (p<0.05), which is consistent with previous studies. However, there was no significant difference between GQ and GQE 5x groups (p>0.05), and GQE 1x group had a worse effect than GQ group (p>0.05). Therefore, it can be speculated that whether GQ is extracted has no significant effect on reducing TGF-β1 expression. In terms of reducing CTGF expression, GQ and GQE (1x and 5x) groups could significantly reduce it (p<0.05), and there was no significant difference between groups (p>0.05). This result indicates that whether GQ is extracted has no significant effect on reducing CTGF expression. In terms of reducing α-SMA expression, GQE 5x group could significantly reduce it (p<0.05), while GQ and GQE 1x groups only showed a downward trend (p>0.05). Therefore, extracting GQ and feeding five-fold dose can enhance its ability to reduce α-SMA expression. Based on the above results, it can be speculated that extracting GQ and feeding five-fold dose can significantly reduce the expression of pro-inflammatory factors TGF-β1 and α-SMA in CCl4-induced liver fibrosis mice (p<0.05) [22-26].
Figure 7:GQ, GQE, and PS regulated the pro-inflammatory and RPO-fibrosis mechanisms in CCl4-induced hepatic fibrosis
Conclusion
In conclusion, this study examines the extraction conditions of the compound from G. lucidum AF and red quinoa. The optimal conditions were determined as follows: extraction with 55% alcohol at 70 °C for 1hr. These conditions were then utilized in a 300-L extraction and concentration process. Subsequently, granulated powder was developed from the extract, and a trial mass production of extraction drops was conducted, resulting in final products of 50kg and 2.3kg, respectively. Furthermore, the two products were applied to evaluate their effectiveness in improving liver fibrosis in mice and to speculate on the underlying mechanism. The results indicate that the granulated powder and extract drops of G. lucidumm AF and red quinoa extract can inhibit the expression of inflammatory factors such as IL-6, IL-1β, TNF-α, and COX-2 to varying degrees, thereby reducing liver damage. Among these factors, the reduction in TNF-α expression further inhibits the expression of its downstream factor TGF-β, thus decreasing the activation of hepatic stellate cells and reducing the expression of pro-fibrosis factors α-SMA and CTGF. Ultimately, this slows down the progression of liver fibrosis. Moreover, the ability of G. lucidum AF and red quinoa extract granules and extract drops to improve liver fibrosis is superior to that of unextracted G. lucidum AF and red quinoa powder. However, administering 5 times the dose of extract granules is necessary to achieve better improvement, while the effect of administering 1 time the dose of extract drops is equivalent to 5 times the dose.
Author Contribution
C.-F.L.: Experiments on fermentation, functional compound analysis, animal test, and paper writing. C.-M. P.: Experiments on fermentation, functional compound analysis, and animal test. C.-L.L.: Experiments, experiment design, funding application, experiment discussion, paper writing, and submission. All authors have read and agreed to the published version of the manuscript.
Institutional review board statement
The study was conducted according to the guidelines of the Declaration of Helsinki and approved by the Institutional Animal Care and Use Committee (IACUC) of the National Taitung University.
Informed consent statement
Not applicable.
Data Availability Statement
All data included in this study are available upon request by contacting the corresponding authors.
Acknowledgment
We thank GE’s Health R&D Co. (Taitung, Taiwan) for providing antlered form of Ganoderma lucidum and red quinoa.
Conflicts of interest
The authors declare no conflict of interest.
References
- Friedman SL (2023) Liver fibrosis -- from bench to bedside. J Hepatol 38 Suppl 1: S38-S53.
- Nakano Y, Kamiya A, Sumiyoshi H, Tsuruya K, Kagawa T, et al. (2020) A deactivation factor of fibro-genic hepatic stellate cells induces regression of liver fibrosis in mice. Hepatology 71(4): 1437-1452.
- Khambu B, Yan S, Huda N, Liu G, Yin XM (2018) Autophagy in non-alcoholic fatty liver disease and alcoholic liver disease. Liver Res 2(3): 112-119.
- Ramón B, Brenner D (2005) Liver fibrosis. J Clin Invest 115(5): 209-218.
- Yuen JW, Gohel MD (2005) Anticancer effects of Ganoderma lucidum: A review of scientific evidence. Nutr Cancer 53(1): 11-17.
- Sudheer S, Taha Z, Manickam S, Ali A, Cheng PG (2018) Development of antler-type fruiting bodies of Ganoderma lucidum and determination of its biochemical properties. Fungal Biol 122(5): 293-301.
- Kao PF, Wang SH, Hung WT, Liao YH, Lin CM, et al. (2012) Structural characterization and antioxidative activity of low-molecular-weights beta-1,3-glucan from the residue of extracted Ganoderma lucidum fruiting bodies. J Biomed Biotechnol 2012: 673764.
- Wu JG, Kan YJ, Wu YB, Yi J, Chen TQ, et al. (2016) Hepatoprotective effect of ganoderma triterpenoids against oxidative damage induced by tert-butyl hydroperoxide in human hepatic HepG2 cells. Pharm Biol 54(5): 919-929.
- Slater T, Cheeseman K, Ingold KU (1985) Carbon tetrachloride toxicity as a model for studying free-radical mediated liver injury. Philosophical Transactions of the Royal Society of London. B, Biological Sciences 311(1152): 633-645.
- Iwaisako K, Jiang C, Zhang M, Cong M, Moore M, et al. (2014) Origin of myofibroblasts in the fibrotic liver in mice. Proc Natl Acad Sci USA 111(32): E3297-3305.
- Yang X, Wang Z, Kai J, Wang F, Jia Y, et al. (2020) Curcumol attenuates liver sinusoidal endothelial cell angiogenesis via regulating Glis‐PROX1‐HIF‐1α in liver fibrosis. Cell Proliferation 53(3): e12762.
- Lin TA, Ke BJ, Cheng CS, Wang JJ, Wei BL, et al. (2019) Red quinoa bran extracts protects against carbon tetrachloride-induced liver injury and fibrosis in mice via activation of antioxidative enzyme systems and blocking TGF-β1 pathway. Nutrients 11(2): 395.
- Ke BJ, Lee CL (2018) Cordyceps cicadae NTTU 868 mycelium prevents CCl4-induced hepatic fibrosis in BALB/c mice via inhibiting the expression of pro-inflammatory and pro-fibrotic cytokines. Journal of Functional Foods 43: 214-223.
- Gowda S, Desai PB, Hull VV, Avinash AK, Vernekar SN, et al. (2009) A review on laboratory liver function tests. The Pan African Medical Journal 3: 17.
- Chen X, Li XF, Chen Y, Zhu S, Li HD, et al. (2019) Hesperetin derivative attenuates CCl4-induced hepatic fibrosis and inflammation by Gli-1-dependent mechanisms. International Immunopharmacology 76: 105838.
- Shehzad A, Rehmat S, Ul-Islam S, Ahmad R, Aljafary M, et al. (2020) Lirioresinol B dimethyl ether inhibits NF-κB and COX-2 and activates IκBα expression in CCl4-induced hepatic fibrosis. BMC Complementary Medicine and Therapies 20(1): 1-9.
- Gressner OA, Gressner AM (2008) Connective tissue growth factor: A fibro-genic master switch in fibrotic liver diseases. Liver international 28(8): 1065-1079.
- Veres SA, Pap D, Sziksz E, Jávorszky E, Rokonay R, et al. (2017) Selective measurement of α smooth muscle actin: Why β-actin can-not be used as a housekeeping gene when tissue fibrosis occurs. BMC molecular biology 18(1): 1-15.
- Liu H, Dong F, Li G, Niu M, Zhang C, et al. (2018) Liuweiwuling tablets attenuate BDL-induced hepatic fibrosis via modulation of TGF-β/Smad and NF-κB signaling pathways. Journal of Ethnopharmacology 210: 232-241.
- Khambu B, Yan S, Huda N, Liu G, Yin XM (2018) Autophagy in non-alcoholic fatty liver disease and alcoholic liver disease. Liver Research 2(3): 112-119.
- Gao Z, Yuan F, Li H, Feng Y, Zhang Y, et al. (2019) The ameliorations of Ganoderma applanatum residue polysaccharides against CCl4 induced liver injury. International Journal of Biological Macromolecules 137: 1130-1140.
- Guo XL, Liang B, Wang XW, Fan FG, Jin J, et al. (2013) Glycyrrhizic acid attenuates CCl4-induced hepatocyte apoptosis in rats via a p53-mediated pathway. World journal of gastroenterology 19(24): 3781.
- Basu S (2003) Carbon tetrachloride-induced lipid peroxidation: Eicosanoid formation and their regulation by antioxidant nutrients. Toxicology 189(1-2): 113-127.
- Weber LW, Boll M, Stampfl A (2003) Hepatotoxicity and mechanism of action of haloalkanes: Carbon tetrachloride as a toxicological model. Critical reviews in toxicology 33(2): 105-136.
- Heindryckx F, Colle I, Van VH (2009) Experimental mouse models for hepatocellular carcinoma research. International Journal of Experimental Pathology 90(4): 367-386.
- Yang XJ, Liu J, Ye LB, Yang F, Ye L, et al. (2006) In vitro and in vivo protective effects of proteoglycan isolated from mycelia of Ganoderma lucidum on carbon tetrachloride-induced liver injury. World Journal of Gastroenterology 12(9): 1379.
© 2024 Chun-Lin Lee. This is an open access article distributed under the terms of the Creative Commons Attribution License , which permits unrestricted use, distribution, and build upon your work non-commercially.
 a Creative Commons Attribution 4.0 International License. Based on a work at www.crimsonpublishers.com.
Best viewed in


.jpg)


 Editorial Board Registrations
 Submit your Article
 Refer a Friend
 Advertise With Us
.jpg)


.jpg)


.bmp)
.jpg)
.png)
.jpg)


.jpg)


.png)

.png)


.png)


