
- About Us
- Information
-

The Author ensures that the research has been conducted responsibly and ethically with adherence to all relevant regulations. read more..
- For Authors
- For Reviewer
- Manuscript Guidelines
- Membership
- Publication Ethics
-
- Journals
- Reprints
- e-Books
- Videos
- Policies
- Contact Us
 COVID-19
- Submissions


Full Text
Journal of Biotechnology & Bioresearch
Potency Ratio, Combining Ability and Heterosis Analysis of Kenaf (Hibiscus Cannabinus L.) Parents and Crosses Considering Seed Yield
Md Al Mamun1,2*, Mohd Y Rafii1,3, Zaiton Ahmad4, Md Mahmudul Hasan Khan1,5 and Yusuff Oladosu1
1Laboratory of Climate-Smart Food Crop Production, Institute of Tropical Agriculture and Food Security (ITAFoS), University Putra Malaysia (UPM), 43400, UPM Serdang, Selangor, Malaysia
2Bangladesh Jute Research Institute (BJRI), Dhaka-1207, Bangladesh
3Department of Crop Science, Faculty of Agriculture, University Putra Malaysia (UPM), 43400, UPM Serdang, Selangor, Malaysia
4Agrotechnology and Bioscience Divisions, Malaysian Nuclear Agency, Bangi, 43000 Kajang, Selangor Malaysia
5Bangladesh Agricultural Research Institute (BARI), Gazipur-1701, Bangladesh
*Corresponding author:Md Al Mamun, Laboratory of Climate-Smart Food Crop Production, Institute of Tropical Agriculture and Food Security (ITAFoS), University Putra Malaysia (UPM), 43400, UPM Serdang, Selangor, Malaysia
Submission: October 04, 2023;Published: November 20, 2023
Volume5 Issue1November 20, 2023
Abstract
Thirty-six F1 hybrid crosses and nine parental lines were evaluated in two environments to estimate General Combining Ability (GCA) and Specific Combining Ability (SCA) effects on seed yield traits. Diallel results based on Griffing B method 2 revealed highly significant differences for all traits tested for GCA and SCA except plant height which revealed the existence of both additive and nonadditive gene actions for the inheritance of the relevant traits. The magnitude of GCA variance was considerably higher than that of SCA variance except for top diameter, and fresh stem weight with leaves and pods, showing the additive gene action predominates for these traits. In both conditions, Hayman and Jinks’s graphical studies demonstrated that partial dominance controlled various seed yield traits such as plant height and days to first flowering. On the other hand, pods yield and the majority of physical traits indicated either dominance or overdominance gene action. Plant height, fresh stem weight with leaves and pods, and pods per plant, all had a strong positive relationship with seed yield. These variables also had a higher proportion of additive effects, a higher baker ratio and a moderate narrow-sense heritability, indicating successful indirect selection for seed yield. The parental lines P6, P7 and P9 were identified as good general combiners for seed yield contributing traits. The hybrids P1 × P4, P2 × P8, P3 × P8, P4 × P6, P5 × P7, P6 × P9 and P7 × P9 outperformed the parents in terms of heterotic responses and showing that they have a lot of genetic potential for kenaf enhancement in tropical climates.
Keywords: Gene action; Combining ability; Potence ratio; Seed yield; Kenaf
Introduction
Kenaf is cultivated for fibres, oils, proteins, allelopathic chemicals and fibre strands [1]. Although the plant is developed for its fibre, its leaves and seeds have been utilized in customary Indian and African medication to treat illnesses [2]. Kenaf seed cultivation is also economically important since it is a good source of oil (16 to 22 percent) [3] and a source of anticancer compounds, as reported by Wong et al. [4]. Kenaf seeds products are currently used for lubrication, soap production, cosmetics, linoleum and varnishes [5]. Monti [6] described that kenaf seeds can also be used as a medication for various health complications and diseases, such as cholesterol poise, some forms of cancers and blood pressure. Furthermore, Mohamed et al. [7] reported that kenaf oil is high in phospholipid content (3.9 to 10.3 percent), which is higher than soybean (1.5 to 3.0 percent) and cottonseed (2.0 percent), making it appropriate for industrial usage. It has been proposed that kenaf might be a viable oil seed crop if yields of 1.2 tha-1 can be reached [7].
A successful breeding program to develop superior cultivars requires knowledge of the nature and magnitude of genotypic and phenotypic variability present in crop species [8]. The diallel mating design has been commonly applied in self-pollinated and cross-pollinated varieties to better understand the nature of gene action in developing quantitative features [9]. Combining ability analysis can be used to find superior hybrid parents with high General Combining Ability (GCA) and progenies with higher Specific Combining Ability (SCA) [10]. It can also be used to assess the genetic worth of parents and crosses in terms of gene action in quantitative character inheritance and breeding exploitation techniques [11]. Parental cultivars having a high GCA are mostly controlled by additive gene action [12]. Meanwhile, SCA estimate is useful in genetic research for determining gene action that is influenced by the phenotype’s traits. Nonadditive gene action is identified by a high SCA [13]. SCA effects were greater than GCA effects when measured in terms of average effects (components), demonstrating the relevance of nonadditive gene action in regulating yield component expression [14]. SCA and GCA data help breeders choose hybrids and parents that will produce good offspring [15]. Inbred lines with good combining ability are carefully chosen in heterosis breeding programs for the best possible hybrid seed production [16]. Selection for transgressive separation in progeny generation, access to gene actions that influence seed yield and crossing lines with strong GCA are crucial for improving kenaf production [17].
The frequency of dominant and recessive genes and the number and cluster of genes regulating the quality of interest can all be used to improve breeding program planning [18]. Plant breeders use GCA and SCA data to choose appropriate genotypes and generate new high-yielding cultivars [19,20]. Heritability is a fundamental genetic trait that can be calculated in broad and narrow senses [21]. By relying on heritability, the breeder can appreciate the production of the variation that is due to genotypic (broad-sense heritability) or additive (narrow-sense heritability) effects [8]. Thus, estimates of heritability are useful in predicting the transmission of characters from the parents to their offspring [22]. It will be extremely beneficial to improve the kenaf crop in Malaysia’s tropical environment by selecting genotypes with unique genetic histories [23]. The main purpose of this study was to find genotypes (parents and offspring) with good combining ability, which could aid future kenaf improvement by increasing seed production. This research aimed to use a diallel analysis to quantify the genetic variation of morpho-physiological parameters and examine if different kenaf mutants in tropical climates have different patterns of morpho-physiological parameters combining abilities.
A better understanding of the relationship between yield and its component traits is provided by correlation studies between traits, which aids plant breeders in their selection processes [16]. Significant positive correlation between the two characters because of their strong relationship, indicating that they can be improved simultaneously in a selection program [24]. This strong correlation was caused by the high positive direct effect on yield [25]. Understanding the relative contribution of the various component traits to yield could play a significant role in identifying high-yielding genotypes from genetically variable populations by providing information on indirect selection for yield [26]. According to Solieman et al. [27], phenotypic correlation is the relationship between two traits that may be directly observed and determined by measurements of the traits in a large population of individuals. Seed availability is needed for the crop’s extensive expansion in tropical nations for biomass production. Kenaf is a short-day plant that remains vegetative until the day length falls below 12 hours [28] or 12 hours and 45 minutes [29]. Photoperiod sensitivity influences cultivar selection and sowing timing, as well as harvest timing [30]. Early flowering cultivars were ideal for feed, whereas late flowering and leafy varieties were suitable for fibre and seed production [31,32]. On the other side, late maturation raises the chance of seed production. As a result, cultivating midlate maturing groups with high biomass and seed yields in the local area is critical [33]. Because of the longer dry season, kenaf is mostly grown for seed production in the northern parts of Malaysia [34]. If a promising trait is identified with a particular mutant line, is to multiply seeds of such identified lines for broad field trials.
As part of the ASEAN Free Trade Area (AFTA), the Malaysian government encouraged kenaf planting to replace tobacco import duties by 2010 [35]. The availability of high-quality jute and kenaf seed would help to ensure fibre quality to a large extent [36]. Thus, breeding kenaf in Malaysia is essential for producing seeds and would help ensure high fibre content and adaptable growth in the local climate [37]. In some countries, including China, Russia and Thailand, kenaf hybrids have been employed for commercial farming, contributing to increasing production [38]. In Malaysia, hybrid kenaf technology is considered novel and should be studied further in terms of genetics, agronomy and crop management. This study aimed to find the best possible amount of pods/plant in kenaf to increase seed production in a tropical climate. Additionally, estimations of heterosis over both the mid-parent and better parent together with potency ratio were generated, along with correlation coefficients between any two possible pairs of the traits studied. A hybrid kenaf breeding program is required to develop a high-yielding, stable-performance hybrid kenaf for the Malaysian environment. As a result, developing locally adapted hybrid kenaf seeds is a viable alternative for enhancing national kenaf yield and increasing kenaf producer income.
Method and Materials
Experimental location
The studies were conducted repeated at Ladang 10, University Putra Malaysia (UPM), Serdang, Selangor, Malaysia, at a latitude of 2° 59΄N and a longitude of 101° 42΄ E, at 48 meters above sea level in a humid tropical climate. The daily solar radiation, relative humidity, maximum and minimum mean monthly temperatures (°C) and total rainfall (mm) for the experimental periods are shown in Table 1.
Table 1:Daily photoperiod, evaporation, air maximum and lowest temperatures, and rainfall were all measured during field experiments.

Source: Agrobiodiversity & Environment Research Centre, MARDI, Selangor, Malaysia (2021).
Planting materials
Eight mutant lines developed from V-36 through acute and chronic gamma irradiation by the Malaysian Nuclear Agency in Bangi, Selangor [37] and one was a commercial variety from Bangladesh (Table 2). Nine parental materials were mated in a diallel method, removing reciprocals, while considering group distances, genetic distance and other agronomic performance [17]. Pure and healthy seeds were sown three times at 10-day intervals in the trial field to achieve flowering synchronization. The nine parental genotypes and 36 F1 hybrids were used in this study.
Table 2:List of nine Kenaf genotypes utilized as diallel cross parents.

Experimental design and crop husbandry
Kenaf seeds from 45 entries, comprising nine parents and 36 F1 hybrids, were sown in a germination tray filled with peat moss soil [18]. Twenty-one seedlings were transplanted into a 60cm ×180cm plot with a distance of 10×40cm inter and intra row spacing after two weeks, to a depth of two to 2.5cm. There were 135 plots and the entire plots measured 59m×9m. The experiment was conducted in a randomized complete block design with three replications using a table of random digits [39]. Standard kenaf production provided a good crop with the best management. NPK Green (15:15:15) and NPK Blue (12:12:17) were treated at 450kg/ha shortly after seeding and 40 days after planting. Intercultural activities like weeding, thinning, irrigation and plant protection measures were carried out as when due throughout the cropping environment.
Data collection
Data were collected from ten randomly selected plants for each genotype and each replication for seven seed yield traits including plant height, days to first flowering, number nodes/plant, fresh stem weight with leaves and pods, pods/plant, seeds/pod, and 1000-seed weight (Table 3).
Table 3:Quantitative characters studied seven seed yield traits of nine parents and their crosses.

Statistical Analysis
Performance of hybrids
An analysis of variance (ANOVA) was used with the PROC GLM function of the Statistical Analysis System (SAS) computer software version 9.4 to determine the significance of variation among genotypes and blocks. A combined ANOVA from 9 × 9 diallel (F1 and parents) was performed for each growth environment, eliminating reciprocals as indicated by Steel et al. [40]. To compare the mean performance among hybrids and paternal inbred lines, the Least Significant Difference (LSD) method was used.
Estimation of heterosis and heterobeltiosis
The values of heterosis over mid and better parents from F1
were calculated for the different studied traits [17].
i) Mid-parent heterosis (MPH) was computed using the formula
of Zahour [41]:
MPH (%) = [(F1 – MP)/MP] × 100
ii) Better-parent heterosis or heterobeltiosis (BPH) was
calculated using the procedure of Tang and Xiao [42]:
BPH (%) = [(F1- BP)/BP] × 100
Where F1, mean value of the particular hybrid population; MP, mean value of the two parents for that hybrid (P1 + P2)/2 and BP, mean value of the better parent.
Combining ability analysis
Griffings and Hayman’s techniques [43,44] were used to analyse the genetics of the diallel population. According to Baker [45], the combining ability ratio was determined. A modified Hayman [46] ANOVA was calculated after Jones’s [47] adjustment. The genetic system influencing important kenaf traits and general and specific combining abilities has been studied [18].
Diallel analysis by Griffing’s method
Griffing’s [43] Method 2 (one set of F1 progenies and their parental lines) was used to analyze the diallel [47]. The GCA of parents and SCA of hybrids were determined following Griffing’s [43] method 2 model 1 (fixed effects).
Diallel analysis by Hayman’s approach
Most plant breeding programs that attempt to improve yield and other related parameters start with parallel analysis. Breeders utilize it the most to determine the utility of varieties as parents and to analyse gene action in diverse qualities [47,48]. The following are the main features of Hayman’s approach: (i) Hayman’s ANOVA; (ii) Vr, Wr analysis with graphical representation; and (iii) components of variation and genetic parameters.
Hayman’s ANOVA and Morley Jones modification
Hayman [46] analyzed variance for the entire diallel table, expanding on Yates’s [49] work in one direction. Reciprocal differences are typically considered absent; therefore, just one reciprocal cross from each pair is elevated. Jones [48] modified Hayman’s technique in response to this situation. In Hayman’s model, the sum of squares corresponding to additive effect (a), mean dominance (b1) and additional dominance effects accounted for by genes with one allele present in only one line (b2) (the remaining n-1 lines were assumed to contain the same alternative allele), as well as residual dominance effects (b3), are essentially a basic application of least squares fitting constants [49,50].
Vr, Wr regression analysis
The regression coefficient was calculated by using the following formula:
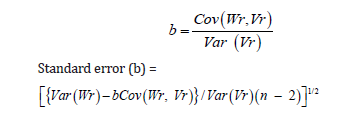
Where, Vr, Variance of each array; Wr, Covariance between parents and their offspring; Var (Vr), Variance of Vr; Var (Wr), Variance of Wr; Cov (Wr, Vr), Covariance between Vr and Wr.
Genetic components of variation and heritability
Hayman [46] and Jinks [51] were used to determine the genetic and environmental components of variation and allied or related genetic factors in F1. In the analysis of combining ability, the variance components in the ANOVA table were used to estimate broad-sense and narrow-sense heritability. The following equation was used to determine the heritability estimates for each kenaf attribute in each environment suggested by Falconer [52]:
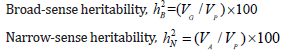
Where VG , genetic variance; VP , phenotypic variance; VA , additive genetic variance.
Vr, Wr graph
The Vr, Wr graph can be used to interpret a diallel cross [45,51]. By calculating the array variance (Vr), parent-offspring covariance (Wr) and regression of Wr on Vr, it is possible to test the adequacy of the simple additive dominance genetic model, discern the relative proportion of dominant and recessive alleles present in the common parents of each array and determine the average level of dominance.
Estimation of potency ratio
In terms of determining the degree of dominance, Smith [53] calculated the potency ratio using the following method:
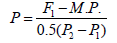
where P, relative potence of gene set; F1: First generation mean; P1: The mean of lower parent, P2: The mean of higher parent; M.P.: Mid-parents value = (P1 + P2)/2. Values more than unity (-1< P > +1) indicated overdominance, values less than unity (+1.0>P<– 1.0) indicated partial dominance, values equal unity (+1.0 = P = -1.0) indicated complete dominance and values equal zero (P = 0) indicated no dominance.
Phenotypic correlation coefficients
Simple Pearson Phenotypic Correlation Coefficients for seed yield traits were computed using proc Corr SAS software version 9.4 to investigate any possible relationship between traits at an alpha value of 0.05. A coefficient value of 0 indicates the absence of any association between variables, a value close to zero, either positive or negative, indicates a weak correlation, whereas a value nearing either 1 or -1 indicated a strong correlation [53].
Result and Discussion
Variation in pooled environments across all genotypes
All traits tested had highly significant (p ≤ 0.01) variations in environment and genotypes (parents and offspring). In the pooled quantitative data of the two environments for nine parents and their crosses, genotype by environment interaction (G × E) was significant (p ≤ 0.01 or 0.05) except for PH and NS (Table 4). The CV% for seed yield traits range from 9.40 (DTFF) to 69.05 (NN), showing that the evaluated traits have a wide variability. The results indicate that the effects of genes controlling these traits were expressed differently in different environments. All the traits showed significant differences across genotypes and environments in the combined analyses of variance, indicating that the materials had enough genetic variation to improve these features. For all studied traits, the most significant environments, mean squares and their interactions with genotypes were detected, indicating that the season had enough environmental variability to cause fluctuations in all population component rankings, i.e., different genotypes ranked differently from environment to environment. Alza et al. [54] and Abd El-Satar et al. [47] reported similar findings.
Table 4:Over two environments, a combined analysis of variance was performed for seven seed yield traits of nine parents and their crosses.

Legend: *Significant at P<0.05 level; **highly significant at P≤0.01 level; CV, coefficient of variation; PH: Plant height; DTFF, Days to 1st flowering; NN: Nodes number; FSW: Fresh stem weight with leaves and pod; NF: Pods number per plant; NS: Seeds number per pod; SW, 1000 seeds weight.
Genotype performance averaged over two environments
The average comparison for all genotypes (parents and offspring) is shown in Table 5. PH ranged from 230.44 to 280.59cm, with parent P4 recording the greatest mean value and P2 recording the lowest. DTFF in P7 and P2, respectively, varied from 45.17 to 54.17 days, with P5 having the most NN (7.38) and P2 having the fewest (4.15). The FSW ranged from 670.5g (P2) to 1127.22g (P1), with P7 (121.94) and P2 (50.82) having the most and least NF, respectively. The NS varied from 20.08 to 28.76. P5 had the most NS, while P2 had the least. The SW ranged from 30.33 to 34.18g. The maximum SW was obtained in parent P1, while the lowest SW was reported in P5. Plant heights (PH) varied between 219.58 and 297.85cm among the crosses, with hybrid P3 × P7 having the highest mean value and hybrid P2 × P9 having the lowest. The hybrid P6 × P9 had the most NN (9.68), while P2 × P9 had the least (4.89). DTFF ranged from 43 to 56.33 days in P7 × P9 and P2 × P5, respectively. FSW ranged from 584.31g (P2 × P9) to 1786.48g (P4 × P6), with the hybrid P7 × P9 producing the most NF (217.15), whereas P4 × P7 had the least (75.45). The NS ranged from 15.08 to 27.30. The cross P4 × P9 had the most NS, while P1 × P2 and P2 × P8 contained the fewest. The SW varied from 26.20 to 35.05g. The hybrid P2 × P8 had the highest SW (35.05g), while hybrid P1 × P5 had the lowest SW (26.20g).
The paternal mean for PH, NN, FSW and NF is all higher than the parental mean. The parental mean has a few days more tillers at the first flowering than the hybrid means. Similarly, the parental mean had more NF and a higher SW than the hybrid means. The lower SW of the hybrid means than the parental mean is favourable since it allows for smaller seed sizes. FSW (518.40) had the highest Standard Deviation (SD), with a Standard Error (SE) of ±31.55, whereas SW (SD, 4.23; SE, ± 0.26) had the lowest (Table 5). The Standard Error (SE) measures the consistency of average values; lower SE values imply that the sample mean is a more accurate representation of the underlying population mean. Parent P7 had the greatest NF (121.94), followed by P9 (106.78) and P6 (97.54). However, the parents P3, P4 and P5 had a lower value than the other parents at SW, indicating that parents favoured smaller seed sizes. The findings revealed that environmental influences controlled the expression of kenaf genetic traits. The mean of hybrids is higher than the parental mean for PH, NN, FSW and NF. Hybrids have more pods than their parents, but they have fewer DTFF than their parents, indicating that potentially combines with a photo-insensitive type with high seed yields. The mean hybrid of SW, on the other hand, had a lower mean value than the parental mean, showing that smaller seed-size hybrids were preferred over parents, but that when the NN was greater than the parental mean, the pod production /plant increased. The cross combinations P7 × P9, P4 × P6, P6 × P9 and P1 × P7, produced the most NF (217.15, 172.30, 170.63 and 162.83, respectively), far exceeding any of the parents, demonstrating the presence of transgressive segregation in the cross.
Table 5:The average performance of nine parents and their hybrids in Kenaf was calculated for seven seed yield traits.

Legend:Std Dev: Stand deviation; EMS: Error means square; LSD: Least significant difference; PH: Plant height (cm); DTFF: Days to 1st flowering (days); NN: Nodes number; FSW: Fresh stem weight with leaves and pod (g); NF: Pods number per plant; NS: Seeds number per pod; SW: 1000 seeds weight (g).
Estimation of heterosis effect of kenaf hybrids for seed yield traits
High positive heterosis values are preferable for yield production traits, whereas negative values are favoured for SW. The estimates of heterosis, relative to mid-parental values (Table 6) reflected desirable effects with significantly positive in 14 out of 36 crosses for NN (32.911 to 109.271), 18 crosses for FSW (32.751 to 91.430) and 20 crosses for NF (49.225 to 108.719). For SW, 29 crosses out of 36 had negative heterosis (in the desired direction). This indicates that they had smaller-sized seeds. Furthermore, the crosses P2 × P3 and P2 × P4 for NN, and the crosses P2 × P3 and P5 × P8 for FSW traits had the highest mid-parent heterosis. Due to the existence of overdominance, crosses P1 × P4, P2 × P8 and P7 × P9 were chosen for NF for seed yield. Negative heterosis estimates for SW are desirable, where small values for this trait indicate good smaller seed size, therefore, negative magnitude implies high heterosis. Cross P1 × P5 with the lowest negative heterosis (-23.338) for SW would produce well where smaller seed size kenaf accessions perform well. Overdominance for heterobeltiosis was seen in the most outstanding crosses P1 × P4, P1 × P8, P2 × P8, P6 × P8, P6 × P9 and P7 × P9 expressed highly significant positive heterosis over the better parent for NF. Due to the presence of over dominance, as indicated by the potency ratio, was found in the promising crosses P2 × P3, P2 × P4 and P3 × P4 for NN, crosses P2 × P3, P2 × P7, P3 × P5, P4 × P5, P4× P6, P4 × P9, P5 × P8, P6 × P8, P7 × P8 and P8× P9 for FSW. In terms of seed weight, negative heterosis is preferable. Meanwhile, in terms of percentage F1 heterosis above high parent in SW, crosses P1 × P5 and P5 × P8 had the lowest negative heterosis values, respectively.
Table 6:Heterosis percentage relative to mid-parent (MPH) and better parent (BPH) for 7 seed yield traits for 36 F1 hybrids.

Legend:PH, Plant height (cm); DTFF, Days to 1st flowering (days); NN, Nodes number; FSW, Fresh stem weight with leaves and pod (g); NF, Pods number per plant; NS, Seeds number per pod; SW, 1000 seeds weight (g).
Table 6 shows estimates of mid-parent and better parent heterosis for seed yield traits indicated by hybrids evaluated based on pooled data from the two environments. Liu [38] reported heterosis in yield characteristics based on the mid-parent and better parent. Heterosis estimates based on mid-parental values were generally high, with stalk dry weight and bast percentage ranging from 10% to 55% [55]. The strongest positive estimations of mid-parent and better parent heterosis for the traits examined were derived from P4 × P6 based on the combined data of the two environments (108.719% and 76.638%, respectively, for the NF). Hybrids P4 × P6 and P6 × P9 showed the greatest mid-parent and better parent heterosis for three of the seven phenotypic traits measured, including NN, FSW and NF, based on the combined data from the two environments. Furthermore, the hybrids P2 × P3 and P3 × P4 were chosen as the best combiners for NN, FSW and NF, whereas hybrids P6 × P8 and P7 × P9 for FSW and NF showed the greatest mid-parent and better parent heterosis. Higher heterosis values compared to the better parent and the mid-parent suggested the absence of epistasis and the frequency of partial or total dominance of genes for seed yield. Crosses that produce superior transgressive segregants with higher seed production could be found by looking at the % F1 heterosis over the high parent.
Combining ability analysis of kenaf hybrids for seed yield traits Combining ability effects by Griffing’s Method
Table 7:Mean squares in ANOVA of GCA and SCA across two environments for seven seed yield traits from a 9 × 9 diallel cross (Griffing’s Method 2).

Legend:*Significant at P < 0.05 level; **highly significant at P≤0.01 level. PH, Plant height; DTFF, Days to 1st flowering; NN, Nodes number; FSW, Fresh stem weight with leaves and pod; NF, Pods number per plant; NS, Seeds number per pod; SW, 1000 seeds weight.
For all analysed traits in the combined data (Table 7) for both environments, ANOVA for combining ability was performed using Griffing’s [44] technique. GCA is well understood to be a function of additive gene effects and additive sections of epistatic variance. In contrast, SCA is a function of nonadditive gene effects and the remaining epistatic variance [56]. GCA effects were highly significant (p ≤ 0.01) in the agronomic performance of the parental inbred lines and were evident for all traits measured except DTFF showed significant (p ≤ 0.05). The parental inbred lines’ SCA effects were highly significant (p ≤ 0.01) for all traits measured except PH, indicating that additive gene effects mainly controlled for variations between those traits. In contrast, PH variations were controlled by both additive and nonadditive gene effects. The interaction of GCA with environmental effects was highly significant (p ≤ 0.01) for all traits except PH, indicating that the inbred lines’ GCA was influenced by the environmental conditions surrounding the hybrids. The SCA by environment interaction effects, on the other hand, were highly significant (p ≤ 0.01) for all traits except PH and DTFF, indicating that environments altered the effects of specific hybrid combinations on the expression of these traits. Thus, the effects of non-additive genes in the traits interacted more with the environment. The mean squares of GCA were greater than the mean squares of SCA for all traits except NN and FSW, showing that additive gene action predominated in our study across the two environments (Table 7). Furthermore, the baker ratio for the examined traits was altered from 0.52 to 0.94, indicating that the additive effect plays a larger role in determining the traits.
The combining ability analysis revealed significant GCA for all traits and significant SCA for all traits except PH from the combined data of the two environments. The results indicating variations for those traits were controlled mainly by additive gene effects, while both additive and nonadditive gene effects-controlled variations for PH. For seed yield traits, the predominance of additive over nonadditive gene effects was rather prevalent. Jianmin et al. [57] and Heliyanto et al. [58] discovered similar results in kenaf. The analysed traits (except NN and FSW) had large mean square GCA values, indicating that the parental materials studied had a lot of genetic variability. The examined parameters (excluding PH) showed a highly significant effect on GCA by environment interaction, indicating that environmental variation influenced additive gene action. Furthermore, environments greatly influenced how these characters changed [59]. By combining ability investigations, Mostofa et al. [60] and Gong et al. [61] found similar results in Hibiscus cannabinus, Sobhan [62] in Hibiscus sabdariffa and Khatun [63] in Corchorus capsularis. The mean squares of GCA were larger than the mean squares of SCA for all traits except NN and FSW, indicating that additive gene action effects played a large role in their inheritance [17]. Although additive gene effects contributed the most to the variability in most traits, dominance and over-dominance significantly influenced the genetic system that controls seed yield traits. Because of the strong additive gene effects, this conclusion usually favours the breeding selection technique [64]. DTFF and SW were found to indicate the prevalence of additive gene effects in the development of the features by Mostofa et al. [65]. DTFF and PH were controlled by one dominant gene pair, while raw fibre yield was responsible by three [66]. Pace et al. [14] discovered additive gene action to be more important for yield components such as PH, fresh and dry bark weight and usable stick in kenaf. Baker ratios [44] greater than 0.80 indicated that additive gene effects played a larger role in the genetic control of PH, DTFF, NS and SW (Table 7). Additive influences contributed more to genetic variation, according to the Baker ratio. Additive variances are linked to heredity and react well to selection for improving desired features. Anwar et al. [67] and Hassan et al. [68], both found similar findings in wheat research.
General and specific combining ability of kenaf genotypes for seed yield traits
Plant height (PH) should have a favourable GCA effect in a taller stature combination; the parent P7 had the highest PH (12.89), followed by P4 (9.11) and P3 (9.01), indicating that they were good general combiners that might be utilized in future breeding efforts. Parent P7 had the most favourable negative significant (P ≤ 0.01) GCA effect, with values of -3.73 for DTFF, whereas parent P2 had the highest positively significant (P ≤ 0.01) GCA effect, with values of 2.33. (Table 8). In terms of FSW, parent P4 had the greatest positively significant (P ≤ 0.01) GCA effect (163.36). Seed yield, an important factor that determines the NF, was favourable and significantly higher (p ≤ 0.01) than a good general combiner for the parent P6 (10.22), P7 (15.03) and P9 (10.97) while parent P6 (1.02) and P9 (1.45) having highly significant (p ≤ 0.01) positive GCA values considered as good specific combiners for the NS trait at the combined environment. The parent P2 showed the lowest negative and highly significant (p ≤ 0.01) GCA effect, with values of -16.83, -153.27, -21.18 and -4.20 for PH, FSW, NF and NS, respectively. A negative GCA effect is desired for SW to give a smaller seed size combination. The parent P5 had the most desirable SW (-1.50) and the most positive (1.66) for NS, both of which are highly significant (p ≤ 0.01), indicating that they were good general combiners for lower seed sizes and the highest NS in future breeding programs.
Table 8:Estimates of general combining ability effects for seven seed yield traits under tropical conditions.

Legend:*Significant at P < 0.05 level; **highly significant at p≤0.01 level; P1, ML5; P2, ML9; P3, ML36-10; P4, ML36-24;P5, ML36-25; P6, ML36-27; P7, BJRI Kenaf 4; P8, ML Ring 4P2; P9, ML36-21(2); LSD, Least significant difference; GI,General combined ability effects; PH, Plant height; DTFF, Days to 1st flowering; NN, Nodes number; FSW, Fresh stem weight with leaves and pod; NF, Pods number per plant; NS, Seeds number per pod; SW, 1000 seeds weight.
The research demonstrated that parents’ GCA effects were linked to their crossings’ SCA impacts, which had the highest significant positive intensity [18]. Additive genetic variance is a major contributor to the GCA component. As a result, each parent’s GCA variation has a major impact on the parents’ decisions. A good general combiner is a parent with a higher positive significant GCA effect [69]. In this study, GCA’s high value for the traits of interest was distributed across genotypes, showing that none of the genotypes used had the optimal combination of GCA values for the several phenotypic traits of interest. Parent P4 (ML36-24) was the best parental line in terms of PH and FSW content, showing the accumulation of favourable additive genes for these traits in the hybrids, conversely, parent P1 (ML5) was the best general combiner for DTFF and it was contributed positively to the hybrid for these traits. The main purpose of this breeding program is to create highyielding hybrids that produce a large volume of seed as compared to existing cultivars. The effects of SCA on hybrids in various contexts in pooled environments are shown in Table 9. SCA effects were detected in all 36 hybrids studied, with positive (desired direction) SCA influences on PH in 20 of them. The cross P5 × P8 (23.63), which was regarded as a good specific combiner for tallness, produced the hybrids with significant (P < 0.05) and advantageous SCA effects for PH, followed by P7 × P9 (19.91). The SCA effects ranged from -3.33 to 4.09 for DTFF. Hybrids P2 × P8, P4 × P6 and P7 × P9 had the most favourable negative significant (P < 0.05) GCA effect, with values of -3.10, -3.33 and -2.68 for DTFF, respectively, whereas hybrids P2 × P5, P4 × P8 and P1 × P9 had the most positively significant (P ≤ 0.01) GCA effect, with values of 4.09, 2.87 and 2.75 respectively. Seven of the 22 positive SCA impacts were found to be positively significant (P ≤ 0.01 or 0.05), with values ranging from -1.94 to 2.52 for a given NN. Twelve of the 23 positive SCA effects were crossed to yield positive and significant (P ≤ 0.01 or 0.05) SCA effects, indicating that they are good specific combiners for FSW. Six crosses viz. P7 × P9 (458.10), P2 × P3 (420.39), P4 × P6 (418.28), P5 × P8 (414.95), P4 × P5 (293.60) and P6 × P9 (273.71) were the best specific combiners for FSW trait, with highly significant (P ≤ 0.01) positive SCA effects.
Table 9:Estimates of specific combining ability effects for seven seed yield traits under tropical conditions.

Legend:*Significant at P <0.05 level; **highly significant at P≤0.01 level; P1, ML5; P2, ML9; P3, ML36-10; P4, ML36-24; P5, ML36-25; P6, ML36-27; P7, BJRI Kenaf4; P8, MLRing4P2; P9, ML36-21(2); LSD, Least significant difference; SIJ, Specific combining ability effects; PH, Plant height; DTFF, Days to 1st flowering; NN, Nodes number; FSW, Fresh stem weight with leaves and pod; NF, Pods number per plant; NS, Seeds number per pod; SW, 1000 seeds weight.
The SCA effects on the NF ranged from -47.21 to 72.24. The cross combinations produced 24 positive SCA effects, with 13 of them having significant (P≤0.01 or 0.05) positive SCA values for the NF. The crosses P7 × P9 (72.24), P4 × P6 (54.45), P1 × P4 (42.85), P2 × P8 (37.97), P6 × P9 (30.53) and P5 × P7 (29.24) all had highly significant (P ≤ 0.01) positive SCA effects, but P1 × P5 (-26.55) and P4 × P7 (-47.21) had highly significant negative SCA effects. SCA impacts ranged from -4.29 to 4.59 for the NS. Sixteen of the cross combinations had positive SCA effects, with three (P2 × P6, P5 × P7 and P2 × P7) having highly significant (P ≤ 0.01) positive SCA values and five (P1 × P3, P1 × P8, P8 × P9, P4 × P8 and P1 × P4) having significant (P< 0.05) positive SCA values considered as good specific combiners for the NS trait. For the trait SW, the SCA effects ranged from -4.31 to 2.52. P1 × P5, P4 × P7, P7 × P8, P3 × P8, P5 × P8, P1 × P6, P2 × P7, P3 × P9 and P6 × P9 all exhibited highly significant (p ≤ 0.01) negative SCA effects, while P3 × P4, P2 × P6, P1 × P9 and P5 × P6 all had significant (p ≤ 0.05) negative SCA effects, indicating that these hybrids had good specific combining capacity for smaller seed size. In general, crosses with high × low general combiners for yield components outperform others. According to an investigation of combining ability impacts, high specific combiners involved high × high, high × low, high × average, average × average, average × low, and low × low combining parents. In crosses with high × low and low × low general combiners, Jinks [70] described severe SCA effects caused by over-dominance and epistasis. Mutual cancellation of heterosis components, particularly dominance and its interaction, induced negative SCA effects in crosses involving high × low general combiners for yield components [71]. High performance is produced by crossing two parents with low general combiners, which is attributed to complementary gene action [72].
As demonstrated in Table 9, SCA effects were shown to be significant for most yield traits. The hybrids P5 × P8 and P7 × P9 is a good combiner for PH and FSW, whereas P7 × P9, P4 × P6 and P6 × P9 are good for FSW and NF. DTFF for the hybrids P2 × P8, P4 × P6 and P7 × P9 were selected as unique combiners that were also good combiners for NF. It has been demonstrated that hybrids with a later maturation time produce more pods. For NF and NS, the hybrids P1 × P4 and P5 × P7 were selected as good specific combiners. For another required trait SW, the hybrids P1 × P5, P3 × P8, P4 × P7 and P7 × P8 were chosen as good specific combining capacity for smaller seed size. Complementing gene effects could explain the strong SCA effects of these crosses. Crossings of P1 (ML5) × P4 (ML36- 24), P2 (ML9) × P8 (MLRing4P2), P3 (ML36-10) × P8 (MLRing4P2), P4 (ML36-24) × P6 (ML36-27), P5 (ML36-25) × P7 (BJRI Kenaf4), P6 (ML36-27) × P9 (ML36-21(2)) and P7 (BJRI Kenaf4) × P9 (ML36- 21(2)) showed promising heterotic responses for kenaf seed yield and could be beneficial in future breeding program. Hybrid vigor can be induced by dominant, over-dominant, or epistatic gene action in any combination of parents, according to Moll and Stuber [73]. In this study, both additive and nonadditive genetic components influenced seed yield traits, with nonadditive gene action dominating most of the phenotypic traits.
Hayman’s method of analysis of variance and genetic component estimate Hayman’s analysis of variance
After Jones’s [48] modification, Hayman’s ANOVA results for all tested traits in mixed environments were identical for additive effect (a), dominance effect (b) and error variance (Table 10). In combined environments, additive genetic effects (a) were significant for PH, DTFF and NS, implying that both additive and dominance gene actions are involved in the inheritance of these traits. Most of the traits had a much larger ‘a’ to ‘b’, indicating that additive effects were more important. For the NN and NS, a highly significant mean square was detected due to the interaction of bl with the environment, indicating that the mean deviation of the F1’s from their mid-parental values for the two traits was most likely influenced by differences between soil types and climate conditions at the combined environment. On the other hand, the other traits had insignificant environment interaction mean squares with bl, indicating that these components were stable in combined environments. In addition, all traits had insignificant mean squares of b2 with environment interaction, indicating that b2 and variety heterosis components were consistent across the two environments. All traits had insignificant mean squares of b3 with environment interaction, demonstrating that b3 and specific heterosis components were stable across the two environments.
Table 10:Mean squares of Hayman and Jinks method for 7 seed yield traits of nine parents and their crosses over two environments.

Legend:**Significant at P < 0.05 level; **highly significant at P≤0.01 level; a, additive variation; b, the average square of domination; b1, average dominance; b2, symmetrical distribution of the alleles determining dominance; b3, residual dominance; E, Environment; DF, Degrees of freedom; PH, Plant height; DTFF, Days to first flowering; NN, Nodes number; FSW, Fresh stem weight with leaves and pod; NF, Pods number per plant; NS, Seeds number per pod; SW, 1000 seeds weight.
In combined environments, additive genetic effects (a) were significantly larger than dominance genetic effects (b) for all traits except NN and FSW, suggesting the presence of both additive and dominant gene actions in the inheritance of these features. The findings agree with those of Akter [74]. Xu [75] discovered a larger magnitude of additive genetic variance than dominance in the inheritance of Hibiscus cannabinus. Significant mean square due to bl’s interaction with the environment was detected for NN and seed number per pod, indicating that differences in soil types and climate conditions in the combined environment influenced the F1’s mean deviation from their mid-parental values for the two traits. Most of the traits, according to Echekwu [76], should lead to genetic improvement in terms of PH, NS, SW and seed yield. All phenotypic traits were influenced by both additive and dominant (nonadditive) gene actions, according to Hayman’s ANOVA and components of variation in gene action. It also revealed that positive and negative alleles were not equally common in the parents and asymmetrical gene distribution at the loci, indicating that all these traits were dominant. However, the value of additive (D) and dominance (H1) of SQR (H1/D) showed zero indicating the presence of no dominance effects for the NN, FSW and NF, while there were dominance effects for the other traits showed 1.71 to 4.04. In a combining ability investigation in kenaf, Mukewar et al. [77] discovered that additive gene action predominated for NS and NF.
Components of variation and genetic parameters
In most traits, the Hayman [43] genetic components analysis differed little from the analyses for additive (D), dominance (H1) and environmental error (Table 11). To separate the components of genetic variance and their ratios for all analysed traits, the data were submitted to Hayman’s [46] diallel analysis. Except for NS and SW, the additive genetic component (D) was negative for all investigated traits. For the five examined traits out of 7, including the NF, positive values of dominance (H1 and H2) were found, demonstrating the relevance of nonadditive components in the inheritance of these traits. For six traits out of seven, the magnitude of dominance (H1 and H2) was greater than the additive component (D), indicating overdominance. For four out of seven traits, H1 was greater than H2, indicating that the frequency of gene distribution in the parents was asymmetrical, indicating dominance for all these traits. These findings matched with Akter [74], who observed that positive and negative alleles were not equal in the parents for all features (DTFF, NN, NF and NS) in toss jute. The F value was negative for all traits suggesting the presence of dominant recessive genes in the parents influencing these features [20].
The frequency of dominant and recessive alleles cannot be assumed to be equal because the balance of positive and negative alleles (UV parameter) is less than 0.25 for 4 out of the 7 traits and the b2 components are nonsignificant. Furthermore, the importance of nonadditive gene action in influencing the traits was demonstrated because h2B and h2N for the examined traits varied from 0 to 77% and 0 to 50.93%, respectively. The only three traits that showed high heritability (≥ 50%) are NF, NS and SW. FSW showed a moderate heritability of 38.49%. In the combined environment, NS exhibited the highest narrow-sense heredity of 50.93%, followed by DTFF (34.40%) and SW (32.84%) which had moderate heritability. On the other hand, other traits had poor narrow-sense heritability, indicating that nonadditive gene effects predominated in trait inheritance. The average degree of dominance at overall loci, as estimated by the (H1/D)0.5 ratio, was found to be greater than one for all traits except NN, FSW and NF, indicating the role of overdominance gene effects in the inheritance of most studied traits, as shown by the Vr-Wr graph. Patil [69] found a higher proportion of additive genetic components in kenaf in terms of days to flowering, PH and fibre length. The dominant impact is important for the NN, FSW and NF, according to the results of the ratio of dominant to recessive alleles (h2/H1) (Table 11).
Table 11:Components of genetic variance [48] for all nine parents and their crosses over two environments for all traits studied.

Legend:*Significant at p≤0.05 level; **highly significant at p≤0.01 level; Wr + Vr, dominant effect; D, additive variance; H1 - H2, dominance variance; F, the relative frequency of dominant and recessive alleles in the parent; UV, the balance of positive and negative alleles; h2B-h2N, the heritability of broad and narrow senses, respectively; Sqr (H1/D), the mean degree of dominance; h2/H1, ratio dominant to recessive alleles; PH, Plant height; DTFF, Days to first flowering; NN, Nodes number; FSW, Fresh stem weight with leaves and pod; NF, Pods number per plant; NS, Seeds number per pod; SW, 1000 seeds weight.
In the broad sense, high heritability was found for NF, NS and SW, showing that additive gene action significantly influences the inheritance of these traits. Heritability in the narrow sense as assessed from genetic components appeared to be moderate too low for most of the traits. The high narrow-sense heritability value of NS was indicative of their early generation selection success for breeding improvement. DTFF and SW had moderate narrow-sense heritability. Khatun [63] found that the narrow-sense heritability in F1 was moderate for the seeds number per fruit (47 percent) and SW (37 percent), yet low for the number of fruits /plant (15 percent) in white jute. Low additive effects and high dominant gene action, according to Falconer [52], caused reduced narrow-sense heritability. Kenaf seed yield can be improved through pedigree selection based on PH and DTFF.
Vr -Wr regression analysis
Table 12:Validity of Hayman and Jinks model for seven seed yield traits in a 9×9 diallel cross.

Legend:*Significant at P<0.05 level; **highly significant at P≤0.01 level, t2, Test of validity of the hypothesis; PH, Plant height; DTFF, Days to 1st flowering; NN, Nodes number; FSW, Fresh stem weight with leaves and pod; NF, Pods number per plant; NS, Seeds number per pod; SW, 1000 seeds weight.
Table 12 and Supplementary exhibit a graphical study of Parent-Off spring Covariance (Wr) and Array Variance (Vr) for the traits and their related statistics. The regression analysis showed that the NS fitted with a simple additive dominance genetic model (Ho: b>0 and Ho: b = 1) involving the nine parents studied. They are considerably different from zero but not from unity, showing no non-allelic interaction for these traits’ inheritance. However, PH, DTFF and SW showed highly significant ‘b’ values in F1. It, therefore, did not follow the models clearly, which differed significantly both from zero and unity, indicating the presence of an interallelic interaction in the inheritance of these traits. The remaining three traits in combined environments were considered to follow epistatic or non-allelic gene interaction as the regression coefficient significantly differed from unity but not from zero involving all nine parents studied.
The regression analysis revealed that the NS differs considerably from zero but not from unity, indicating that the trait is not inherited by non-allelic interactions. Plant height (PH), DTFF and SW showed significantly different both from zero and unity, indicating the presence of an inter-allelic interaction in the inheritance of these traits. The remaining three traits in combined environments were considered to follow epistatic or non-allelic gene interaction as the regression coefficient significantly differed from unity but not from zero involving all nine parents studied. Similar results were obtained fiber plant to kenaf. The regression coefficient b was not significantly different from zero. The deviation from unity for all seven phenotypic traits indicated the validity of the hypothesis proposed by Hayman [72]. The nonsignificant t2 values satisfied the uniformity of covariance and variance (Wr-Vr) and thus supported the validation of the assumptions of Hayman [46] for the trait. For NN, FSW, NF, NS and SW, the regression line cuts the Wr axis below the point of origin, indicating a clear case of over-dominance. These findings match those of Vr-Wr regression analysis by Akter [74] for Corchorus olitorius and Khatun [63] for Corchorus capsularis.
Average degree of dominance
The deviation from the origin of the point where the regression line cuts the Wr axis, which is one of the information points acquired from the graph, measures the average level of dominance. Given this, the intercept of the regression line on the covariance axis is below the origin of NN, FSW, NF, NS and SW, implying some expression of over-dominance of factors for these traits. However, for PH and DTFF, the regression line cut the Wr axis above the point of origin, indicating partial dominance. The estimated values of potency ratio illustrated that in most F1 crosses the estimated potency ratios had a positive nature for the character’s PH, DTFF, NN, FSW, NF and NS content. These findings generally showed different levels of dominance, from partial to overdominance, which contributed to the inheritance of these traits. In contrast, most F1 hybrids had estimated potency ratios that were negative for the SW trait. Negative values of the potency ratio revealed the presence of partial- to under recursiveness in varying degrees. Since the predicted potency ratios were found to be in the range of 1.38 to 79.86, the results for FSW indicated that over-dominance effects were reflected in the performances of 34 out of 36 F1 hybrids. In terms of the NF, 35 out of 36 F1 hybrids that were analysed exhibited potency ratios that were positive and varied from 0.18 to 44.41. These findings showed that the inheritance of this trait involved partial overdominance. Twenty-nine F1 hybrids out of the evaluated thirty-six F1 crosses showed a clear over-dominance since the estimated potency ratios ranged from 1.26 to 44.41. The partial dominance of the seven F1 hybrids ranged from 0.18 to 0.96. Using potency ratio investigations, Sheriff [78] found similar results in Hibiscus sabdariffa and Solieman et al. [27] in Solanum lycopersicum.
Parental inheritance of dominant and recessive genes
The distribution of dominant and recessive genes among the parents is revealed by the array of points along the regression line. The parents with the most dominant genes are closest to the origin, whereas the parents with the most recessive genes are the furthest away. It is noticed that in supplementary, the parent P4 (ML36-24) falls near the point of origin, in PH, as well as in supplementary, the parent P1 (ML5) also falls near the point of origin, in DTFF and FSW. Results demonstrated the presence of dominant genes for the above-mentioned traits in the parents P6 (ML36-27) and P7 (BJRI Kenaf4). In contrast, the parents P2 (ML9) and P8 (BJRI kenaf4) are the furthest from the origin in most traits, implying that they have the most recessive genes for these traits.
Potency ratio
In Table 13, the estimated potency ratios of 36 F1 hybrids for all examined traits are shown. Regarding PH, 24 crosses had overdominance and 12 crosses had partial dominance. Over-dominance was seen in 19 crosses for DTFF, while partial dominance was seen in 13 crosses. In two crosses each, complete and no dominance was observed. Concerning the NN, 29 crosses showed overdominance, six crosses showed partial dominance and one cross showed no dominance. Two crosses displayed partial dominance for FSW, whereas 34 crosses displayed over-dominance. For the NF, seven crosses revealed partial dominance. In terms of the NS, overdominance was found in 22 crosses, whereas partial dominance was seen in 14 crosses. Additionally, 24 crosses for the SW exhibited over-dominance and 12 crosses showed partial dominance.
Table 13:The estimated potency ratios of 36 F1 hybrids for all examined traits are shown.

Legend:PH, Plant height; DTFF, Days to 1st flowering; NN, Nodes number; FSW, Fresh stem weight with leaves and pod; NF, Pods number per plant; NS, Seeds number per pod; SW, 1000 seeds weight.
Correlation among seed yield traits
As demonstrated in Table 14, simple Pearson phenotypic correlation coefficients for seed yield traits were computed using proc CORR-SAS software version 9.4. Most traits do not exist in isolation; rather, they establish a complex connection with one another that ultimately determines the yield. The R-value of a correlation coefficient conveys the idea of a relationship between two unique traits by making a connection. Characters’ correlation coefficients ranged from 0.01 to 0.99, indicating that the phenotypic variation is of greater magnitude. A negative linear relationship, no linear relationship and a perfect positive linear relationship are shown by R-values of 1, 0 and +1, respectively. According to Field [79], values ranging from 0 to -0.3, -0.3 to -0.5 and -0.5 to -1 indicate low, moderate and strong negative linear relationships, respectively, while values ranging from 0 to 0.3, 0.3 to 0.5 and 0.5 to 1 indicate low, moderate and strong positive linear relationships, respectively. PH and FSW all showed strong to moderately positive phenotypic relationships with three other parameters including NF. This was the most significant correlation yet observed for a single trait. For combined environments, a highly significant negative phenotypic correlation was seen in DTFF, NS and SW with NF. The fact that these traits had a negative correlation with yield suggested that they would not improve the trait. On the other hand, seed yield trait NF exhibited strong to moderately phenotypic correlations with highly significant for three other traits. PH and FSW, all showed significant positive correlations with NF, while DTFF showed significant negative correlations. There were nonsignificant correlations between DTFF and NS as well as predicted commercial yields. In contrast, there were significant correlations with all other traits in the case of a combined environment. Between the types, there was no discernible pattern or similarity. This suggested that progenies within each type may have a variety of strategies for expressing a certain phenotype. When significant and strong correlations will aid in selecting traits and traits that influence commercial yield traits, making future selection easier and more reliable.
Table 14:Combined analysis for phenotypic correlation coefficient for the different pairs of studied traits of kenaf parents and their crosses.

Legend:*Significant at p≤0.05 level; **highly significant at p≤0.01 level. PH, Plant height; DTFF, Days to 1st flowering; NN, Nodes number; FSW, Fresh stem weight with leaves and pod; NF, Pods number per plant; NS, Seeds number per pod; SW, 1000 seeds weight.
PH, NN and FSW/NF all demonstrated a positive and highly significant correlation with FSW and NF. Early flowering plants have a shorter life cycle and produce more pods than late flowering plants. Several other significant correlations between the various traits investigated in this research were also discovered. In the future, these correlations could be used to speed up the selection of superior progenies without quantifying all features. The correlation analysis allows each trait’s performance to be modelled with other major correlated traits, saving time and money in future investigations [80].
Conclusion
The seed yield traits evaluated in this study were genetically controlled by additive and nonadditive variants. The strongest positive estimations of mid-parent and better-parent heterosis for the qualities examined indicate the accumulation of favorable genes inherited from their parental mutant lines. Among the hybrids produced, P1 × P4, P2 × P8, P6 × P8, P6 × P9 and P7 × P9 had higher seed yield traits indicated by hybrids evaluated based on pooled data from the two environments. From the combined data of the two environments, the combining ability analysis revealed significant GCA for all traits and considerably highly significant SCA for all traits except plant height. Variations in those parameters were mostly governed by additive gene effects. In contrast, plant height was influenced by both additive and nonadditive gene effects, according to the findings. GCA effects were higher than SCA effects, except for node number, and fresh stem weight with leaves and pod, as demonstrated by mean squares, showing that additive gene action predominates for these traits. In conclusion, the parental lines P6(10.22), P7(15.03) and P9(10.97) were outstanding general combiners for seed yield traits. In contrast, the hybrids P1 (ML5) ×P4 (ML36-24), P2 (ML9) ×P8(MLRing4P2), P3(ML36-10)× P8(MLRing4P2), P4(ML36-24)× P6(ML36-27), P5(ML36-25) ×P7(BJRI Kenaf4), P6(ML36-27) ×P9(ML36-21(2)), and P7(BJRI Kenaf4)×P9(ML36-21(2)) showed promising heterotic responses and could be beneficial in future breeding program. Plant height and days to first flowering indicated a clear case of partial dominance in the variance and covariance graphs. For most of the phenotypes evaluated, parents P2 (ML9) and P8 (BJRI kenaf4) had the most recessive genes, while parents P6 (ML36-27) and (BJRI Kenaf4) had the most dominant alleles. The Baker ratio showed that selection-based approaches that are highly responsive to additive effects enhance genetic improvement in the seed output of hybridization-based breeding programs. Because the seed yield traits studied have a high to moderate broad-sense heritability, a high baker ratio and moderate to low narrow-sense heritability, it was determined that selection should be done in advanced generations after homozygosity and genetically fixed.
Declaration
Ethical approval and consent to participate
This article does not contain any studies with human participants or animals performed by any of the authors.
Availability of data and material
All data generated or analyzed during this study are included in this manuscript. Additionally, the graphical study of parentoffspring covariance (Wr) and array variance (Vr) for the traits and their related statistics is represented as a supplementary file.
Competing interests
The authors declare that they have no conflict of interest in this paper.
Funding
Bangladesh Agricultural Research Council (BARC- Project of NATP Phase-II), The People’s Republic of Bangladesh and Universiti Putra Malaysia (research grant: vote number 6282507).
Author’s Contributions
Conceptualization, Md Al-Mamun and Mohd Y. Rafii; Data curation, Md Al-Mamun; Formal analysis, Md Al-Mamun; Funding acquisition, Md Al-Mamun and Mohd Y. Rafii; Investigation, Mohd Y. Rafii and Zaiton Ahmad; Supervision, Mohd Y. Rafii; Writing – original draft, Md Al-Mamun; Writing – review & editing, Md Mahmudul Hasan Khan and Yusuff Oladosu. All authors have read and agreed to the published version of the manuscript.
Acknowledgment
The authors are grateful to the Bangladesh Agriculture Research Council (BARC) and University Putra Malaysia (UPM) for permitting them to perform this study. The Bangladesh Jute Research Institute (BJRI) and the Ministry of Agriculture of the People’s Republic of Bangladesh are also to be thanked for referring the main author to UPM for a Ph.D. program.
Supplementary materials
Parent-off spring Covariance (Wr) and Array Variance (Vr) for the traits and their related statistics.
References
- Akinrotimi CA, Okocha PI (2018) Evaluations of genetic divergence in Kenaf (Hibiscus cannabinus L.) genotypes using agro-morphological characteristics. Journal of Plant Sciences and Agricultural Research 2(12): 2167-0412.
- Ayadi R, Hanana M, Mzid R, Hamrouni L, Khouja ML et al. (2017) Hibiscus cannabinus L. -kenaf: A review paper. Journal of Natural Fibers 14(4): 466-484.
- Di Candilo M, Faeti (1990) Kenaf: Characteristics, importance and indications of techniques.
- Wong YH, Tan WY, Tan CP, Long K, Nyam KL (2014) Cytotoxic activity of kenaf (Hibiscus cannabinus L.) seed extract and oil against human cancer cell lines. Asian Pacific Journal Of Tropical Biomedicine 4(Suppl 1): S510-S515.
- Coetzee R, Labuschagne MT, Hugo A (2008) Fatty acid and oil variation in seed from kenaf (Hibiscus cannabinus L.). Industrial Crops And Products 27(1): 104-109.
- Monti A, Efthimia A (2013) Kenaf: A multi-purpose crop for several industrial applications. New insights from the Biokenaf Project. Green Energy and Technology (GREEN).
- Mohamed A, Bhardwaj H, Hamama A, Webber C, (1995) Chemical composition of kenaf (Hibiscus cannabinus L.) seed oil. Ind Crop Prod 4(3): 157-165.
- Manga JN, Ondobo ML, Djoko JC, Djocgoue PF, Pierre OE (2018) Heterosis, heterobeltiosis, narrow-sense and broad-sense heritabilities for Phytophthora megakarya tolerance in two populations of Theobroma cacao L. African Journal of Biotechnology 17(14): 495-504.
- Smita S (2020) Diallel studies and heritability estimates using Hayman's approach in Ocimum spp. Acta Scientific Agriculture 4(11): 16-22.
- Thorat IH, Gawande VL (2021) Selection of elite parents and crosses for seed yield and its components using combining ability analysis over the three environments in safflower (Carthamus tinctorious L.). Indian Journal of Genetics and Plant Breeding 81(1): 139-143.
- Gaurav N, Sivasankari S, Kiran GS, Ninawe A, Selvin J (2017) Utilization of bioresources for sustainable biofuels: A review. Renewable and Sustainable Energy Reviews 73: 205-214.
- Santha S, Vaithilingam R, Karthikeyan A, Jayaraj T (2017) Combining ability analysis and gene action of grain quality traits in rice (Oryza sativa L.) using line à - tester analysis. Journal of Applied and Natural Science 9(2): 1236-1255.
- Virmani SS, Sun ZX, Mou TM, Jauhar AA, Mao CX (2003) Two-line hybrid rice breeding manual. Int Rice Res Inst, Los Baños (Philippines): International Rice Research Institute. Asia, p. 88.
- Pace S, Piscioneri I, Settanni I (1998) Heterosis and combining ability in a half diallel cross of kenaf (Hibiscus cannabinus L.) in south Italy. Industrial crops and products 7(2-3): 317-327.
- Patel JP, Singh U, Kashyap SP, Singh DK, Goswami A, et al. (2013) Combining ability for yield and other quantitative traits in eggplant (Solanum melongena L.). Vegetable Science 40(1): 61-64.
- El Hadi AAH, Zaied KA, Azzam CR, El-Din MMN (2019) Genetical studies on sunflower using half diallel analysis. Egypt, J Plant Breed 23(7): 1585-1509.
- Al-Mamun M, Rafii MY, Misran AB, Berahim Z, Ahmad Z, et al. (2022) Combining ability and gene action for yield improvement in kenaf (Hibiscus cannabinus L.) under tropical conditions through diallel mating design. Scientific Reports 12(1): 9646.
- Al-Mamun M, Rafii MY, Berahim Z, Ahmad Z, Khan MMH, et al. (2022) Estimating genetic analysis using half diallel cross underlying kenaf (Hibiscus cannabinus L.) fiber yield in tropical climates. Biomed Research International 2022: 1532987.
- Ajmal A, Khaliq I, Rehman AU (2011) Genetic analysis for yield and some yield traits in bread wheat (Triticum aestivum ). Journal of Agricultural Research 49(4): 447- 454.
- Kumar A, Mishra VK, Vyas RP, Singh V (2011) Heterosis and combining ability analysis in bread wheat (Triticum aestivum ). J Plant Breed Crop Sci 3(10): 209-217.
- Lynch M, Walsh B (1998) Genetics and analysis of quantitative traits. Sinauer Sunderland MA, p. 847.
- Parikh L, Mmbaga MT, Kodati S, Blair M, Hui D, et al. (2016) Broad-sense heritability and genetic gain for powdery mildew resistance in multiple pseudo-F2 populations of flowering dogwoods (Cornus florida L.). Scientia Horticulturae 213: 216-221.
- Faruq G, Alamgir MA, Rahman MM, Motior MR, Zakaria HP, et al. (2013) Morphological characterization of kenaf (Hibiscus cannabinus L.) in Malaysian tropical environment using multivariate analysis. JAPS: Journal of Animal and Plant Sciences 23(1): 60-67.
- Eleweanya NP, Uguru MI, Ene OEE, Okocha PI (2005) Correlation and path coefficient analysis of grain field related characters in maize (Zea mays L) under umudike conditions of southeastern Nigeria. Agro Science 4(1): 24-28.
- Al-Mamun M, Rafii MY, Oladosu Y, Misran AB, Berahim Z, et al. (2022). Genotypic variability, correlation and path analysis among yield components in kenaf mutants under tropical conditions. Journal of Natural Fibers 19(16): 1-15.
- Singh BD (2009) Plant breeding principles and methods. (8th edn), Kalayani Publishers, New Delhi, India.
- Solieman THI, El Gabry MAH, Abido AI (2013) Heterosis, potence ratio and correlation of some important characters in tomato (Solanum lycopersicum L.). Scientia Horticulturae 150: 25-30.
- Carberry PS, Muchow RC, Williams R, Sturtz JD, McCown RL (1992) A simulation model of kenaf for assisting fiber industry planning in northern Australia. I. General introduction and phenological model. Australian Journal of Agricultural Research 43(7): 1501-1513.
- Alexopoulou E, Christou M, Mardikis M, Chatziathanassiou A (2000) Growth and yields of kenaf varieties in central Greece. Ind Crop Prod 11(2-3): 163-172.
- Patanè C, Sortino O (2010) Seed yield in kenaf (Hibiscus cannabinus L.) as affected by sowing time in South Italy. Industrial Crops and Products 32(3): 381-388.
- Aminah A, Wong CC, Hashim GM (2006) Production potential of Kenaf for forage and fiber on BRIS under smallholder production systems. In Fourth technical review meeting on the National Kenaf Research Project, MARDI, pp. 15-20.
- Raji JA (2007) Intercropping kenaf and cowpea. African Journal of Biotechnology 6(24): 2807-2809.
- Ryu J, Ha BK, Kim DS, Kim JB, Kim SH, et al. (2013) Assessment of growth and seed oil composition of kenaf (Hibiscus cannabinus L.) germplasm. Journal of Crop Science and Biotechnology 16(4): 297-302.
- Daham MM (2015) Prospects of commercialize mechanized kenaf production and processor Proceedings of the National Conference Agricultural and Food Mechanization. Malaysia Agricultural Research and Mechanization Institute (MARDI), pp. 23-25.
- Kamal IB (2014) Kenaf for biocomposite: An overview. Journal of Science and Technology, 6(2).
- Al-Mamun M, Saha CK, Mostofa MG, Miah A, Hossain MZ (2017) Identification of suitable varieties for seed production of jute in non-traditional areas of Bangladesh. Bangladesh Journal of Plant Breeding and Genetics 30(1): 33-38.
- Sani MZ, Ahmad F, Akil M, Ahmad Z, Hassan AA, et al. (2017) Gamma-radiation mutagenesis of Hibiscus cannabinus L. V36 variety: Radiosensitivity study, phenotypic characterization and multivariate analysis to explain variation among selected m1 progenies. Journal Sains Nuklear Malaysia 29(2): 21-32.
- Liu Y (2005) Diallel and stability analysis of kenaf (Hibiscus cannabinus L.) in South Africa. University of the Free State, Bloemfontein, South Africa.
- Gomez KA, Gomez AA (1984) Statistical procedures for agricultural research. An International Rice Research Institute Book, John Wiley & Sons.
- Steel RGD, Torrie JH, Deckey DA (1997) Principles and procedures of statistics. A biometrical Approach. (3rd edn). McGraw Hill Book Co Inc New York. pp. 352-358.
- Zahour A (1992). Elements of Genetic Improvement of Plants. Acts: Rabat, p. 232.
- Tang F, Xiao W (2013) Genetic effects and heterosis of within-boll yield components in upland cotton (Gossypium hirsutum L.). Euphytica 194: 41-51.
- Hayman BI (1954a) The theory and analysis of diallel crosses. Genet 39(6): 789-809.
- Griffing BR (1956) Concept of general and specific combining ability in relation to diallel crossing systems. Australian journal of biological sciences 9(4): 463-493.
- Baker RJ (1978) Issues in diallel analysis. Crop science 18(4): 533-536.
- Hayman BI (1954b) The analysis of variance of diallel tables. Biometrics 10(2): 235-244.
- Abd El-Satar MA., Fahmy RM, Hassan THA (2015) Genetic control of sunflower seed yield and its components under different edaphic and climate conditions. The 9th Plant Breeding International Conference September, pp. 103-123.
- Jones RM (1965) Analysis of variance of the half diallel table. Heredity 20: 117-121.
- Yates F (1947) Analysis of data from all possible reciprocal crosses between a set of parental lines. Heredity 1(3): 287-301.
- Pickett AA, Hamburg, Berlin, Paul P (1993) Hybrid wheat: Results and problems. Advances in plant breeding, p. 268.
- Jinks JL (1954) The analysis of continuous variation in a diallel cross of Nicotiana Rustica Varieties. Genetics 39(6): 767-788.
- Falconer DS, Mackay TFC (1996) Introduction to quantitative genetics. Essex. UK: Longman Group.
- Smith HH (1952) Fixing Transgressive Vigour in Nicotia Narustica. In: Gowen JW (Ed). Heterosis: Ames (IA), Iowa State University Press, USA, pp. 161-174.
- Alza JO, Fernandez MJM (1997) Genetic analysis of yield and related traits in sunflower (Helianthus annuus L.) in dry land and irrigated environments. Euphytica 95(2): 243-251.
- Benesty J, Chen J, Huang Y, Cohen I (2009) Pearson correlation coefficient. Noise reduction in speech processing, pp. 1-4.
- Behmaram R, Saleh G, Foroughi M, Noori Z, Malar PJ, et al. (2014) Genetic control of fiber yield and quality in kenaf (Hibiscus cannabinus L.). Iranian Journal of Genetics and Plant Breeding 3(1): 41-31.
- Jianmin Q, Youyu C, Ruiyang Z, Lihui L, Kangjing L, et al. (2005) Genetic effects and heterosis analysis for yield and quality traits in kenaf (Hibiscus cannabinus L.). Acta Agron Sin 31(4): 469-475.
- Heliyanto B, Hossain M, Basak SL (1998) Genetic evaluation of several kenaf (Hibiscus cannabinus) germplasm through diallel crossing. Indonesian Journal of Crop Sciences 13(1): 15-22.
- Matzinger DF, Sprague GF, Cockerham CC (1959) Diallel crosses of maize in experiments repeated over locations and years1. Agronomy Journal 51(6): 346-350.
- Mostofa MG, Rahman L, Ghosh RK (2013) Genetic analysis of some important seed yields related traits in Kenaf (Hibiscus cannabinus L.). Kasetsart J Nat Sci 47: 155-165.
- Gong YC, Guo AP, Liu WJ, Gong YC, Guo AP, et al. (1998) Analysis of genetic composition and combining ability of F1 hybrids and their parents of kenaf. China’s Fiber Crops 20(3): 1-6.
- Sobhan MA (1993) Heritability of Fiber, Fruit and Seed Yield in Hibiscus sabdariffa L. Botany, Dhaka University, Bangladesh.
- Khatun R (2007) Improvement of fiber yield and associated traits in white jute (Corchorus capsularis L.). Bot, Dhaka Univ, Bangladesh.
- Abu F, Mat TCN, Mohd MMA, Mohd Akhir S (2017) Antioxidant properties of crude extract, partition extract, and fermented medium of Dendrobium Sabin flower. Evidence Based Complementary and Alternative Medicine 2017: 2907219.
- Mostofa MG, Rahman L, Hussain MM (2011) Combining ability for yield and yield contributing characters in Kenaf (Hibiscus cannabinus L.). Bangladesh Journal of Plant Breeding and Genetics 24(1): 01-06.
- Sarker U, Mian MAK (2002). Line× tester analysis for yield and its components in rice (Oryza sativa L.). Journal of the Asiatic Society of Bangladesh, Science 28(1): 71-81.
- Anwar J, Akbar M, Hussain M, Asghar S, Ahmad J, et al. (2011) Combining ability estimates for grain yield in wheat. J Agric Res 49(4): 437-445.
- Hassan G, Mohammad F, Afridi SS, Khalil I (2007) Combining ability in the F1 generations of diallel cross for yield and yield components in wheat. Sarhad J Agric 23: 937- 942.
- Patil RC, Thombre MV (1981) Graphic and variance components analysis of five quantitative characters in Hibiscus cannabinus L. Journal of Maharashtra Agricultural Universities 6(3): 221-224.
- Jinks JL (1956) The F2 and backcross generations from a set of diallel crosses. Heredity 10(1): 1-30.
- Quamruzzaman AKM, Rashid MA, Ahmad S, Rahman MM, Sultana NA (2007) Combining ability estimates in nine eggplant varieties. Pakistan Journal of science and industrial research 50(1): 55-59.
- Hayman BI (1958) The theory and analysis of diallel crosses. Genetics 39(6): 789-809.
- Moll RH, Stuber CW (1974) Quantitative genetics-empirical results relevant to plant breeding. Advances in agronomy 26: 277-313.
- Akter N (2009) Genetic Analysis of Fiber and Seed Yield in Toss Jute (Corchorus olitorius L.). Thesis. Genetics and Plant Breeding, Bangladesh Agricultural University, Bangladesh.
- Xu Z (1990) Genetic Evaluation of IJO Collected Kenaf (Hibiscus cannabinus L.) Germplasm. Thesis, West Bengal, India.
- Echekwu CA, Showemimo FA (2004) Genetic, phenotypic and environmental variances and character associations in Kenaf. African Crop Science Journal 12(4): 321-326.
- Mukewar AM, Zope JS, Lahane PS (1997) Combining ability analysis in kenaf (Hibiscus sabdariffa L.) Indian Journal of Genetics & Plant Breeding 57(2): 161-162.
- Sheriff RA, Sarma MS, Sheriff RA (1995) Heterosis, potence ratio and inbreeding depression in roselle (Hibiscus sabdariffa) var. Altissima). Indian Journal of Genetics and Plant Breeding 55(4): 359-361.
- Mohndiratta PD (1968) General and specific combining ability studies and graphical analysis in wheat (Triticum aestivum L.). Punjab Agric Univ Ludhiana, India.
- Field A (2013) Discovering statistics using IBM SPSS statistics. University of Sussex, UK.
© 2023 Md Al Mamun. This is an open access article distributed under the terms of the Creative Commons Attribution License , which permits unrestricted use, distribution, and build upon your work non-commercially.
Editor In Chief


.jpg)


Signup for Newsletter

Quick Links
 Editorial Board Registrations
 Submit your Article
 Refer a Friend
 Advertise With Us
Our Recent Edition

.jpg)


Top Editors


.jpg)


.bmp)
.jpg)
.png)
.jpg)


.jpg)


.png)

.png)


.png)


Financial Support

Sponsors

Latest e-Books

Latest Video

 a Creative Commons Attribution 4.0 International License. Based on a work at www.crimsonpublishers.com.
Best viewed in
a Creative Commons Attribution 4.0 International License. Based on a work at www.crimsonpublishers.com.
Best viewed in