- Submissions

Full Text
Journal of Biotechnology & Bioresearch
Insight into Genetic Variability and Association Studies of Some Yield Contributing Characters in Advance Lines of Winter Rapeseed (Brassica Napus L.)
Md Mahmudul Hasan Khan1*, BC Kundu2, MM Ali3, MM Kadir4, MK Alam4, MG Kibria5, MMR Talukder5, R Akter6, S Hasna7 and SD Setu7
1Plant breeder, Oilseed and Legume Crop, Oilseed Research Centre, Regional Agricultural Research Station, BARI, Barishal-8211, Bangladesh
2Varietal improvement program, HRC, Regional Agricultural Research Station, BARI, Barishal-8211, Bangladesh
3Plant breeder, Plant Genetic Resources Centre, BARI, Gazipur-1701, Bangladesh
4Plant breeder, Regional Agricultural Research Station, BARI, Jamalpur-2000, Bangladesh
5Plant pathologist, Regional Agricultural Research Station, BARI, Barishal-8211, Bangladesh
6Agronomist, Tuber Crop Research Sub-Centre, BARI, Munshijang-1500, Bangladesh
7Horticulturist, Regional Agricultural Research Station, BARI, Barishal-8211, Bangladesh
*Corresponding author:Md Mahmudul Hasan Khan(https://orcid.org/0000- 0001-8195-3783), Legume and Oilseed Crop Breeder, Oilseed Research Centre, Regional Agricultural Research Station, BARI, Barishal, Bangladesh
Submission: October 02, 2023;Published: October 30, 2023

Volume5 Issue2October 30, 2023
Abstract
The third-largest source of vegetable oil in the world now is mustard (Brassica spp.), one of the most significant oilseed crops. A study of Brassica napus L was conducted with 12 genotypes at Regional Agricultural Research Station (RARS), Barishal during rabi 2022-2023 to evaluate for yield and yield contributing characters. Three replications were used in the RCBD design for the experiment. The results of the analysis of variance showed that there were highly significant differences for the traits of plant height, number of primary branches, number of secondary branches, and number of seeds per siliqua. Three different clusters among the examined accessions were identified using the UPGMA cluster analysis. Cluster II obtained the most accessions (six), averaging 1776.14 kgha-1, representing 33.67% of the average cluster mean yield. A correlation study focuses at the highly significant and positive correlation among a crop’s associated features and its yield. The overall amount of variance was found to be 53.72% for PC1 and 29.25% for PC2 using principal component analysis (PCA). Maturity duration ranged from 79-86 days while days to 50% flowering varied from 29-34 days. Seed yield ranged from 1477-1945 kgha-1 and NAP- 21010 has produced the highest yield among the genotypes evaluated in this study. It produced 22.17% and 19.18% higher yield than check varieties BARI Sarisha-8 and BARI Sarisha-9, respectively. Based on, statistical analysis considering seed yield and other yield contributing characters, four lines NAP-20002, NAP-20008, NAP-18002, and NAP-21010 were noted as high yielding accessions and could be used for future breeding program.
Keywords: Brassica napus L; Yield; Cluster analysis; Breeding program; Traits correlation
Introduction
The most significant oilseed crop in Bangladesh is rapeseed-mustard, which is a member of the Cruciferae family and belongs to the genus Brassica [1]. It is also a major source of vegetable oil [2]. More than 10 distinct oil crops grow in Bangladesh, producing fats and oils of varying quality and quantity. Oleiferous Brassica, which includes rape (Brassica campestris L. and Brassica napus L.) and mustard (Brassica juncea L. Czem & Coss), is a significant source of vegetable fats. Brassica juncea and Brassica rapa are the two species that are most often grown in Bangladesh. “Mustard” is the collective name for the two plant species that are farmed in Bangladesh: Brassica juncea and Brassica campestris [1,3]. The consumption of edible oil is increasing daily in Bangladesh. Production and cultivation of mustard are important parts of Bangladesh’s agricultural industry. As a key edible oilseed crop from ancient times, mustard has been grown in Bangladesh [4]. According to Jahan et al. [5] mustard seeds have 40-45% oil content, 20-25% protein, and 12-18% carbohydrate. In addition to providing a significant amount of energy (approximately 9 kcal per gram), mustard is also a good source of the fat-soluble vitamins A, D, E and K [1]. Its oil not only significantly contributes to our daily diet as a fat alternative but also supports the country’s economy [6].
The area devoted to growing mustard has grown dramatically in recent years. Examining the current domestic mustard output in Bangladesh and projecting the future is crucial for fulfilling the rising demand [7]. Due to increased acreage and high yields, Bangladesh produced 11.64 lakh tons of mustard oil seed in the current fiscal year of 2022-2023 as opposed to the objective of 11.12 tons [8] . Oil output is still not particularly noteworthy even if it is rising in relation to our needs. Because of this, many oil and oil seeds are imported into our nation each year. One option to reduce the demand-supply gap for edible oil in the nation may be to increase mustard production [9]. Brassica napus L. is mainly grown in the summer season of the cold countries under long day condition. As mustard and rapeseed are grown in the winter season of Bangladesh under short day’s condition; it was not possible to introduce this species directly in this country. Brassica napus L. which would be suitable to cultivate in Bangladesh was developed by artificially and through introgressive hybridization. Some unique promising lines including two check varieties were chosen, among the developed genotypes of Brassica napus in Bangladesh. Considering the above incidence, the present study was aimed to find out the high yielding potential genotypes of Brassica napus L. for its yield improvement as well as for breeding program.
Method and Materials
The GPS Coordinates of the experimental site is 22.78825,90.29307. Twelve genotypes of Brassica napus L. and two controls, BARI Sarisha-8 and BARI Sarisha-9, were used in the experiment in Regional Agricultural Research Station (RARS), Barishal during the rabi 2022- 2023. The experiment included three replications and was set up using a randomized complete block design. The area was 3m by 0.9m in size. Continuous seeding was done on November 17, 2022, in rows that were spaced 30cm apart. The seedlings were thinned after few days of germination 5cm apart. Fertilizers were applied@ 120:80:60:40:4:1kg/ha of N:P:K:S:Zn and Boron from Urea, TSP, MOP, Gypsum, Zinc Sulphate and Boric acid respectively [10]. Half of the urea and all other fertilizers were applied during final land preparation. The rest of the urea was applied at flower initiation stage. All intercultural operations were done timely to raise a good crop. Data were taken on days to flowering, days to maturity, plant height (cm), no. of primary branch per plant, no. of secondary branch per plant, no. of siliqua per plant, no. of seeds per siliqua, 1000 seed weight (g) and seed yield per plot. The plot yield was converted into kilogram per hectare (kgha-1). The data were analyzed statistically.
Statistical analysis
All of the morphological features mentioned were subjected to an analysis of variance using the Statistical Analysis System (SAS) version 9.4 software. List Significant Difference (LSD) at 5% was used to differentiate the significant differences throughout the means comparison. According to Khalikqi et al. [11], “proc corr” in the SAS software was used to determine the correlations among the yield and yield component qualities. In order to investigate genetic diversity, similarity of coefficient data from Dices and Jaccard was also analyzed using the Euclidian Distance Method. Additionally, the genetic inter-relationship (showing a dendrogram) among the Brassica napus genotypes was calculated using the Unweighted Pair Group technique utilizing Arithmetic Average (UPGMA) and the algorithm & sequential, agglomerative, hierarchical and non-overlapping (SAHN) technique. The NTSYSpc version 2.1 (Numerical Taxonomy Multivariate Research System), software 40 from Exeter Software, Setauket, New York, USA, was used for this research. Using similar software, the principal component analysis (PCA) was done to produce two dimensional (2D) plots reported by Khan et. al. [12].
Result and Discussion
Mean square (MS) of Analysis of variance (ANOVA)
Results of analysis of variance (ANOVA) for nine characters of 12 genotypes along with two checks are presented in Table 1. Among the genotypes, highly significant (p ≤ 0.01) mean square accounted for no. of siliqua per plant (NSPP), no. of seeds per siliqua (NSPS) and seed yield (kgha- 1) whereas 1000 seeds weight (TSW) had significant difference at p≤0.05. This occurrence demonstrated the existence of highly significant genetic heterogeneity among the genotypes in terms of statistically significant traits. However, the traits viz., days to 50% flowering (D50%F), days to maturity (DM), plant height (PH), no. of primary branches per plant (NPBPP), and no. of secondary branches per plant (NSBPP) had no statistically meaningful difference (p≥0.05). Among the replication no. of siliqua per plant showed highly significant (p≤0.01) while no. of secondary branches per plant had significant difference (p≤0.05). Fayyaz & Amin (2005) also found that there was significant genetic and environmental variability among the genotypes due to variance in analysis of variance.
Table 1:Mean square of ANOVA for yield and yield components of Brassica napus L.

Note: *, **denotes significance level at p ≤ 0.05&0.01; Rep = replication, Gen = genotype, DF =degree of freedom, LSDleast significant difference; D50%F= days to fifty percent flowering, DM = days to maturity, PH = Plant height (cm), NPBPP = no. of primary branch per plant, NSBPP = no. of secondary branch per plant, NSPP = no. of siliqua per plant, NSPS = no. of seeds per siliqua, TSW = 1000 seed weight (g) and seed yield (kgha-1).
Mean performance of genotypes
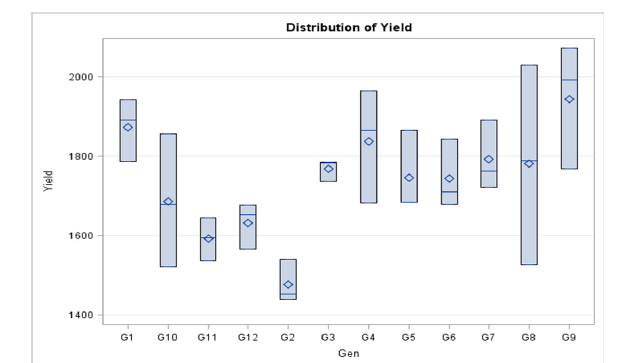
Among the Brassica napus L. genotypes the results showed that plant height, no. of siliqua per plant, no. of seeds per siliqua, thousand seed weight, and seed yield were statistically significant (Table 2). The evaluated genotypes were statistically similar subjected to plant height though highest was recorded in BARI Sharisa-8 (90.2cm) followed by BARI Sharisa-9 (89.88cm), and NAP- 16004 (89.71cm). The lowest plant height (83.33cm) was recorded in NAP-20009. The highest number of siliqua per plant (162) was accounted for the genotype NAP-21010 followed by the genotype NAP-20002 (154) and NAP-18002(146) whereas the lowest was recorded as 118 for the genotype NAP-20008. The highest seed per siliqua (34) was observed for the genotype NAP- 21010 followed by BARI Sharisa-9 (30). However, the genotypes NAP-20008 had lowest number of seed per siliqua (20). The maximum values for the traits 1000 seeds weight (g)were recorded in the genotypes NAP-21010 (3.4g) among the genotypes. The highest seed yield (1945.33 kgha-1) was recorded in NAP-21010 followed by NAP- 20002 (1874 kgha-1) and NAP-18002 (1838.33 kgha-1) (Figure 1, Table 2) which produces 22.17%, 17.69%, and 15.45% higher yield over the check variety BARI Sarisha-8 as well as 19.18%, 14.81% and 12.62% over the check variety BARI Sarisha-9, respectively (Table 2). Days to 50% flowering ranges from 29 to 34 days while the maturity period ranges from 79-86 days. The tested genotypes were taking more less similar days to maturity while the accession NAP-20009 identify as early mature as well as short duration line with a medium yield potentiality of 1769 kgha-1. Sharif et al. [13] reported 1730 kgha-1 yield and Helal et al. [14] reported 800 to 1460 kgha-1 when evaluated of 3 and 12 lines, respectively.
Figure 1:The distribution of yield of 12 genotypes of Brassica napus L.

Table 2:Mean performance and relative position of Brassica napus L. genotypes.

Note: Means with the same letter are not significantly different. * and **denotes significance level at p<0.05 & 0.01, respectively; RP = relative position, LSD- least significant difference. StD= standard deviation, SE = standard error, CV = coefficient of variation, D50%F = days to fifty percent flowering, DM = days to maturity, PH = Plant height (cm), NPBPP = no. of primary branch per plant, NSBPP = no. of secondary branch per plant, NSPP = no. of siliqua per plant, NSPS = no. of seeds per siliqua, TSW = 1000 seed weight (g) and seed yield (kgha-1).
Clustering pattern and Principal component analysis
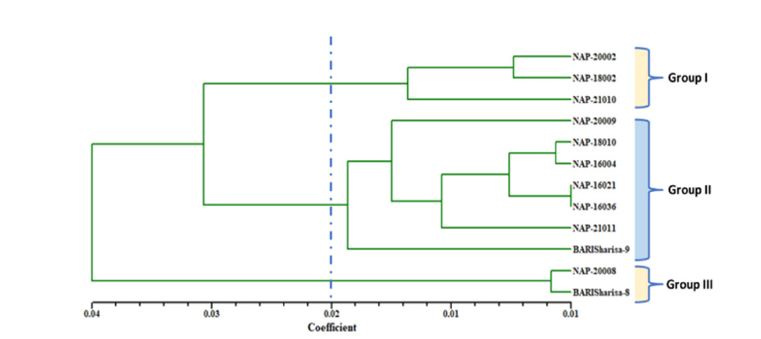
The UPGMA (average linkage) cluster analysis revealed distinct clusters suggesting relationships among tested accessions, as represented by a dendrogram (Figure 2). The accessions were divided into three major clusters based on their evaluated measurable traits, with a dissimilarity coefficient of 0.02. The dendrogram was cut off at 0.02 using Mojena’s [15] stopping criteria to choose the best cluster number and readability. Cluster II acquired the highest number of accessions (6) with an average yield of 1776.14 kgha-1 which was 33.67% of the average of cluster mean yield. The maximum average yield (1885.89kgha-1) was recorded for cluster I (36.57%) which consists of three accessions (Table 3) followed by cluster II (1736.14kgha-1; 33.67%) with the best agronomic features. Genotypes under cluster III reported as very low yield potential with an average of 1534.83kgha-1 (29.76%). Furthermore, we observed 8.38% greater (+) average yield compared to the grand mean yield of 1740.02kgha-1 for cluster I while cluster II (0.22%) and cluster III (11.79%) had lower (-) yield. On an average, in terms of yield, genotypes under cluster I (NAP- 20002, NAP-18002, NAP-21010) produce higher yield compared to the cluster II, and cluster III (Table 3) and were identified as suitable accessions for future improvement of this crop. Khan et al. [12] reported a similar trend of findings in his research on Bambara groundnut.
Figure 2:Cluster analysis revealed a dendrogram for 12 Brassica napus L. genotypes based on the UPGMA method of SAHN clustering.

Table 3:Relative proportion of grand mean yield for three clusters based on the UPMGA clustering pattern.

Principal component analysis
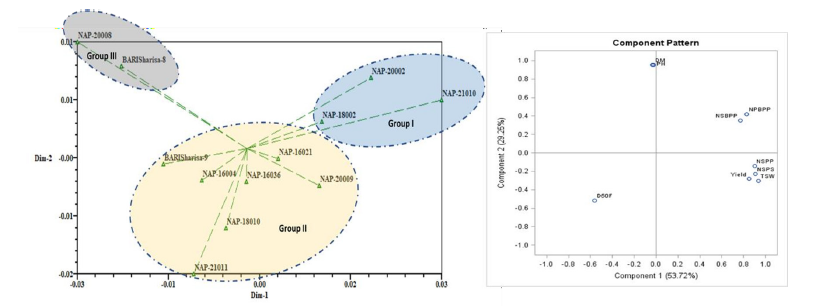
The first axis (PC1) of any principal component analysis (PCA) explains the highest amount of the overall variation [16]. In our findings first principal component (PC1) accounted more proportion of variation (53.72%) than PC2 (29.25%) while PC2 represented up to 82.97% of cumulative variance (Table 4). The traits viz., number of primary branches per plant, number of secondary branches per plant, number of siliqua per plant, number of seeds per siliqua, 1000 seed weight (g) and seed yield (kgha-1) concerned with positively high values in PC1. These traits were positioned into positive (+ve) quartile and very close to each other (Figure 3) in component pattern plot indicating that there is a significant impact of these traits on yield. The cluster analysis together with principal component analysis explored the common association among genotypes in terms of seed yield and related agronomic traits [12]. The two-dimensional (2D) graphical exposition (Figure 3) confirmed that most of the genotypes were dispersed at low distances whereas the few were positioned at high distances as reflected by eigenvector (Table 4). The most distant genotypes from centroid were NAP-20002, NAP-21010NAP-20008, and BARI Sharisa-8 whereas other accessions were near to centroid. Khan et al. [16] classified the 44 Bambara groundnut accessions based on quantitative features using PCA analysis.
Table 4:Principal component analysis for quantitative traits of Brassica napus L. genotypes.

Note: PC =-principal component, D50%F = days to fifty percent flowering, DM = days to maturity, PH = Plant height (cm), NPBPP = no. of primary branch per plant, NSBPP = no. of secondary branch per plant, NSPP = no. of siliqua per plant, NSPS = no. of seeds per siliqua, TSW = 1000 seed weight (g) and seed yield (kgha-1).
Figure 3:Two-dimensional (2D) graph showing the relationship among 12 Brassica napus L. genotypes using PCA revealed by NTSYS pc and component pattern plot for 9 morphological traits revealed by PCA using SAS.

Characters association analysis
The phenotypic correlation among the 9 quantitative traits of twelve Brassica napus L. genotypes are given in Table 5. The trait yield kg per hectare revealed positively moderate (0.25 ≤ r ≤ 0.75) and highly significant association with no. of siliqua per plant (r = 0.48; p ≤ 0.01), no. of seeds per siliqua (r = 0.52; p ≤ 0.01) and 1000 seeds weight (r = 0.60; p ≤ 0.01). We observed positively intermediate but no significant association of yield with no. of primary branches per plant (r = 0.31; p ≥ 0.05). Thousand seed weight had positive and moderate association with no. of secondary branches per plant (r =0.41; p ≤ 0.05), no. of siliqua per plant (r =0.37; p ≤ 0.05), and no. of seeds per siliqua (r = 0.47; p ≤ 0.01). A weak (0.0 ≤ r ≤ 0.25) and non-significant association was found in yield with no. of secondary branches per plant (r = 0.17; p ≥ 0.05). A positively strong (0.75 ≤ r ≤ 1.00) and highly significant association was noted for days to maturity with plant height (r = 0.99; p ≤ 0.01). Number of siliqua per plant had positive and highly significant correlation with number of seeds per siliqua (r = 0.64; p ≤ 0.01). However, there was a negative association between yield and the variables plant height, days to 50% flowering, and days to maturity, showing that early maturity and high vegetative growth reduce genotypes’ potential for high yields. The fact that the yield and yield-related features reported in this study had positive and very significant correlation suggested that the investigated morphological attributes correctly predicted the yield and were acceptable for genotype selection in a future breeding program. The positive correlation indicates a better exploration of these traits for the development of desirable genotypes [1] and also reported that the yield related traits is directly correlated with grain yield [17,18].
Table 5:Pearson’s correlation coefficients (r) among 9 quantitative traits of Brassica napus L.

Note: “**” correlation is significant at the 0.01 level; “*” correlation is significant at the 0.05 level, D50%F = days to fifty percent flowering, DM = days to maturity, PH = Plant height (cm), NPBPP = no. of primary branch per plant, NSBPP = no. of secondary branch per plant, NSPP = no. of siliqua per plant, NSPS = no. of seeds per siliqua, TSW = 1000 seed weight (g) and seed yield(kgha-1).
Conclusion
Four lines, NAP-20002, NAP-20008, NAP-18002, and NAP- 21010, were chosen for an adaptive yield trial the following year after being determined to be promising in terms of all statistical metrics, taking location-wise seed yield and other yieldcontributing features into consideration. The characteristics, namely the maturity time, yield, and yield-contributing features. The characteristics number of primary branches, number of secondary branches, number of siliqua per plant, and thousand seed weight revealed a statistically significant correlation with yield, indicating that these features are useful for choosing genotypes for a future breeding plan.
Acknowledgement
The authors are grateful to the Chief Scientific Officer, Regional Agricultural Research Station (RARS), Bangladesh Agricultural Research Institute (BARI) as well as all the staff of the oilseed research center at Regional Agricultural Research Station (RARS), Barishal, Bangladesh.
Competing Interests
The authors declare no competing interests.
References
- Ahmed Z, Kashem MA (2017) Performance of mustard varieties in haor area of Bangladesh. Bangladesh Agronomy Journal 20(1): 1-5.
- Khan MH, Bhuiyan SR, Rashid MH, Ghosh S, Paul SK (2013a) Variability and heritability analysis in short duration and high yielding Brassica rape L. Bangladesh Journal of Agricultural Research 38(4): 647-657.
- USDA (2022) Bangladesh: Oilseeds and products annual | USDA Foreign Agricultural Service.
- Aziz MA, Rahman AKMM, Chakma R, Ahmed M, Ahsan AFMS (2011) Performance of mustard varieties in the hilly areas of Bangladesh. J Expt Biosci 2(2): 7-10
- Jahan N, Khan MH, Ghosh S, Bhuiyan SR, Hossain S (2014) Variability and heritability analysis in F4 genotypes of Brassica rapa L. Bangladesh Journal of Agricultural Research 39(2): 227-241.
- Uddin MS, Talukdar MMR, Khan MSI, Huq MI, Razzaque MA (2009) Evaluation of mustard genotypes under late sowing condition in the Southern Region of Bangladesh. Journal of Scientific Research 1(3): 667-672.
- Khan MH, Ali MM, Vhuiyan SR, Mahmud F (2013b) Genetic divergence in rapeseed-mustard (Brassica rapa L.). Bangladesh Journal of Agricultural Research 38(3): 417-423.
- Agriculture Information Service (AIS) (2023) Government of the People’s Republic of Bangladesh.
- Tridge (2021) Export & Import Trends in Food & Agriculture.
- BARI-ORC (2022) (Bangladesh Agricultural Research Institute), annual report (20021-2022). Oilseed research centre. Bangladesh Agril Res Inst Joydebpur.
- Khaliqi A, Rafii MY, Mazlan N, Jusoh M, Oladosu Y (2021) Genetic analysis and selection criteria in Bambara groundnut accessions-based yield performance. Agronomy 11(8): 1634.
- Khan MMH, Rafii MY, Ramlee SI, Jusoh M, Al Mamun M (2021) Genetic analysis and selection of Bambara groundnut (Vigna subterranean [L.] Verdc.) landraces for high yield revealed by qualitative and quantitative traits. Scientific Reports 11(1): 7597.
- Sharif MAR, Haque MZ, Howlader MHK, Hossain MJ (2016) Effect of sowing time on growth and yield attributes of three mustard cultivars grown in Tidal Floodplain of Bangladesh. Journal of the Bangladesh Agricultural University 14(2): 155-160.
- Helal MU, Islam N, Kadir M, Miah MNH, Biswas M, et al. (2016) Performance of rapeseed and mustard (Brassica) varieties/lines in north-east region (Sylhet) of Bangladesh. Agril Res Technol 2: 01-06.
- Mojena R (1977) Hierarchical grouping methods and stopping rules: An evaluation. The Computer Journal 20(4): 359-363.
- Khan MMH, Rafii MY, Ramlee SI, Jusoh M, Oladosu Y, et al. (2022) Unveiling genetic diversity, characterization, and selection of Bambara Groundnut (Vigna subterranea Verdc) genotypes reflecting yield and yield components in tropical Malaysia. BioMed Research International 2022: 6794475.
- Fayyaz L, Amin NU, Naseeb U, Hidayat Ur R, Farhatullah (2015) Genetic variability among advanced lines of Brassica. Pak J Bot 47(2): 623-628.
- Khan MMH, Rafii MY, Ramlee SI, Jusoh M, Mamun A (2020) Genetic variability, heritability and clustering pattern exploration of Bambara groundnut (Vigna subterranea Verdc) accessions for the perfection of yield and yield-related traits. BioMed Research International 2020: 2195797.
© 2023 Md Mahmudul Hasan Khan. This is an open access article distributed under the terms of the Creative Commons Attribution License , which permits unrestricted use, distribution, and build upon your work non-commercially.
 a Creative Commons Attribution 4.0 International License. Based on a work at www.crimsonpublishers.com.
Best viewed in


.jpg)


 Editorial Board Registrations
 Submit your Article
 Refer a Friend
 Advertise With Us
.jpg)


.jpg)


.bmp)
.jpg)
.png)
.jpg)


.jpg)


.png)

.png)


.png)


