- Submissions

Full Text
Journal of Biotechnology & Bioresearch
Genetic Assessment of Selected Rice (Oryza sativa L.) Genotypes Based on Agro-Morphological Traits in Tropical Climate: Malaysia
Mohammad Anisuzzaman1,4*, Mohd Rafii2, Hasan Uz Zaman3, Rafiqul Islam4, Hasina Khatun4, Yeakub Khan4 and Azadul Haque1,5
1aboratory of Climate-Smart Food Production, Institute of Tropical Agriculture and Food Security, University Putra Malaysia (UPM), Serdang, Selangor, Malaysia
2Department of Crop Science, Faculty of Agriculture, University Putra Malaysia (UPM), Serdang, Selangor, Malaysia
3Plant Breeding Division, Bangladesh Agricultural Research Institute (BARI), Gazipur, Bangladesh
4Plant Breeding Division, Bangladesh Rice Research Institute (BRRI), Gazipur, Bangladesh
5Bangladesh Institute of Nuclear Agriculture, Mymensingh, Bangladesh
*Corresponding author:Mohammad Anisuzzaman, Laboratory of Climate- Smart Food Production, Institute of Tropical Agriculture and Food Security, University Putra Malaysia (UPM), Serdang, Selangor, Malaysia, Plant Breeding Division, Bangladesh Rice Research Institute (BRRI), Gazipur, Bangladesh
Submission: March 28, 2023;Published: May 18, 2023

Volume4 Issue5May , 2023
Abstract
Rice contributes significantly to global food security and is a major food crop for half of the world’s population. Sixty-five traditional and improved rice genotypes were collected and grown in pot condition to evaluate the presence of genetic diversity. Analysis of variance showed significantly difference among the genotypes for all traits. The phenotypic coefficient of variation was higher than the genotypic coefficient of variation for the most of the traits. Correlation analysis revealed significant positive and negative correlation among the traits. Principal component analysis showed that the first two principal components of the considered traits and pointed out a wide variation among the genotypes. The dendrogram of cluster analysis grouped 65 rice genotypes into eight clusters. Data from this study provide presence of sufficient genetic diversity among the traditional and improved rice genotypes which can be employed in future rice breeding program for either varietal improvement or developing new variety.
Keywords: Genetic variability; Heritability; Genetic advance; Correlation coefficient
Introduction
Rice (Oryza sativa L.) is an important, staple food crop and one of the oldest crop for more than half of the world’s human population. One hundred and sixty seven million and twenty five thousand hectares of cultivated area yielded a global production of approximately 770 million tons [1] with Asia producing 90%, Africa and Americas producing 4.8% and 4.6 respectively. The human population is expected to rise 10 billion by 2050 and 50% increase in food production is expected in order to feed this expected population. Rice is a security crop in Malaysia, as it provides a staple diet for the majority of the population and a source of income for rural farmers. Around 150,000 farmers in Malaysia rely only on rice agriculture for their livelihood [2]. The average rice productivity in Malaysia is low (1.88 million metric ton). Whereas, China’s paddy rice production amounted to over 209.6 million metric ton, while India’s production volume exceeded 177 million metric tons. The rice is grown in the world 165.25 million hectares with a yield of about 756 million tons [1]. Rice is the most important food in Malaysia, and it is grown in 12 rice-growing areas that encompass roughly 0.6 million hectares of land across the country. Annually, around 2.6 million tons of rice are produced, accounting for 70% of self-sufficiency, with the remaining 30% being supplied by imports from neighboring countries [3]. In irrigated wetland rice areas account for approximately 321,696 ha of the total area in Malaysia is equipped with extensive irrigation and drainage systems of wetland rice, while the rainfed upland area 276,787 ha [4].
Exploring genetic diversity in available landrace and wild relatives is one of the most important way to improve the germplasm [5] using breeding program. For a breeding program sustainable, clear-cut knowledge on genetic diversity related to yield and yield-contributing traits is a vital one. Through systematic test and evaluation of germplasms, plant breeders are trying to exploit superior genetic stock for selection and production of cultivars with high potentiality [6] as rice cultivation is not solely depends on cultural practices but also relies on inherent genetic variability among the germplasm [7]. For enhancement of rice production, determining finest breeding procedures is necessary and in this aspect, it is crucial to have morphological genetic diversity for different yield contributing traits in rice. However, morphological attributes are highly influenced by environmental factors, resulted differential pattern of relationship in different degree [8], but still very much effective for selection in breeding program [9]. Breeding strategies in rice rely mostly on the variation nature and inter relationship among yield attributes. It is therefore imperative to assess extent of genetic transmissibility and gain of yield contributing traits to predict selection response for further improvement. In the case, heritability estimate is necessary as it indicates the genetic involvement for the transmission of characters from one generation to other generations [10]. To improve yield-attributing traits using different breeding approach, it is imperative to have knowledge on the association between yield and different yield attributing traits, which help the breeder to make suitable strategy for yield improvement. Correlation studies not only provide better vision towards the relationship among grain yield with other yield attributes [11] but also assists plant breeders for more accurate and precise selection [12]. Cluster analysis function for grouping different genotypes based on their similar performance in terms of different traits is now become very much popular tools for diversity analysis also [13]. Keeping all the information under consideration, variability among sixty-five rice genotypes, to unravel the degree of association between yield and yield attributes and to explore the diversity among different rice genotypes collected from different regions.
Method and Materials
Experiment location
The pot experiment was carried out in the field 10 of the net house, University Putra Malaysia (UPM), Malaysia. The experiment was conducted two seasons, the first season being from February 2019 to June 2019 and the second season from August 2019 to December 2019. The experimental place is situated at around 3°02ˈN latitude and 101°42ˈE longitude on the altitude of 31m above sea level and in humid tropical climate.
Plant materials
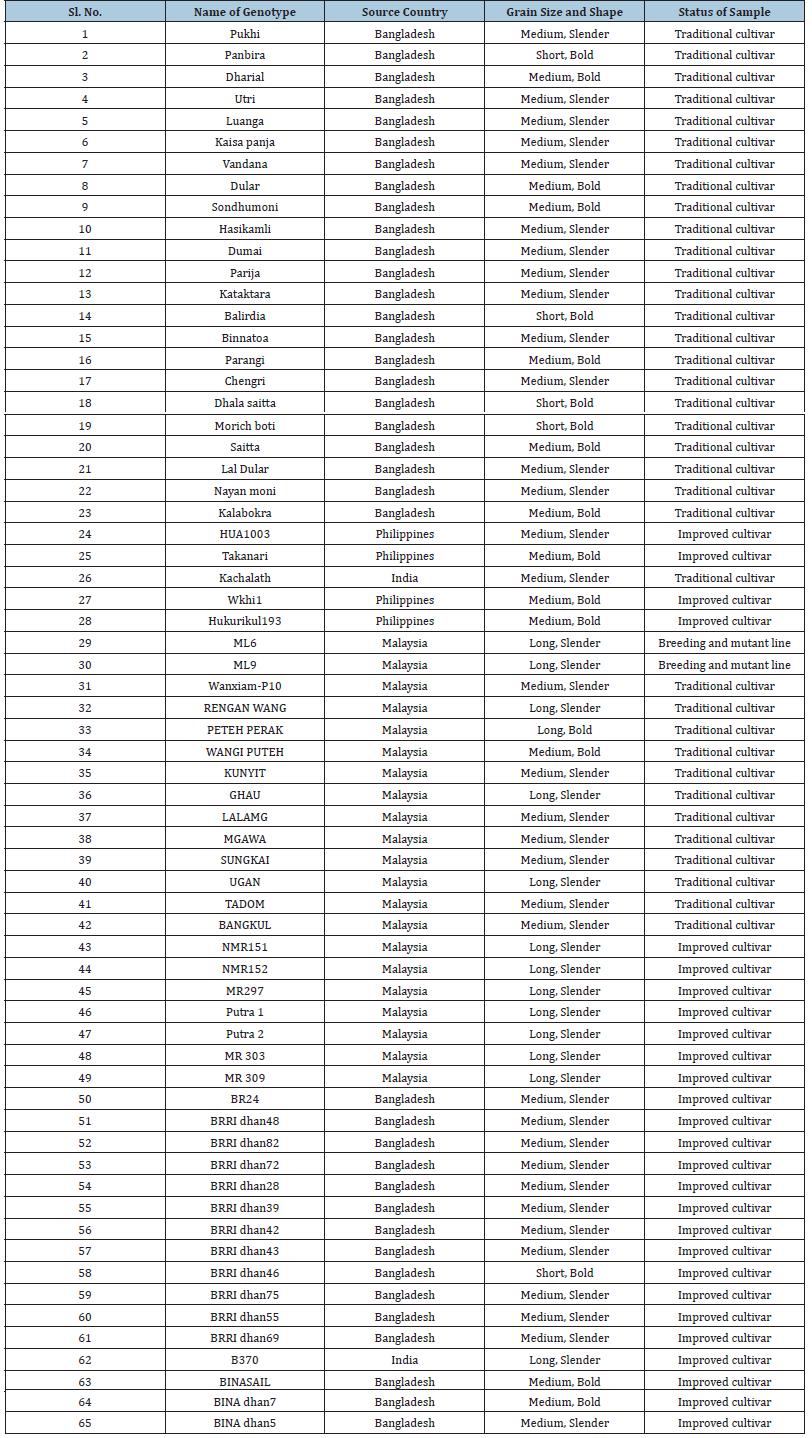
65 rice genotypes were selected in this study. The genotypes are obtained from different sources: Four genotypes were from International Rice Research Institute (IRRI), Philippines; 37 genotypes were from Bangladesh Rice Research Institute (BRRI), Bangladesh, and 2 genotypes were Indian Agricultural Research Center, India and twenty 2 genotypes from the Department of Crop Science at University Putra Malaysia’s Gene Bank. The genotypes names, origin, and status of the genotypes are represented in Table 1.
Table 1: List of 65 traditional and improved rice genotypes.
Settings and design of the experiment
Experiment was designed as a randomized complete block design (RCBD) with three replications. Twenty-day-old seedlings of each test genotypes were transplanted, and using two seedlings per hill in 24cm diameter and 30cm height plastic pot with 15kg soil and 20cm spacing between plant to plant.
Fertilizer application and intercultural operation
Fertilizers were applied @150:60:60kg N: P: K per hectare. However, except N, the other fertilizers were applied at final soil preparation on pot. Nitrogen was applied in three w qual splits, at 15 days after transplanting (DAT), at 35 DAT, and just before flowering. Intercultural operations and pest control measures were done as and when necessary.
Collection of data
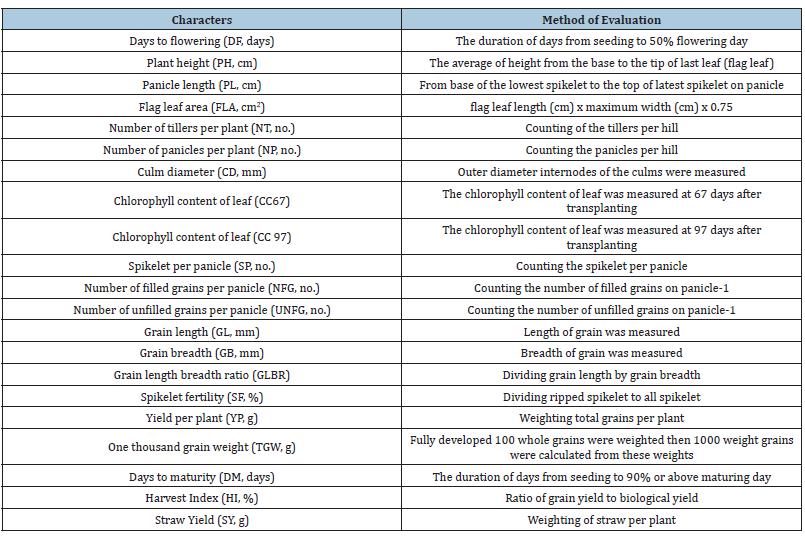
Table 2 shows the morphological, physiological, and yield characteristics, a total of twenty-one quantitative attributes were recorded. The quantitative trait such as days to flowering (DF), days to maturity (DM), plant height (PH, cm), culm diameter (CD, mm), flag leaf area (FLA, cm2), total number of tiller plant-1 (NT, no.), total number of panicle plant-1 (NP, no.), spikelet panicle-1 (SP, no), number of filled grains panicle-1 (NFG, no), number of unfilled grains panicle-1 (UNFG, no), spikelet fertility (SF,%), chlorophyll content 67&97 days after transplanting (CC67 &CC97 DAT), grain length (GL, mm), grain breadth (GB, mm), grain length breadth ratio (GLBR), 1000 grain weight (TGW, g), grain yield plant-1 (YP, g), straw yield plant-1(SY, g) and harvest index (HI,%).
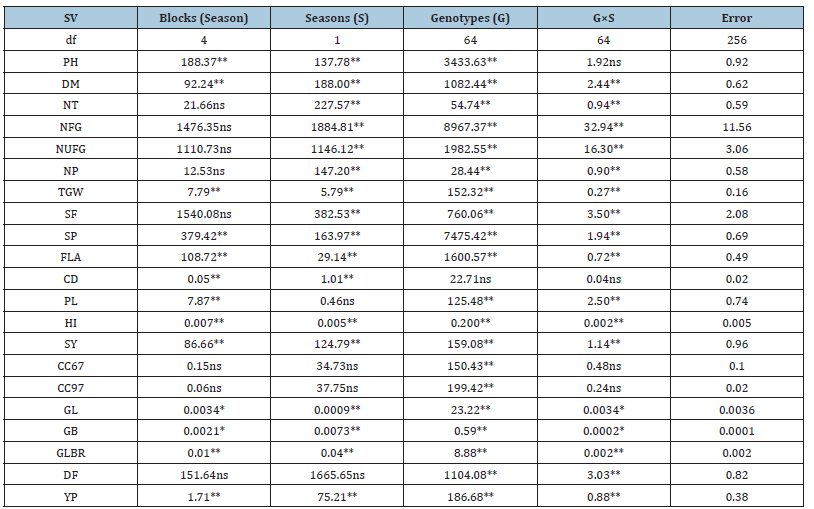
Table 2: An analysis of variance was used to compare the morphological, physiological, and yield parameters of 65 rice genotypes examined over two seasons (mean squares).
Statistical analysis
All morphological, yield, and yield component data were analyzed with using Statistical Analysis Software (SAS) version 9.4, we used the ANOVA process to see if there are any major differences, as well as the least significant differences (LSD) approach to compare among the significant characteristic means. The multiple variance components, such as genotypic variance (σ2g), phenotypic variance (σ2p), and error variance (σ2e) were estimated from the mean square for all examined characteristics using SAS’ PROC VARCOMP technique with restricted maximum likelihood (REM). The genotypic coefficient of variation (GCV), phenotypic coefficient of variation (PCV, broad-sense heritability (h2B) and genetic advance (GA) were estimated following [14]. The genetic variability of 21 quantitative variables was assessed using cluster analysis. The Euclidian distance method, as well as Dice’s and Jaccard’s similarity coefficients, were used to assess the genetic variability data. The cluster analysis between rice genotypes was Ward Hierarchical Clustering (WHC) method using JMP version 1.6SAS program. For the analysis NTSYS version 2.1 (Numerical Taxonomy Multivariate Analysis System), exeter soft-were, Setauket, NY, USA software were used the principal component analysis (PCA) and was done to produce two dimensional (2D) plots through, multivariate statistical packages (MVSP) was used for OCA biplot loading (Table 2,3).
Table 3: Explanation of 65 rice genotypes dignified quantitative characteristics.
Result
Analysis of variance on morpho-physiological and yield characters
The combined analysis of variance for the two seasons showed significant differences among the growth characters evaluated (Table 1). Significant differences (P≤0.001 or 0.05) were observed in seasons, genotype, and genotype by season interaction for all the evaluated traits except culm diameter were non-significant differences were observed for genotype and genotype by season interaction. Similarity, no significant differences were observed plant height, chlorophyll content at 67 DAT and chlorophyll content at 97 DAT for genotype by season interaction (Table 1). The CV% for yield and yield related components vary from 7.04 to 29.85% indicating a high variability among the studied traits. Out of 21 traits, number of unfilled grains panicle-1, flag leaf area, number of tiller per plant-1, number of panicles plant-1 and number of filled grains panicle-1 found with relatively higher coefficient of variation (26.74, 22.37, 20.46, 19.53 and 17.80%, respectively) than the other traits shown in Table 4. These possibly happened because of characters and/or sampling error were more influenced by the environmental factors.
Table 4:Variability in 65 rice genotypes for several quantitative parameters.
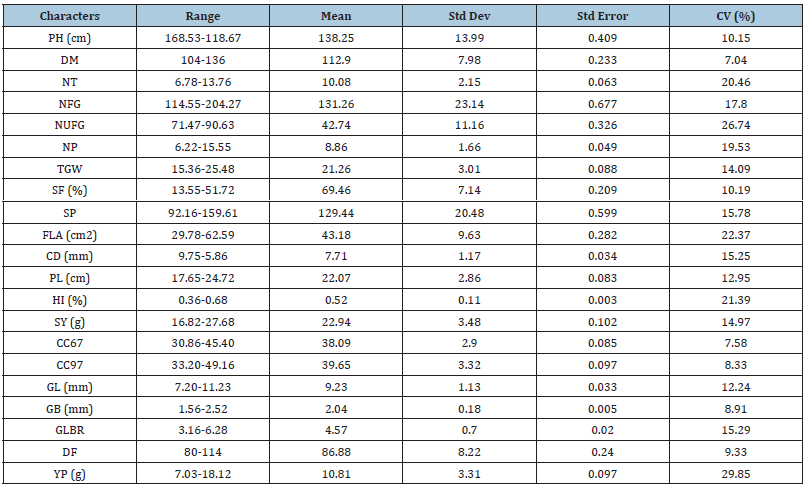
Note: PH: Plant Height; DM: Days to Maturity; NT: Number of Tiller; NFG: Number of Filled Grain; NUFG: Number of Unfilled Grain; NP: Number of Panicle; TGW: 1000 Grain Weight; SF: Spikelet Fertility; SP: Spikelet Per Panicle; FLA: Flag Leaf Area; CD: Culm Diameter; PL: Panicle Length; HI: Harvest Index; SY: Straw Yield; CC67: Chlorophyll Content after 67 days after Transplanting; CC97: Chlorophyll Content after 97 days after Transplanting; GL: Grain Length; GB: Grain Breadth; GLBR: Grain Length Breadth Ratio; DF: Days to Flowering; YP: Yield Per Plant; Std Dev: Standard Deviation; Std error: Standard Error; CV: Coefficient of Variation.
The plant height varied from 118.67-168.53cm with genotypes Kalabokra having the highest mean value while the lowest height was recorded in BRRI dhan75 (Table 5). The days to 50% flowering ranged from 80 to 114 days, as observed in early flowering in Sondhamoni (80 days) and late flowering observed in BRRI dhan28 (121 days). The growth duration ranged from (SUNGKAI) 104 days to (BRRI dhan55)136 days. The highest no. of tillers per plant observed in genotype HUA 1003 (13) and lowest no of tillers observed in genotype Panbira (6). The highest no. of grains per panicle produced in genotype BRRI dhan72 (204) and lowest grains produced in genotype TADOM (114). The highest no. of panicles per plant observed in genotype BRRI dhan55 (15) and lowest panicles produced in genotype Panbira (6) (Table 5). The flag leaf area ranged from 29.78cm2 (TADOM) to 62.59cm2 (BRRI dhan48). The longest panicle length observed in genotype BRRI dhan55 (24.72cm) and shortest in genotype Hasikamla (17.65cm). Chlorophyll content 67 DAT ranged from 30.86 (RENGAN WANG) to 45.4 (BRRI dhan72) and Chlorophyll content 97 DAT ranged from 33.20 (GHUA) to 49.16 (BRRI dhan72).The culm diameter ranged between 5.86mm (Saitta) to 9.75mm (Putra1) (Table 6). The 1000 grains weight ranged from 15.26-25.48g. MR309 had the highest value of 1000-grain weight (25.48g), which was not significantly different from Putra2, BR24, BRRI dhan82, BRRI dhan72 and MR297.The lowest grain weight was recorded in genotype Panbira (15.36g). The grain length breadth ratio ranged from 6.28 (RENGAN WANG) to G19 (3.16) (Morich boti). The Straw yield ranged from 16.82g (Vandana) to 27.68g (BRRI dhan82. The highest yield per plant was recorded in genotype MR297 (18.12g) which was statistically similar to BR24, BRRI dhan72, Putra 2, HUA1003, Putra 1 and BRRI dhan75. The lowest yield was observed in genotype Kalabokra (7.03g) (Table 7).
Table 5:Mean performance of 65 rice genotypes for different morpho-physiological and yield traits..
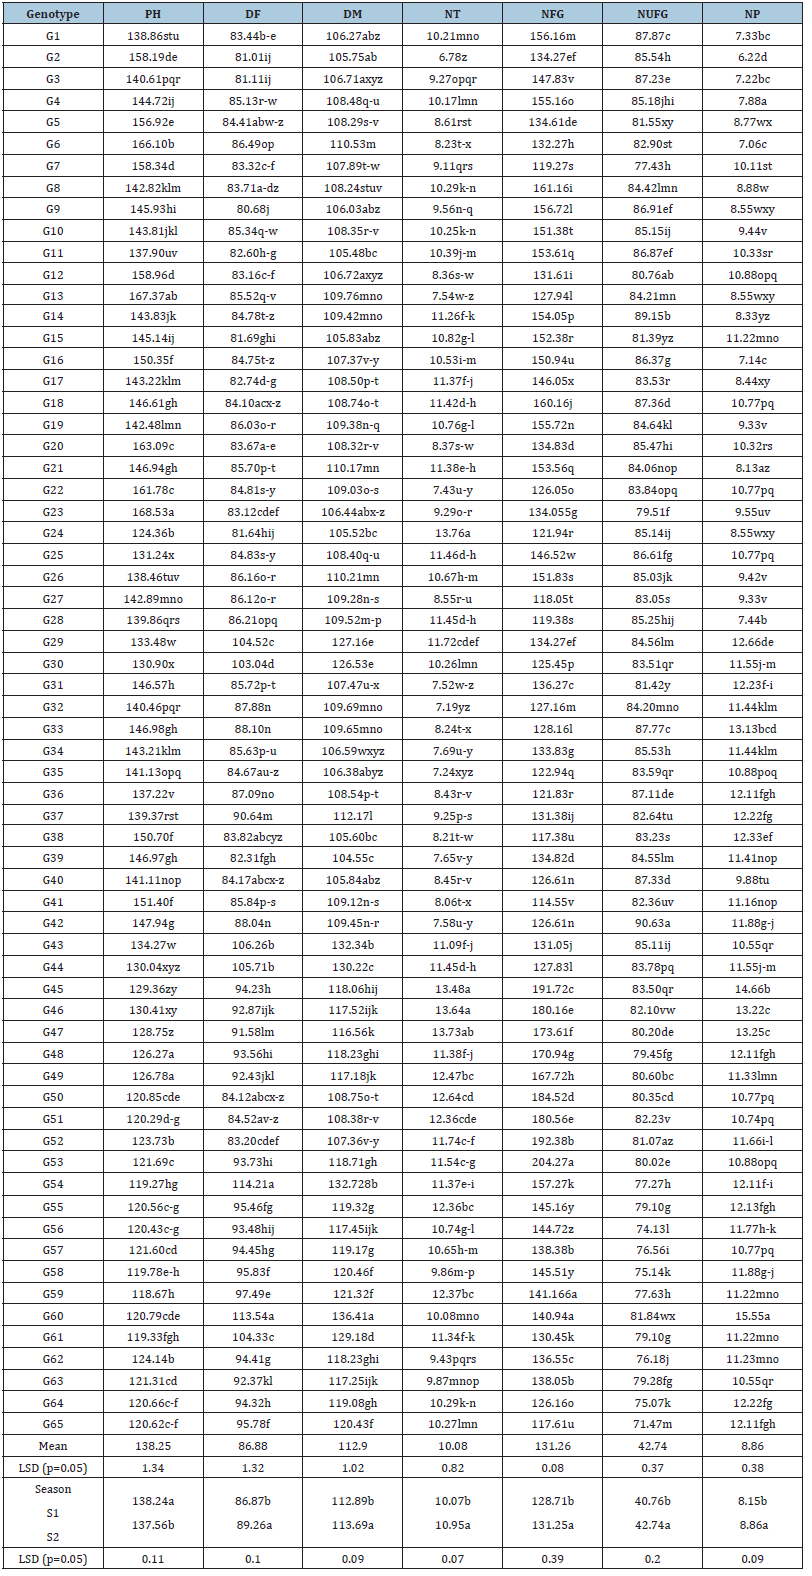
Means with the same letter in each column are not significantly different at p=0.05 using Duncan’s new multiple range test (DNMRT), PH: Plant height; DF: Days to flowering; DM: Days to maturity; NT: Number of tiller; NFG: Number of filled grain; NUFG: Number of unfilled grain; NP: Number of panicle.
Table 6:Mean performance of 65 rice genotypes for different morpho-physiological and yield traits.
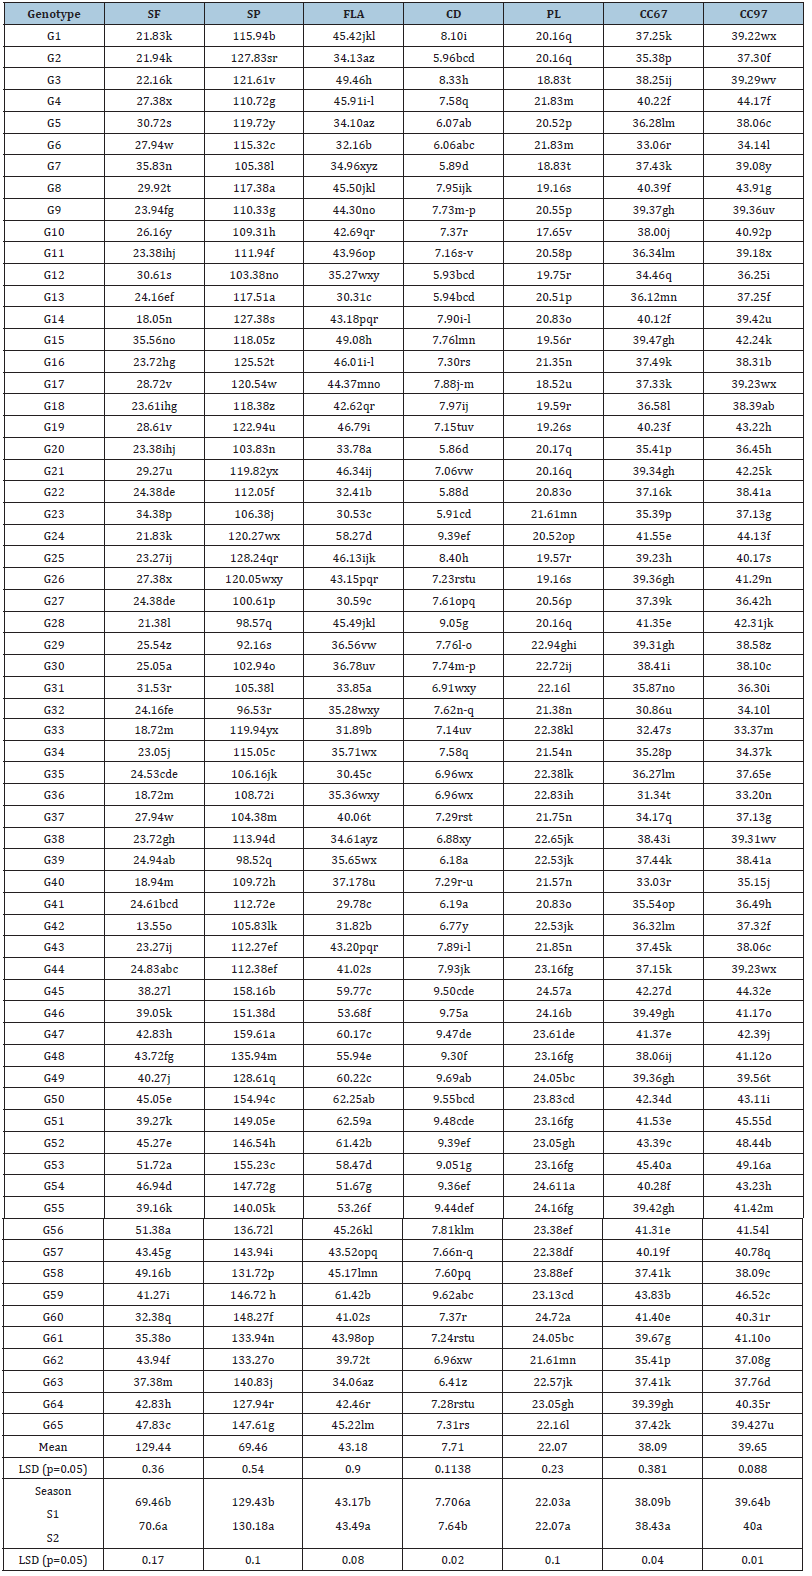
Means with the same letter in each column are not significantly different at p=0.05 using Duncan’s new multiple range test (DNMRT), SF: Spikelet fertility; SP: Spikelet per panicle; FLA: Flag leaf area; CD: Culm diameter; PL: Panicle length; CC67” Chlorophyll content after 67 days after transplanting; CC97: Chlorophyll content after 97 days after transplanting.
Table 7:Mean performance of 65 rice genotypes for different morpho-physiological and yield traits.
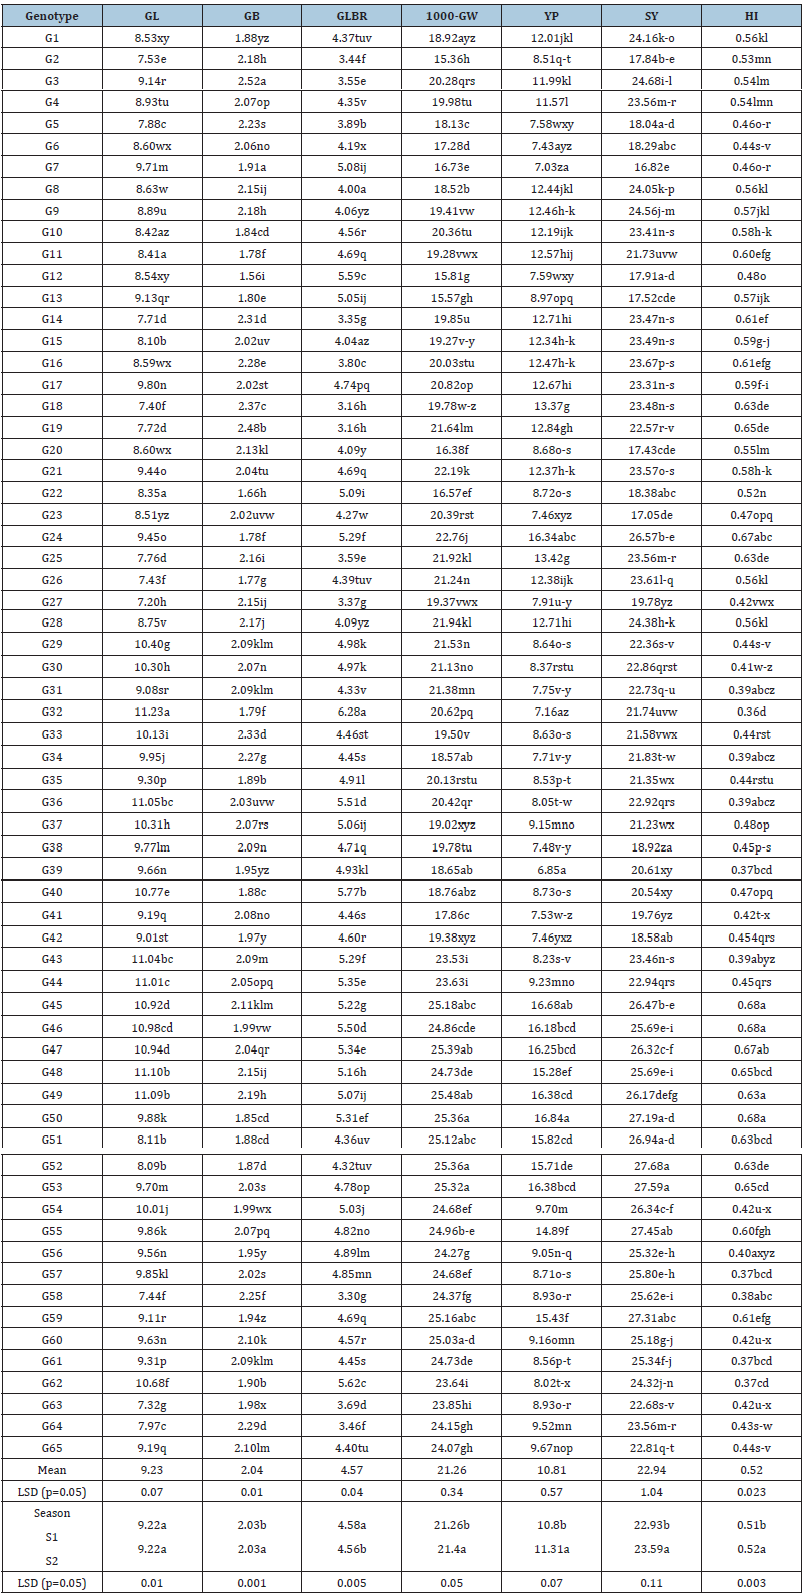
Means with the same letter in each column are not significantly different at p=0.05 using Duncan’s new multiple range test (DNMRT), GL: Grain length; GB: Grain breadth; GLBR: Grain length breadth ratio; TGW: 1000 grain weight; YP: Yield per plant; SY: Straw yield; HI: Harvest index.
Genetic factors and genotype variation
In this study, yield and yield component traits lower PCV compared to most of the growth traits showed higher are presented in Table 8. However, lower PCV belonged to days to maturity (7.12%) though yield plant-1 (30.80%) were recorded with higher value. Number of unfilled grains panicle-1 (27.56%), and flag leaf area (22.46%) were noted with higher values of PCV. Although, CC67 (7.67%), CC97 (8.43%) and grain breadth (8.98%) were found with lower values. The higher GCV was associated with yield per plant (29.74%) whereas the value was low in circumstance of days to maturity (6.85%). These results also showed constricted differences between PCV and GCV for the most of the traits. The heritability ranged from 54.30 to 99.70%. The heritability of highest and lowest were recorded at grain length and grain length breadth ratio. Grain breadth, chlorophyll content 67 and 97, spikelet per panicle and plant height were extremely heritable, all with an estimated H2>0.90 whereas other characters presented relatively low heritability. The genetic advance as present of mean (GA %) ranged from 13.60% in days to maturity to 59.17% in yield per plant. In this study, number of filled grain per panicle, number of unfilled grain per panicle, flag leaf area, harvest index, grain length breadth ratio and yield per plant presented high heritability and high genetic advance indicated the presence of additive genes governing these characters. The relative difference (RD) is the ratio of GCV in association with the respective PCV and the estimated RD values varied from 0.15% (grain length) to 26.36% for number of panicles (Table 8). Relatively low difference value between GCV and PCV was recorded for the traits like FLA (2.91%), PH (2.10%), SP (1.27%), CC67 (1.08%), GB (0.74%), CC97 (0.43%) and GLBR (0.29%) and noticed that the variation present among the traits due to the effect gene and have a better response to direct selection. On the other hand, the traits with higher difference in between their PCV and GCV values indicated the wider genetic variability due to environmental effect and not better feedback to direct selection for the improvement of traits.
Table 8:Variance components, relative difference, heritability and genetic advance of 21 quantitative traits in 65 rice genotypes.
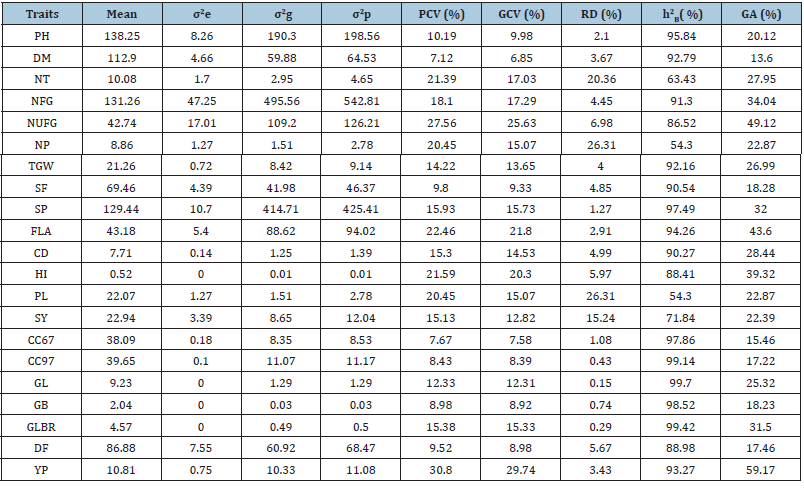
Note: σ2e , Error variance; σ2g, Genotypic variance; σ2p, Phenotypic variance; GCV, Genotypic coefficient of variation; PCV, Phenotypic coefficient of variation; RD, Relative differences; һ2B, Broad sense heritability; GA; Genetic advance.
Affiliation amongst traits
The results of utilizing proc corr SAS software version 9.4 to calculate simple Pearson’s phenotypic correlation coefficients for vegetative, yield, and yield contribute traits shows in Table 9. Most traits does not exist in isolation, rather it is an association with one another, which forms a complex relationship that ultimately influence the yield. This relationship might be whichever positive or negative. The correlation coefficient r- value gives the idea of the relationship between two distinct traits through identification of an association. The phenotypic correlation coefficient of characters ranged from -0.82 to 0.91 which indicated that there is higher magnitude of phenotypic variation. The r- value of -1, 0 and +1 indicates negative linear relationship, no liner relationship, and perfect positive linear association respectively. Strong, moderate, and low negative linear relationships are indicated by values ranging from 0.7 to 1, 0.3 to 0.7, and 0 to 0.3, respectively [15]. The levels of association among the 21 traits varied significantly at different points (Table 8). The greatest positive r-value (0.87; p<0.01) indicated a very strong correlation between days to flowering and days to maturity. The morphological characteristics of day to flowering (0.35**) and days to maturity (0.48**) were highly significantly positive correlated with yield plant-1; In contrast plant height, number of unfilled grains panicle-1, flag leaf area and grain length breadth ratio were highly significantly negatively correlated with yield plant-1. In this combined analysis, it was noticed that the physiological trait harvest index was highly significantly related to nearly all of the studied traits with exceptions of the non-significant associations of this trait: Culm diameter, grain length, grain breadth and grain length breadth ratio. Importantly, the characteristics with the strongest contribution to yield, number of filled grains panicle-1 was highly significantly positively correlated with number of tiller plant-1, 1000-grain weight, harvest index, straw yield plant-1 and yield plant-1. Consideration of higher value of genotypic coefficient of variation along with higher heritability and genetic advance is the powerful tools of selection for crop improvement than the consideration of individual genetic matrix or measuring unit. However, these traits were governed by additive genes having limited response to environment and suggestively notable for the selection procedure.
Table 9:A combined analysis for correlation coefficients among 21 quantitative traits was performed of 65 rice genotypes.
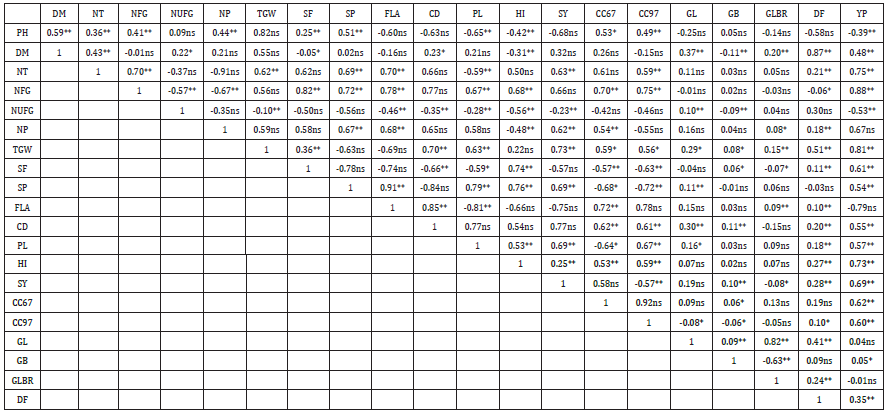
Note: *Significantly at 0.05 probability level; **highly significant at o.o1 probability level; ns: not significant; PH: Plant height; DM: Days to maturity; NT: Number of tiller; NFG: Number of filled grain; NUFG: Number of unfilled grain; NP: Number of panicle; TGW: 1000 grain weight; SF: Spikelet fertility; SP: Spikelet per panicle; FLA: Flag leaf area; CD: Culm diameter; PL: Panicle length; HI: Harvest index; SY: Straw yield; CC67: Chlorophyll content after 67 days after transplanting; CC97: Chlorophyll content after 97 days after transplanting; GL: Grain length; GB: Grain breadth; GLBR: Grain length breadth ratio; DF: days to flowering; YP: Yield per plant.
Clustering pattern/
One of the criteria for parental selection is genetic divergence analysis, in which the extent among genotype is estimated on existing diversity. Accurate information on the degree and nature of genetic variability is vital in selecting a desirable parent. In this present study, 65 rice genotypes had been magnificently clustered into eight major groups based on their quantitative traits to differentiate genotypes in population. A dendrogram was fortified based on the Ward Hierarchical Clustering (WHC) method using JMP version 1.6 SAS program. Conferring the dendrogram constructed (Figure1), the genotypes were clustered into eight groups. The dendrogram showed the similar genotypes tend to cluster together. Among the eight groups, largest number of genotypes (18) had in cluster VII, followed by cluster I with 11 genotypes and cluster III with 9 genotypes. Cluster V and VI had six genotypes. Cluster II and VIII had five genotypes and cluster IV had four genotypes presented in Table 10. Mean of the values of different clusters for the characters showed that genotypes which produced maximum flag leaf area, no. of tillers plant-1, no. of filled grains panicle-1, spikelet fertility, and yield plant-1 were accumulated in cluster V, whereas genotypes with maximum no. of panicles plant-1, panicle length, and flag leaf area were grouped in cluster VI (Table 11). The genotypes which produced less plant height and harvest index were clubbed into cluster IV, whereas minimum no. of tillers plant-1, low 1000-grain weight with low yielding genotypes were grouped into cluster VII (Table 11). Cluster analysis showed that in terms of high yield potentially cluster V (G24, G50, G51, G52, G53 and G59) had highest cluster mean of yield (16.49g), followed by cluster VI (G45, G46, 47, G48, G49 and G55 (16.37g) (Table 11). Therefore, priority should be given to genotypes aggregated in cluster V and VI having high yield potentiality for future rice breeding.
Figure 1:The association between 65 rice genotypes based on 21 variables was examined using Ward Hierarchical Clustering (WHC) method using JMP version 1.6 SAS program.
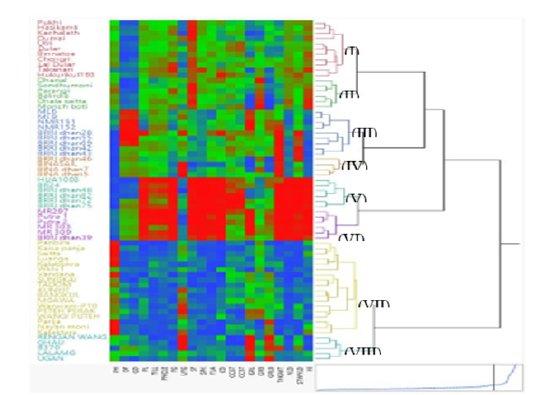
Table 10:Distribution of 65 rice genotypes into eight clusters.
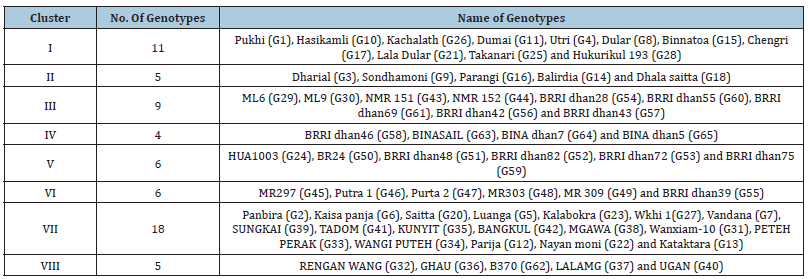
Table 11:Mean values of quantitative traits for 8 groups revealed by cluster analysis.
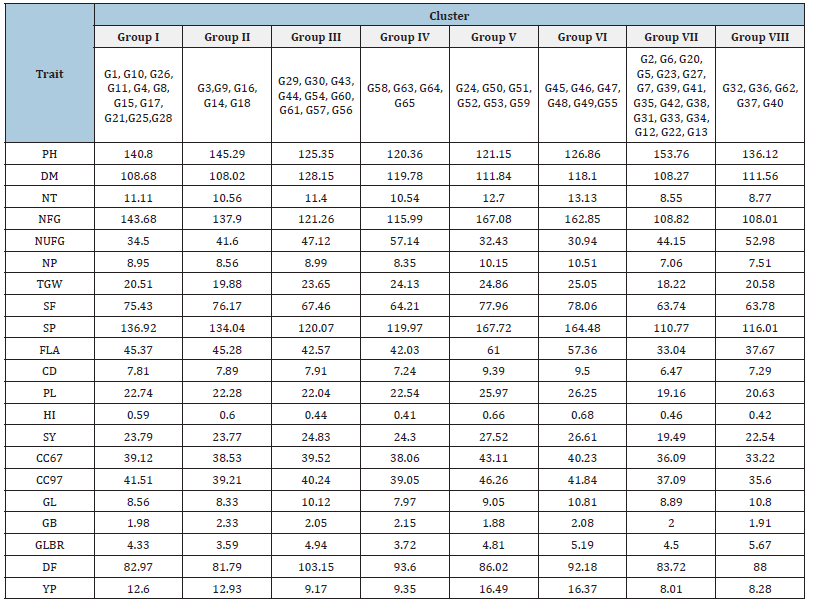
Note: PH: Plant height; DM: Days to maturity; NT: Number of tiller; NFG: Number of filled grain; NUFG: Number of unfilled grain; NP: Number pf panicle; TGW: 1000 grain weight; SF: Spikelet fertility; SP: Spikelet per panicle; FLA: Flag leaf area; CD: Culm diameter; PL: Panicle length; HI: Harvest index; SY: Straw yield; CC67: Chlorophyll content after 67 days after transplanting; CC97: Chlorophyll content after 97 days after transplanting; GL: Grain length; GB: Grain breadth; GLBR: Grain length breadth ratio; DF: days to flowering; YP: Yield per plant.
Valuation of principal component analysis
Based on the result from Table 12 it that the principal component 1 (PC1) accounted for close 56.2% of the total variation and the characters responsible for genotypes separation along this axis NP (highest 0.27), SP, FLA, NT, NFG, CD, PL and YP (gm palnt-1) with high and positive value of coefficient variation. The second principal component 2 (PC2) associated with the traits DM (maximum 0.43), NUFG, TGW, SY, GL and DF accounted for 17.19% of the total variation. About 9.24% of the total variation was detected for principal component 3 (PC3) and displayed differences based on PH, GL and GLBR (largest 0.62). The principal component 4 (PC4) accounted 4.84% of the total variation and consisted mostly of the traits NUFG, SF, SP, CD, HI, GL, GB (maximum 0.58), and YP (gm plant-1). Most of the genotypes were dispersed at low distances whereas the few were dispersed at high distances as reflected by eigenvector (Figure 2). The farthest genotypes from centroid was G2, G20, G6, G41, G33, G32, G54, G59, G51 and G24 whereas other genotypes were near to centroid. The proportion of variation for principal component (PC1) and (PC2) were 56.17% and 17.19%. respectively, in which the first principal component occupied the topmost position of the total variation excited (Table 12). PCA biplot loaded the both variables and cases (genotypes) at the same time shows how strongly each trait influences as PC and correlated to each other it also shows the how distances the genotype from each other.
Figure 2:Principal component analysis showing the relationship among 65 rice genotypes in two-dimensional graph.
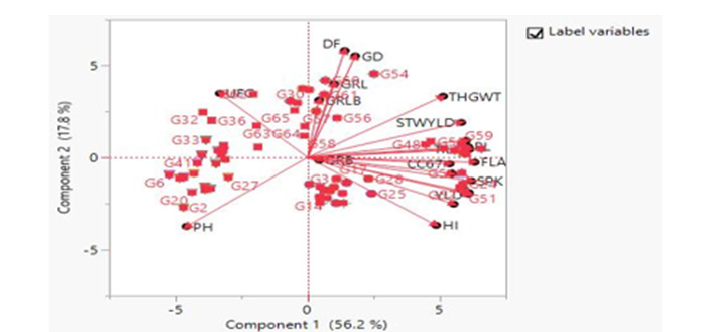
Table 12:Estimation of principal components of 21 traits in 65 rice genotypes.
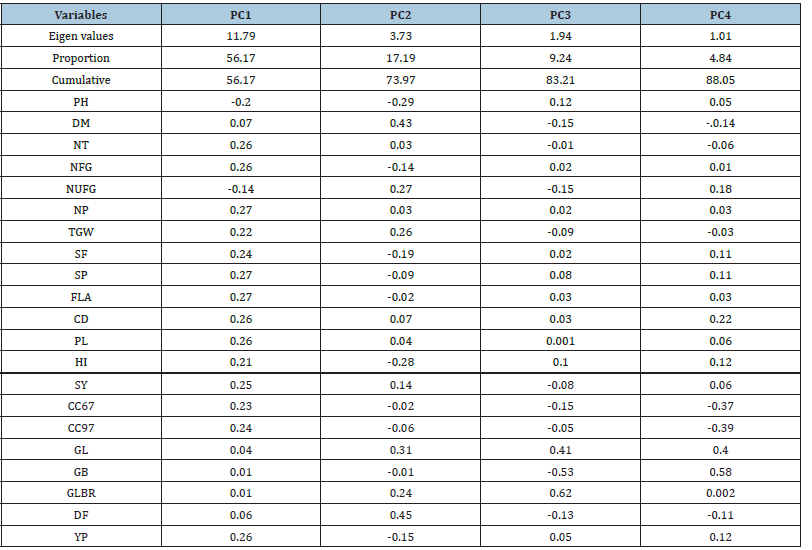
Note: PC1: First principle component; PC2: Second principle component; PC3: Third principle component; and PC4: Fourth principle component.
Discussion
In the present study, all the traits showed highly significant (P < 0.01) variations among 65 rice genotypes, which originated in different countries. Results are in close settlement with those of [16] who noted highly significant variability among the different rice genotypes [17]. Also gives parallel support to the present judgements. The judgements of [18] and [19] further strengthen the current judgements, who also found highly and valuable significant and positive variability among their studied genotypes. The reliance of grain yield on other traits has been reported for many crops [20]. Yield is a complex and quantitatively inherited trait that depends on other yield contributing characteristics that are influenced by genetic effects. Therefore, knowledge of the correlation coefficient between different traits is essential for the design of an effective hybridization programme. The highly significant and strong positive correlations between days to flowering and days to maturity positive correlated with yield plant-1 in contrast plant height, number of unfilled grains panicle-1, flag leaf area and grain length breadth ratio were highly significantly negatively correlated with yield plant-1. A positive (0.32**) and significant correlation was also found between the day to flowering and the days to maturity by [21]. The number of filled grain panicle-1 was positively and highly significantly correlated with the number of tiller plant-1, 1000-grain weight, harvest index, straw yield plant-1 and yield plant-1, and these findings were consistent with and supported by those of [22] and [21]. The vital plant characteristics yield plant-1 was significantly and positively correlated with nearly all of the traits. Similar findings have also been observed by many researchers [23,24]. These researchers have recorded significant positive correlations of the majority on morphological traits with yield in rice plants. Correlations between traits are important because they help the breeder to select important characteristics from the studied traits [25]. The majority of traits, including yield and yield contributing traits are influenced by interactions the genotype and environment, and therefore, the use of correlation coefficients make selection easy or plant breeders [25]. The correlation coefficients implied that days to flowering and days to maturity, straw yield plant-1, harvest index, number of tiller plant-1, number of filled grains panicle-1 and 1000-grain weight should be considered during selection to improve yields and other desirable agronomic characteristics.
The genetic analysis of quantitative traits is a pre-requisite for plant breeding pro-grammes and can lead to a systematic method of design and the appropriate planting of plant breeding strategies. The current study suggests that the phenotypic coefficient of variance was greater than the genotypic coefficient of variance for all the traits. Similar results were reported for all the traits observed in another study [26]. This study reported that the trait is magnitude of the differences between the genotypic and phenotypic coefficients of variation, that is, large of differences reflect a substantial environmental effect, and small differences indicate a strong genetic influence. In the present study, the small differences between the phenotypic coefficient of variance and genotypic coefficient of variance for most of the traits. These small differences also suggest that selection based of these characters will not be effective in future crossing pro-grammes. The other traits, which showed a higher difference between phenotypic coefficient of variance and genotypic coefficient of variance, indicated that the environmental effect on the expression of those traits was higher and that selection based on these characters will not be effective for further yield improvement. The highest phenotypic coefficient of variance was recorded for yield plant-1 and number of unfilled grain panicle-1 in the present study. These traits were recorded by the following researchers [27-29].
The variables number of filled grain per panicle, number of unfilled grain per panicle, flag leaf area, harvest index, grain length breadth ratio and yield plant-1 exhibited grater higher heritability’s and thus indicated the presence of additive gene actions. This characteristics exhibited very high heritability’s coupled with the greatest genetic advance, which suggested that these traits were mainly under genetic control and that they can be scored according to their phenotypic performances [10]. estimated high heritability and genetic advances for the parameters of days to 50% heading, days to maturity, flag leaf area, panicle length, no. of branches panicle-1, no. of seeds panicle and seed weight panicle-1 at seed yield. The 65 traditional and commercial rice genotypes clustered into eight groups based on the dendrogram from the cluster analysis and principal component analysis. The groupings from the hierarchical cluster analysis exhibited a dendrogram topology and cluster memberships that were similar to those produced based on the principal component analysis, which confirmed the accuracy of the constructed dendrogram. Fifty-eight rice varieties were grouped into four clusters based on 18 morphological characters in a study by [30]. Similarly, [31] calculated a similar clustering pattern based on hierarchical cluster analysis and principal component analysis for 24 rice genotypes. Principal component analysis indicated diversity among 65 rice genotypes. “Proper values” measure the importance and contribution of each component to total variance, whereas each coefficient of proper vectors indicates the degree of contribution of every original variable with which each principal component is associated. The higher the coefficients are, regardless of the direction (positive or negative), the more effective they will be in discriminating between genotypes. In the present study, the first four principal components accounted for 56% of the total variation, which indicated very strong correlations between the examined characteristics. Similarly, [32] explained 61.2% of the total variability using the first and second principal components. Approximately 82.7% of the total variation of rice varieties was also explained by [33]. The present investigation highlighted that the genotypes originated from the Bangladesh could be hybridized with the genotypes from Malaysia, Philippines, India and vice versa to create broader genetic variation to improve yield and other favourable characteristics.
Conclusion
Knowledge of the performance of rice genotype individually is crucial in selecting the best genotypes for varietal improvement. The sixty-five studied rice genotypes varied with respect to their morpho-physiology and yield performances as well as pungency level. The extent of genetic variation indicated that they might be derived from multiple origins. The development of rice genotypes that could lead to sustainable yield production rests on exploring genetic aspects of its morphological traits. This is because genetic variability provides room for recombinant that is crucial in varietal development. The 65 studied rice genotypes varied with respect to their morpho-physiology and yield performance as well as pungency level. The extent of genetic variation indicated that they might be derived from multiple origins, indicating their different sources. The prevalence of genetic variance for morpho-physiological traits studied such as 1000-grain weight, number of filled grain panicles-1, number of empty grain panicles-1, flag leaf area, grain length, harvest index, grain length breadth ratio, and yield plant-1 can be exploited through selection exhibited by the estimate of high heritability and high genetic advance. These findings provide an insight into genetic diversity for future references. Considering diversity pattern and other morphological performances Clusters V and VI may be further utilized in different breeding program for varietal improvement or development in future.
Acknowledgement
The authors are grateful to the Ministry of Agriculture (MoA), Bangladesh Agricultural Research Council (BARC-Project of NATP Phase-II), Bangladesh Rice Research Institute (BRRI) of the People’s Republic of Bangladesh. Thankfulness also goes to University Putra Malaysia (UPM), Malaysia.
Funding
Bangladesh Agriculture Research Council, Ministry of Agriculture, Bangladesh [PIU-BARC, NATP-2] and University Putra Malaysia-under the research grant ID- 6282519
Author’s contributions
Conceptualization, Mohammad Anisuzzaman and Mohd Rafii; Data curation, Mohammad Anisuzzaman; Formal analysis, Mohammad Anisuzzaman and Md Mahmudul Hasan Khan; Funding acquisition, Mohammad Anisuzzaman and Mohd Rafii; Investigation, Shairul Izan Ramlee and Noraini M. Jaafar; Methodology, Mohammad Anisuzzaman and Mohd Rafii; Supervision, Mohd Rafii; Validation, Mohd Rafii; Writing-original draft, Mohammad Anisuzzaman; Writing-review & editing, Mohammad Anisuzzaman, Ferdouse Ikbal, Azadul Haque and Md Mahmudul Hasan Khan.
Conflict of Interest
There is no conflict of interest.
References
- (2019) FAOSTAT: Food and Agriculture Organization Statistics. FAO database for Rice Production. FAO, Rome, Italy.
- Botwright ATL, Wade LJ (2012) Genotype×environment interactions for root depth of wheat. F Crop Res 137: 117-125.
- Man TK, Chua LYA, Radzi AM, Gong R (2019) Behind the blackboard: How basic indicators mask gaps in quality of education.
- Akinbile CO, Abd El-Lat KM, Abdullah R, Yusoff MS (2011) Rice production and water use efficiency for self-sufficiency in Malaysia: A review. Trends Appl Sci Res 6: 1127-1140.
- Azeez MA, Adubi AO, Durodola FA (2018) Landraces and crop genetic improvement. Rediscovery Landraces as A Resour Futur, pp. 1-20.
- Bhanu AN, Srivastava K, Bhandari HR, Singh MN, Shreya, et al. (2017) Assessment of genetic diversity in crop plants-An overview. Adv Plants Agric Res 7(3): 279-286.
- Iqbal T, Nazir A, Iqbal H, Muhammad Zia, Saad S, et al. (2018) Genetic Variability, correlation and cluster analysis in elite lines of rice. J Sci Agric 2: 85.
- Lei Q, Zhou J, Zhang W, Luo J, Wu K, et al. (2018) Morphological diversity of panicle traits in Kam fragrant glutinous rice (Oryza sativa). Genet Resour Crop Evol 65: 775-786.
- Rahayu S, Dewi AK, Suwarno WB, Ghulamahdi M, Aswidinnoor H (2020) Genetic diversity of panicle morphological traits of rice (Oryza sativa). IOP Conf Ser Earth Environ Sci, Volume: 484.
- Adhikari BN, Joshi BP, Shrestha J, Bhatta NR (2018) Genetic variability, heritability, genetic advance and correlation among yield and yield components of rice (Oryza sativa). J Agric Nat Resour 1(1): 149-160.
- Aminu D, Bello OB, Gambo BA, Azeez AH, Agbolade JO, et al. (2017) Varietal performance and correlation of okra pod yield and yield components. Bangladesh J Plant Breed Genet 29: 11-20.
- Ratna M, Begum S, Husna A, Dey S, Hossain M (2015) Correlation and path coefficients analyses in Basmati rice. Bangladesh J Agric Res 40: 153-161.
- Tiruneh A, Gebrselass W, Tesfaye A (2018) Genetic diversity study on upland rice (Oryza sativa) genotypes based on morphological traits in southwestern Ethiopia. Asian J Crop Sci 11: 17-24.
- Oladosu Y, Rafii MY, Abdullah N, Abdul MM, Rahim HA, et al. (2014) Genetic variability and selection criteria in rice mutant lines as revealed by quantitative traits. Sci World J 2014: 12.
- Oladosu Y, Rafii MY, Magaji U, Abdullah N, Miah G, et al. (2018) Genotypic and phenotypic relationship among yield components in rice under tropical conditions. Biomed Re Int 2018: 8936767.
- Bhandari A, Sandhu N, Bartholome J, Cao HTV, Ahmadi N, et al. (2020) Genome-wide association study for yield and yield related traits under reproductive stage drought in a diverse indica-aus rice panel. Rice 13(1): 53.
- Ghosal S, Casal C, Quilloy FA, Septiningsih EM, Mendioro MS, et al. Deciphering genetics underlying stable anaerobic germination in rice: phenotyping, QTL identification, and interaction analysis. Rice 12: 50.
- Ramesh C, Pradhan S, Sanjay S, Lotan B, Singh O (2014) Multivariate analysis in upland rice genotypes. World J Agric Sci 33: 295-300.
- Sabar M, Arif M (2014) Phenotypic response of rice (Oryza sativa) genotypes to variable moisture stress regimes. Int J Agric Biol 16: 32-40.
- Bailey SJ, Parker JE, Ainsworth EA, Oldroyd GED, Schroeder JI (2019) Genetic strategies for improving crop yields. Nature, 575(7781): 109-118.
- Copley TR, Duceppe MO, O’Donoughue LS (2018) Identification of novel loci associated with maturity and yield traits in early maturity soybean plant introduction lines. BMC Genomics 19: 167.
- Navea IP, Dwiyanti MS, Park J, Kim B, Lee S, et al. (2017) Identification of quantitative trait loci for panicle length and yield related traits under different water and P application conditions in tropical region in rice (Oryza sativa). Euphytica 213: 1-14.
- Herron SA, Rubin MJ, Ciotir C, Crews TE, Van T, et al. (2020) Comparative analysis of early life stage traits in annual and perennial Phaseolus crops and their wild relatives. Front Plant Sci 11: 34.
- Shah L, Yahya M, Shah SMA, Nadeem M, Ali A, et al. (2019) Improving lodging resistance: using wheat and rice as classical examples. Int J Mol Sci 20(17): 4211.
- Neyhart JL, Lorenz AJ, Smith KP (2019) Multi-trait Improvement by predicting genetic correlations in breeding crosses. G3 (Bethesda) 9(10): 3153-3165.
- Tiwari DN, Tripathi SR, Tripathi MP, Khatri N, Bastola BR (2019) Genetic variability and correlation coefficients of major traits in early maturing rice under rainfed lowland environments of Nepal. Adv Agric 1-9.
- Lipi L, Hasan M, Akter A, Quddus M, Biswas P, et al. (2021) Genetic variation, heritability and genetic advance in some promising rice hybrids. SAARC J Agric 18(2): 39-49.
- Hannan A, Rana M, Hoque M, Sagor G (2020) Genetic variability, character association and divergence analysis for agro-morphological traits of local rice (Oryza sativa ) germplasms in Bangladesh. J. Bangladesh Agric Univ 18: 1.
- Khalid AO, Kyung HK, Ahmed AES, Yassir MA, Sara MA (2020) Assessment of genetic variability for yield and attributed traits among rice doubled haploid (DH) lines in semi-arid zone Sudan. African J Agric Res 16(7): 939-946.
- Tuhina KM, Hanafi MM, Rafii YM, Wong MY, Salleh FM, et al. (2015) Genetic variation, heritability, and diversity analysis of upland rice (Oryza sativa L.) genotypes based on quantitative traits. Biomed Res Int, p. 290861.
- Ahmed M, Rashid E, Akter N, Khalequzzaman M (2019) Morphological characterization and diversity of T. Aman rice germplasm of Bangladesh. Bangladesh Rice J 22(2): 13-22.
- De SCC, Beckman SP, Liu S, Bowler N (2019) Principal component analysis (PCA) as a statistical tool for identifying key indicators of nuclear power plant cable insulation degradation. Miner Met Mater Ser, pp. 1227-1239.
- Akinola TF, Odiyi AC, Fayeun LS, Ohunakin AO (2019) Genetic variability and genetic diversity of 13 upland rice genotypes for agronomic traits and nutritional qualities. J Agric Sci Bot 3(1): 6-11.
© 2023 Mohammad Anisuzzaman. This is an open access article distributed under the terms of the Creative Commons Attribution License , which permits unrestricted use, distribution, and build upon your work non-commercially.
 a Creative Commons Attribution 4.0 International License. Based on a work at www.crimsonpublishers.com.
Best viewed in


.jpg)


 Editorial Board Registrations
 Submit your Article
 Refer a Friend
 Advertise With Us
.jpg)


.jpg)


.bmp)
.jpg)
.png)
.jpg)


.jpg)


.png)

.png)


.png)


