- Submissions

Full Text
Journal of Biotechnology & Bioresearch
Application of NIR Spectroscopy to Evaluate the Soil Fertility at the Field Scale
Bogdan Kulig1*, Mirosław Zagórda2, Andrzej Lepiarczyk1, Andrzej Oleksy1, Marek Kołodziejczyk1 and Anna Slizowska1
1Department of Agroecology and Crop Production, University of Agriculture, Krakow, Poland
2Department of Machinery Management, Ergonomics and Production Processes, University of Agriculture, Krakow, Poland
*Corresponding author: Bogdan Kulig, Department of Agroecology and Crop Production, University of Agriculture, Krakow, Poland
Submission: November 06, 2020;Published: December 09, 2020

Volume2 Issue4December, 2020
Abstract
The Near Infrared Reflectance Spectroscopy (VIS-NIRS) allows for quick analysis of soil abundance in basic macronutrients and development of fertilizer application maps. This article compares the results for pH and soil abundance in available forms of phosphorus, potassium and magnesium estimated using near-infrared spectroscopy in the 580-1850nm range and on the basis of standard laboratory methods. Soil samples were taken from a field of 20.6ha, from the surface of each polygon defined by a grid of squares with sides of 50x50m. The total soil sample (80) assigned to the square 50x50m taken from the arable layer to a depth of 0.2m. The constructed models must be then subjected to validation using an independent set of samples. In the presented experiment the samples were randomly divided into two equal sets, 40 samples each. A simple correlation analysis was conducted in order to estimate the correlations between the results obtained using standard methods and the spectrophotometry. The results were shown high relationship between values obtained by using NIRS and laboratory methods. Coefficients of determination computed for model calibration on the basis of linear regression, which for the soil pH, K content and subsequently for Mg and P was obtained, respectively: R2=0.90; R2=0.91; R2=0.83; R2=0.86. The results show the lower coherence of NIRS results with laboratory results for pH and K2O, followed by Mg and P2O5 for model verification. Determination coefficients in this case were as follows: R2=0.56; R2=0.54; R2=0.51 and R2=0.48. The fertility maps developed on the basis of laboratory analyses and by means of InfraXact™ device differed by 19% for phosphorus and 7,25% (relative root square error for area of fertility classes) for potassium.
Keywords: VIS-NIRS; P; K; Mg; Soil fertility; Abundance maps
Introduction
Increasingly greater popularity of Visible and Near Infrared Reflectance Spectroscopy (VIS-VIS-NIRS) has been observed over the recent years for estimating soil fertility in basic macroelements Chodak M, et al. [1]. As a research (analytical or diagnostic) tool, VIS-NIRS method has a considerable advantage over typical laboratory methods. A single analysis takes only a few minutes and results are available at once Baeten V, et al. [2]. VIS-NIRS is a reliable and effective measurement tool that could be used to predict soil properties, and particularly SOM that is the key to evaluate soil fertility or soil quality Freschet, et al. (2011), Romsonthi C, et al. [3]. Implementation of precision agriculture technologies initially incurs considerable expenditures, not only on the equipment, but in the first place on gathering detailed data about the field, including necessary investigations on the available macroelement content. Advantages from spatially variable fertilizer application are conditioned by the obtained yields and expenditures Kulczycki G, et al. [4]; Walczykova M, et al. [5].
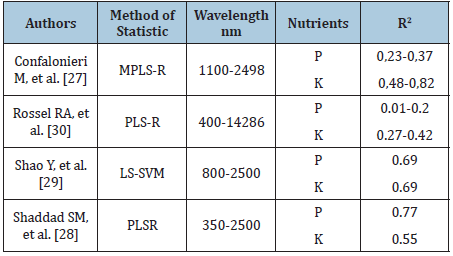
Table 1 shows the selected retrieving articles on the possibility to use VIS-NIR spectroscopy to determine the rapid content of phosphorus and potassium in the soil. Presented paper aimed to test the potential applications of visible and near reflectance spectroscopy (580-1850nm, VIS-NIRS-InfraXact™) for estimating soil fertility in basic macroelements (P, K and Mg) and compare the obtained results with those obtained at Chemical Agricultural Station using standard methods, as an important element of application maps preparation for precision agriculture.
Table 1: Selected articles presented application of differentiated methods to estimation of P,K-concentrations in soil using VIS-NIR spectroscopy.
Materials and Methods
The 80 soil samples were collected from 20.6 ha field situated in Brzezinka village near Krakow (N50 08 33, E19 43 52). It was a heavy soil with 5% content of sand, 53.3% silt and 41.7% clay. The relief of the field is hilly and the altitude is in the range of 270-290m. The soil in these fields is classified as heavy, compact and difficult to cultivate. The material for analyses was collected from the surface of each polygon demarcated by a grid of squares with sides 50m (80 averaged samples, each consisting of 18 primary samples - Figure 1). The samples were dried to constant mass, finely ground and sifted (2mm). Analyses of P, K, Mg and pH were conducted using standard methods at the Chemical Agricultural Station in Krakow, i.e. pH by potentiometric method, K and P by Egner-Riehm method and Mg by ASA method. The spectrum of the examined soil was determined in 2012 on InfraXact™ device made by FOSS, within the 580-1850 nm with 2nm step. The samples were divided into two sets, 40 samples for calibration and 40 for verification file. The preprocessing data and calibration models were made by means of WINISI 4.0 programme using the settings presented in Table 2. Whole spectrum were used to the construction of calibration models. The outliers (samples with an H-value >3) were not included for developing of models, as well as were excluded from validation file.
Figure 1: Location of experimental polygons (a) and altitude map of the field (b) in Brzezinka (N50 08 33, E19 43 52).

Table 2: Parameter settings of the WINISI program for data preprocessing and calibration for individual elements.

Descriptive statistics and correlation analysis were the statistical tools applied to compare both methods, moreover statistical measures most commonly used for such comparisons were computed: Bias (arithmetic error); SEC (standard error of calibration), SEP (standard error of prediction), RPD (relative estimation error) and RER (ratio of error range). Ranges of values R2, RPD and RER for various degrees of calibration accuracy were found in works Williamms PC [6] & Nduwamungu C, et al. [7]. In case of precision agriculture technology, the final result of soil analyses is the applications map created on the basis fertility map. The obtained results spatial distribution of soil fertility were prepared graphical for two groups of samples (Lab, VIS-NIRS) using Farmworks program.
Results
Comparison of soil chemical properties for the calibration and validation files was presented in Tables 3 & 4. Values of pH ranged from 4.0 to 5.5 in the soil samples determined both by a laboratory method and for the data estimated by means of VIS-NIRS method. Therefore, according to the acidification degree it was strongly acid and acid soil. The analysis of pH comprised 37 samples, for which H coefficient value (spectral distance from mean of population) did not exceed 3, whereas only 33 samples were analyzed for lead (P content using the same index). Mean soil fertility in P for the calibration file samples was on the level of 71.2mg kg-1 of soil according to VIS-NIRS method and 76.1mg kg-1 of soil for the standard method. The coefficient of variation ranged from 18.6 to 18.3%, respectively for both methods. The range of values for both determination methods fell within the classes from low to very high. In case of potassium the range of variability was smaller, i.e. from medium class to very high. For magnesium the variability ranged from very low to high. The range of values for potassium was from 133.0 to 278.0mg kg-1 of soil for VIS-NIRS method, whereas slightly lower values were registered by Egner-Riehm method. A slight underestimation using VIS-NIRS method in comparison with the standard method was noticed for magnesium. Calibration for both elements considered respectively 37 and 34 samples.
Table 3: Descriptive statistics for calibration file to estimation of soil fertility using standard methods and VIS-NIR.

Table 4: Descriptive statistics for the validation file of the estimation of soil fertility using standard methods and VISNIR.

Analysis of the validation dataset (Table 4) shows, that the soil pH values were on a similar level, respectively from 4.0 to 5.5 for the soil samples determined by the laboratory method, whereas the range was slightly smaller for the data estimated by means of VIS-NIRS (4.1-5.2). It was strongly acid or acid soil. The analysis of soil pH covered 31 samples depending on the element (H<3). The divergences were much greater for the other elements. Average fertility in P was on the level of 76.1mg kg-1 of soil for VIS-NIRS and 71.2mg kg-1 of soil for the standard method. The coefficient of variation also looked different, respectively 15.3 and 21.8% for both methods. The range of values according to both methods fell within the classes from medium to very high and from low to very high according to both VIS-NIRS and standard method. In case of potassium the range of variation was smaller, from medium to high class. It has been evidenced by a relatively low value of the variation coefficient (10.2 and 14.7%). In case of magnesium, its content variability fluctuated within a wide range-from very low to high content. The range of values was from 27.2 to 124.0mg kg-1 of soil the laboratory method, whereas slightly higher values were registered by the spectrophotometry.
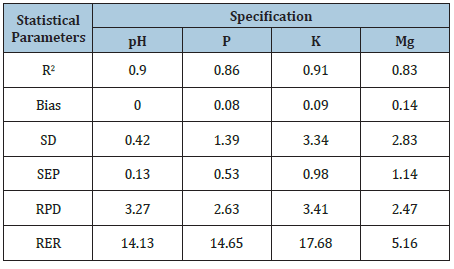
A simple correlation analysis was conducted in order to estimate the correlations between the results obtained using standard methods and the spectrophotometry. The results were shown in Figures 2 & 3. In case of calibration, the best consistency of results between VIS-NIRS and laboratory methods was obtained for the soil pH, K content and subsequently for Mg and P. Coefficients of determination computed for calibration on the basis of linear regression were as follows: R2=0.90; R2=0.91; R2=0.83; R2=0.86 (Table 5). Cross validation of the element content and pH values conducted on a second set of samples (validation file) revealed the best consistency of VIS-NIRS results with laboratory results for the soil pH and K content, and subsequently for Mg and P. The coefficients of determination calculated for the validation on the basis of linear regression were as follows: R2=0.56; R2=0.51; R2=0.54; R2= 0.48. In the researches of Hively WD, et al. [8], the hyperspectral reflectance imaging was performed for six cultivated (soils) fields using an aerial imaging spectrometer (400-2450nm, resolution 10nm, spatial resolution 2.5m). Soil surface samples (269 for calibration and 46 for verification) were analyzed for carbon content, particle size distribution and 15 agriculturally important elements (Mehlich-III extraction).
Figure 2: Diagrams showing relationships between pH values and available phosphorus content (mg kg-1) determined by standard methods and by near infrared spectroscopy (calibration on the left, validation on the right).
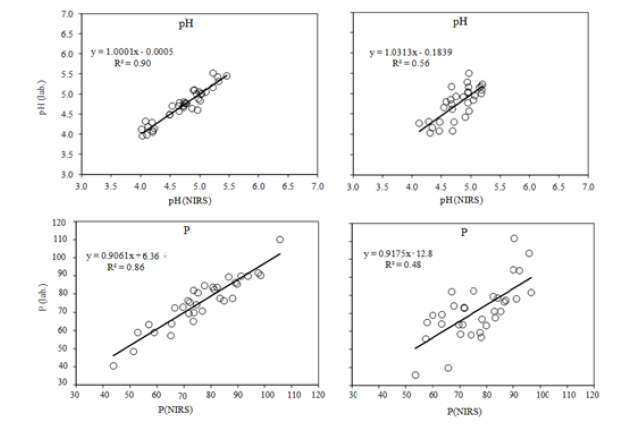
Figure 3: Diagrams showing relationships between the contents of available magnesium and potassium forms (mg·kg-1 of soil) determined by standard methods and by VIS-NIR method (calibration on the left and validation on the right).
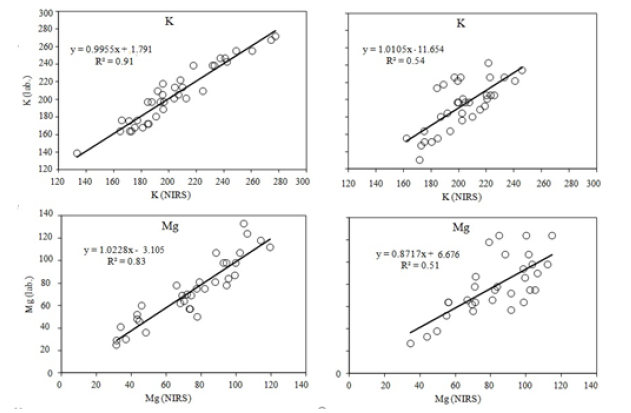
Table 5: Statistical parameters assessing calibration reliability.
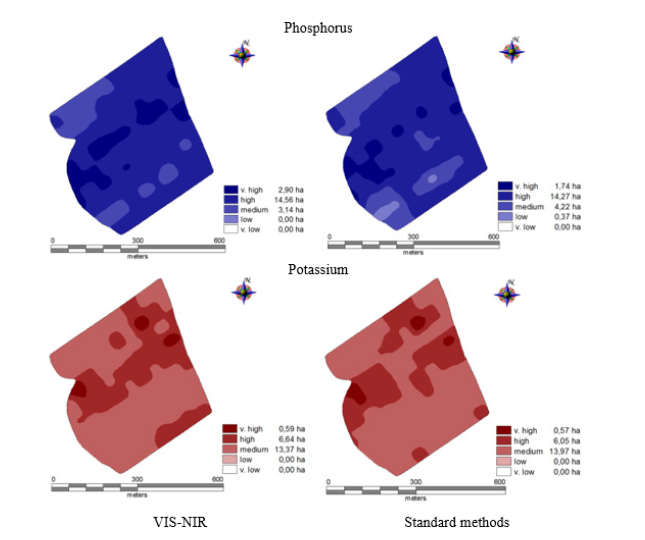
The comparison of 15 methods of mathematical spectrum pre-processing showed that the first derivative worked well for almost all analytes. The obtained models explained from 51% (pH) to 59% (K) of the component concentration variability in the collected soil samples determined using standard methods Basing on the obtained results of analysis of soil fertility in macronutrients conducted by the laboratory method (traditional) and VIS-NIRS spectroscopy, soil fertility maps of the studied field were prepared (Figure 4). A detailed analysis of prepared maps showed slight differences between the areas of respective fertility classes assessed by the traditional method and VIS-NIRS. The results of the values of area for particle fertility classes computed from the maps were predicted with relative root square error (RRMSE)19% for phosphorus and 7,25% for potassium.
Figure 4: Fertility maps for phosphorus and potassium.
Discussion
Many research teams have been using VIS-NIR spectroscopy over the recent years to determine soil physicochemical properties, both in the macroscale Askari MS, et al. [9], Gomez C, et al. [10], Lee WS, et al. [11], Nduwamungu C, et al. [7] and at the field scale Dor EB, et al. [12], Cécillon L, et al. [13], Debaene G, et al. [14-16], Kuang B, et al. [17], Mouazen AM, et al. [18].
Askari MS, et al. [19] analysed soils in 40 localities in Ireland using both standard methods and spectrometry. At each site twenty-one chemical, biological and physical properties were estimated. VIS and NIR spectra (400-2500nm) were then measured and partial least-squares regression used to predict soil quality indicators associated with soil structural quality. An excellent model adjustment was achieved for SOC (RPD>4, R2=0.94). A good model was obtained for Mg, and CN (RPD from 2 to 2.5, R2≥0.7), and moderate capability for prediction of aggregate size distribution, and penetration resistance (RPD from 1.5 to 1.99, R2≥0.64). Chang CW, et al. [20], defined only three classes of model adjustment on the size of RPD: category A (RPD>2) describes models that can accurately predict the soil property, category B (2>RPD>1.4) describes models with limited predictive power and category C (RPD<1.4) describes models that have no prediction ability. Both validation methods qualify the field calibrations conducted in the paper as at least useful for pH (R2=0.90) and very good potassium (R2=0.91). Gomez C, et al. [10] used the 400-2500nm wavelength range for estimating the share of clay, silt, sand, C-org, pH and CEC. The samples for analyses were collected from the area of 24.6km2, from 8 types of soils. The authors found that the hyperspectral data were useful for the calibration of 4 out of 8 studied soil physicochemical properties (i.e. CaCO3, iron, clay and CEC). The soil pH was predicted with a much better model adjustment, since prediction R2 was only 0.31, whereas in our investigations R2 for calibration was 0.9 and for validation 0.56. Sanchez PA, et al. [21] tested 180 samples from 3 soil types, in the spectrum range 400-2498nm (every 2nm), determining among others P, K, Mg and Ca content and soil pH. The authors obtained the validation file fit within the range from 0.24 for potassium to 0.78 for pH. Zornoza R, et al. [22] confirmed the lower accuracy of the VIS-NIRS method in estimating the following soil properties pH and content of P and Na. Another factor influencing the model adjustment may be other range of pH values (6.5 to 9) as compared to 4.0-5.5 in our paper. Despite diversified pH range, the variation coefficient calculated for this feature was approximate (c.a. 9%).
Kuang B, et al. [17] studied fresh soil samples collected from farms in the Czech Republic, Germany and Denmark. The samples were scanned with a fibre-type Vis-NIR spectrophotometer (306-1711nm). Then the spectra were divided into calibration (70%) and validation (30%) files. Except for the Czech Republic farm, individual farm models provided successful calibration for total carbon (TC), total nitrogen (TN) and organic carbon (OC), with coefficients of determination (R2) of 0.85-0.93. Scanning fresh samples is the fastest way to get information about the soil fertility. It is still better when the analyses are performed on-line by the mini spectrometer installed e.g. behind the ploughshare. Such solution was suggested by Mouazen AM, et al. [23] who tested it on the field with area of 0.7ha. The authors obtained calibration equations on the level of R2 0.71 for pH and 0.73 for exchangeable phosphorus.
Long term experiments were conducted in Poland Debaene G, et al. [16] at IUNG-PIB in Puławy to analyze soil spectral properties (350-2220nm) in order to develop prediction models of selected soil properties: soil organic carbon (SOC), N, pH, P2O5, K2O, Ca, Mg, K, and Na content in loamy and sand soil. Like in the previous research the Authors used for calibration full dataset with cross-validation. The best results were obtained for SOC and N content prediction (R2=0.76, RPD=2.02 and R2=0.81, RPD=2.20, respectively). For the soil pH and nutrient content (P, K and Mg) R2 coefficients for calibration equations for 30 samples were similar as in the presented investigations, respectively 0.85; 0.89; 0.90 and 0.74 (calibration) and 0.80, 0.45 and 0.40 (validation), REP: 1.17-1.87. In the previous experiments Debaene G, et al. [14] demonstrated that VIS-NIRS method may be successfully used for estimating the nutrient content in order to develop application maps to be used for variable rate fertilizer application (VRT) in precision agriculture. Presented research demonstrated that also devices with a smaller spectrum range of measurement (InfraXact FOSS 580-1850nm) may be successfully applied for estimating soil fertility in macroelements and determining soil pH.
Basing on statistical measurement ranges assessing the model usefulness for estimating soil fertility described in the methods chapter, and after taking intervals of soil fertility and not direct values of macroelements content , a moderate usefulness of performed calibrations for determining soil fertility in the available forms of macroelements may be stated [24-26]. The operating range of InfraXact device is sufficient for performing efficient calibration. It seems that research on a wider group of soils with a greater range of the macroelements content could significantly improve the prediction parameters.
Conclusion
The obtained results indicate a considerable usefulness of VISNIRS method within the spectrum range of 580-1850 (InfraXact) for estimating the content of available forms of phosphorus and potassium, and soil pH, which after previous calibration allows for a fast conducting of the required analyses and developing fertilizer application maps on their basis [27-30]. The application maps developed on the basis of laboratory analyses and by means of InfraXact™ apparatus made by FOSS differed by 19% for phosphorus and 7,25% (relative root square error for area of fertility classes) for potassium. After considering other statistical measures, it allows to consider the phosphorus model moderately useful and good for potassium.
References
- Chodak M, Ludwig B, Khanna P, Beese F (2002) Use of near infrared spectroscopy to determine biological and chemical characteristics of organic layers under spruce and beech stands. J Plant Nutri Soil Sci 165(1): 27-33.
- Baeten V, Dardenne P (2002) Spectroscopy: Developments in instrumentation and analysis. Grasas Y Aceites 53(1): 45-63.
- Romsonthi C, Tawornpruek S, Watana S (2018) In situ near-infrared spectroscopy for soil organic matter prediction in paddy soil, Pasak watershed, Thailand. Plant Soil Environ 64(2): 70-75.
- Kulczycki G (2012) The effect of phosphorus and potassium precision fertilization upon changes in the content of the soluble form of these elements in soil. Fragm Agronom 29(1): 70-82.
- Walczykova M, Zagórda M (2005) Variable rate application of fertilizers in growing winter wheat with use of yield maps. Agric Eng 10(70): 375-384.
- Williams PC (2001) Implementation of near-infrared technology. In: Williams PC, Norris K (Eds.), Near-infrared technology in the agriculture and food industries. (2nd edn), American Association of Cereal Chemists, St Paul, USA.
- Nduwamungu C, Ziadi N, Parent LÉ, Tremblay GF, Thuries L, et al. (2009) Opportunities for, and limitations of, near infrared reflectance spectroscopy applications in soil analysis: A review. Canad J Soil Sci 89(5): 531-541.
- Hively WD, Mccarty GW, Reeves JB, Lang MW, Oesterling RA, et al. (2011) Use of airborne hyperspectral imagery to map soil properties in tilled agricultural fields. Applied and Environmental Soil Science 2011: 1-13.
- Askari MS, Cui J, Holden NM (2013) The visual evaluation of soil structure under arable management. Soil Till Res 134: 1-10.
- Gomez C, Lagacherie P, Coulouma G (2012) Regional predictions of eight common soil properties and their spatial structures from hyperspectral Vis-NIR data. Geoderma 189-190: 176-185.
- Lee WS, Alchanatis V, Yang C, Hirafuji M, Moshou D, et al. (2010) Sensing technologies for precision specialty crop production. Comput Electr Agri 74(1): 2-33.
- Dor EB, Banin A (1995) Near-infrared analysis as a rapid method to simultaneously evaluate several soil properties. Soil Sci Soc Am J 59(2): 364-372.
- Cécillon L, Barthès BG, Gomez C, Ertlen D, Génot V, et al. (2009) Assessment and monitoring of soil quality using near‐infrared reflectance spectroscopy (NIRS). Eur J Soil Sci 60(5): 770-784.
- Debaene G, Niedzwiecki J, Pecio A (2010) Visible and near-infrared spectrophotometer for soil analysis: Preliminary results. Pol J Agr 3: 3-9.
- Debaene G, Niedźwiecki J, Pecio A, Żurek A (2014) Effect of the number of calibration samples on the prediction of several soil properties at the farm-scale. Geoderma 214-215: 114-125.
- Debaene G, Pikuła D, Niedźwiecki J (2014) Use of VIS-NIRS for land management classification with a support vector machine and prediction of soil organic carbon and other soil properties. Cien Investi Agr 41(1): 21-32.
- Kuang B, Mouazen AM (2011) Calibration of visible and near infrared spectroscopy for soil analysis at the field scale on three European farms. Eur J Soil Sci 62(4): 629-636.
- Mouazen AM, Kuang B, Baerdemaeker JD, Ramon H (2010) Comparison among principal component, partial least squares and back propagation neural net-work analyses for accuracy of measurement of selected soil properties with visible and near infrared spectroscopy. Geoderma 158(1-2): 23-31.
- Askari MS, Cui J, O’Rourke SM, Holden NM (2015) Evaluation of soil structural quality using VIS-NIR spectra. Soil Till Res 146(Pt A): 108-117.
- Chang CW, Laird DA, Mausbach MJ, Hurburgh CR (2001) Near-infrared reflectance spectroscopy-principal components regression analyses of soil properties. Soil Sci Soc Am J 65(2): 480-490.
- Sanchez PA, Palm CA, Buol SW (2003) Fertility capability soil classification: A tool to help assess soil quality in the tropics. Geoderma 114(3-4): 157-185.
- Zornoza R, Guerrero C, Solera JM, Scow KM, Arcenegui V, et al. (2008) Near infrared spectroscopy for determination of various physical, chemical and biochemical properties in Mediterranean soils. Soil Biol Biochem 40(7): 1923-1930.
- Mouazen AM, Maleki MR, Baerdemaeker JD, Ramon H (2007) On-line measurement of some selected soil properties using a VIS-NIR sensor. Soil Till Res 93(1): 13-27.
- An X, Li M, Zheng L, Sun H (2015) Eliminating the interference of soil moisture and particle size on predicting soil total nitrogen content using a NIRS-based portable detector. Comput Electr Agric 112: 47-53.
- Bogrekci I, Lee WS (2005) Improving phosphorus sensing by eliminating soil particle size effect in spectral measurement. American Society of Agricultural and Biological Engineers 48(5): 1971-1978.
- Bogrekci I, Lee WS (2006) Effects of soil moisture content on absorbance spectra of sandy soils in sensing phosphorus concentrations using UV-VIS-NIR spectroscopy. American Society of Agricultural and Biological Engineers 49(4): 1175-1180.
- Confalonieri M, Fornasier F, Ursino A, Boccardi F, Pintus B, et al. (2001) The potential of near infrared reflectance spectroscopy as a tool for the chemical characterization of agricultural soils. J Near Infrared Spectrosc 9(2): 123-131.
- Shaddad SM, Madrau S, Castrignanò A, Mouazen AM (2016) Data fusion techniques for delineation of site-specific management zones in a field in UK. Precision Agric 17: 200-217.
- Shao Y, He Y (2011) Nitrogen, phosphorus, and potassium prediction in soils, using infrared spectroscopy. Soil Research 49(2): 166-172.
- Rossel RA, Walvoort DJ, Mcbratney AB, Janik LJ, Skjemstad JO (2006) Visible, near infrared, mid infrared or combined diffuse reflectance spectroscopy for simultaneous assessment of various soil properties. Geoderma 131(1-2): 59-75.
© 2020 Navarrete JM. This is an open access article distributed under the terms of the Creative Commons Attribution License , which permits unrestricted use, distribution, and build upon your work non-commercially.
 a Creative Commons Attribution 4.0 International License. Based on a work at www.crimsonpublishers.com.
Best viewed in


.jpg)


 Editorial Board Registrations
 Submit your Article
 Refer a Friend
 Advertise With Us
.jpg)


.jpg)


.bmp)
.jpg)
.png)
.jpg)


.jpg)


.png)

.png)


.png)


