- Submissions

Full Text
Journal of Biotechnology & Bioresearch
Physico-Chemical Parameters and Plankton Diversity of Manchiryal Town Lake Adilabad District, Andra Pradesh, India
Sivalingam P*
Department of Zoology, Kakatiya University, India
*Corresponding author:Sivalingam P, Department of Zoology, Kakatiya University, Warangal, Andhra Pradesh, India
Submission: August 31, 2018;Published: September 17, 2018

Volume1 Issue2september 2018
Abstract
The present study examines the water quality of Manchiryal town lake Adilabad district Andhra Pradesh, India. The water quality analysis during the academic year June 2013-May 2014. The water quality analysis helps to know the suitability of water for different purpose like. Agriculture, industrial and domestic uses etc. In this study period water samples were collected in early morning hours at 7-00am to 9-00am. The physico-chemical parameters were used to indication of water quality. In the study period 13 parameters were analysed to water quality of lake used by stranded method. They are atmosphere temperature, water temperature, pH, transparence, turbidity, TDS, TH, DO, BOD, COD, Cl, P, S. The lake surrounding devotional activities are main cause to pollution of this lake water quality. The main cause to pollution of this lake urbanization, industrialization, domestic uses, devotional activities and people interact with lake surroundings. That’s why plankton species low number/lit were recorded. Because domestic activities and sewage consult to the rainy season are main cause to pollution of this lake water.
Keywords: Manchiryal town lake; Urbanization; Devotional activities
Introduction
Now a days fresh water resources are important to daily activities of life. It can be used to the potential benefit of mankind to survive of the natural environment. Minimum amount of water is required to every organism in the world [1]. The contamination and pollution of water is great concern in the world for the developing countries like. India [2]. Water quality analyzed by the physicochemical characteristics of lake water. Productivity of lake water depends on the availability of nutritions of the lake. Day by day increasing of population, industrial revolution, urbanization is pollution of an aquatic ecosystem, it’s a common pollution. The aquatic ecosystem tropic status changes due to human interference with effect the destruction of organisms. Phytoplankton constitutes the very basic organism of normal cycle an aquatic body. It is a pioneers producers in the aquatic environment [3]. Phytoplankton are one of the initial biological, component of lake water ecosystem. It’s energy transfer to secondary producers through food chain [4]. Phytoplankton are good indicator of water quality, it is a quick respond to environmental changes [5-13]. Zooplankton are the microscopic, minute organism it’s the primary consumers in the aquatic ecosystem. Zooplankton species diversity closely related to the physico-chemical and biological regime of the aquatic environment [14].
Material and Methods
Manchiryal town lake situated 18’ 52.04’’ Northan longitude 79 27’ 50 E” longitude. It is 1.5km distance from railway station. it’ s a manmade lake. In this study period three sites are selected site 1,2,3. Water samples were collected early morning hours at 7.00am to 9.00am. Plankton samples also taken to the lake water with the help of plankton collecting net and add 4% formaldehyde solution. Collected samples were taken to the laboratory and analysed the values with different physic-chemical analysis methods. 1ml of plankton samples were taken to the pepit and observe under the microscope with the use of Sedgwick-rafter cell.
Results and Discussion
During my investigation period various physic-chemical parameters were given to the Table 1 respectively. The values of atmosphere temperature fluctuated during the study period range from 11 °C to 33 °C. Maximum atmosphere temperature was recorded in the month of May. Minimum atmosphere temperature was recorded in the month of December. The values of water temperature fluctuated during the study period range from 10 °C to 28 °C. Maximum water temperature was recorded in the month of May. Minimum water temperatures were recorded in the month of January 6. In research period pH of water remain alkaline in nature. High pH value was recorded in the month of January (7.99) low pH value was recorded in the month of December 10. During investigation period transparence values ranges between 39cm to 24cm (Table 2). High transparence value was recorded in the month of January (39cm) low transparence value was recorded in the month of September (24cm). Maximum turbidity value was recorded in the month of September (26.5NTU) low turbidity value was recorded in the month of March (14NTU). In research period maximum TDS value was recorded in the month of November (485mg/lit) minimum TDS value was recorded in the month of February (242mg/lit) (Table 3).
Table 1:Physico chemical parameters of Manchiryal town lake during the June 2013 to May 2014.

Table 2:Phytoplankton percentage of Manchiryal town lake during June 2013 to May 2014.

Table 3:Zooplankton percentage Manchiryal town lake during June 2013 to May 2014.

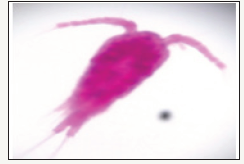
During the study period maximum TH value was recorded in the month of November, minimum TH value was recorded in the month of May 9. During research period DO values were ranges between 3.1mg/lit to 5.8mg/lit maximum DO value was recorded in the month of September minimum DO value was recorded in the month of January. BOD values were ranges between 2.6mg/lit to 4.1mg/lit 8, maximum BOD value was recorded in the month of January and minimum BOD values were recorded in the month of May. During research period COD values ranges between 4.7mg/ lit to 10.1mg/lit maximum COD value was recorded in the month of October minimum COD value was recorded in the month of March. During observation period high chloride value recorded in the month of May (81mg/lit) low chloride value was recorded in the month of November (49mg/lit). In research period maximum phosphate value was recorded in the month of September(139mg/ lit) minimum phosphate value was recorded in the month of March (99.1mg/lit) [7]. During research period sulphate values ranges between 79 to 135mg/lit maximum sulphate value was recorded in the month of November(135mg/lit). Minimum sulphate value was recorded in the month of March(79mg/lit) [11]. Plankton are microscopic, free swimming organisms that’s play a major role in the nutrition cycle in aquatic ecosystem (Figure 1). Phytoplankton composition in the lake during the investigation period four groups of phytoplankton was identified. In research period high percentage of chlorophycae species were recorded (69%) at site no.2 were respectively (Figure 2). Low percentage of euglenophycae species were recorded (5.1%) site no.2. were respectively (Figure 2) [12,13]. Zooplankton composition in the lake during the investigation period four groups of zooplankton was identified and percentage of zooplankton high percentage of rotifers species were recorded (46.3%) at site no.3. were respectively (Figure 3) low percentage of ostracod species were recorded (7.6 %) site no.3. were respectively (Figure 3) [14].
Figure 1:Zooplanktons: Rotifers Branchious species.

Figure 2:Cladocera Paracyclops species.

Figure 3:Phytoplankton Volvox species.

Conclusion
During the study period it was found that physic-chemical parameters of Manchiryal town lake values were near to the pollution levels according to the WHO permissible limit. These water body are high productive nature with addition of domestic activities and worship activities of the besides temple. In research period low number of phytoplankton and zooplankton species were recorded because of physico-chemical characteristics values are near to the pollution levels that’s why water colour is change to green. Devotional activities are main cause to increasing of water pollution. Some precaution should be taken to the protection of this lake environment.
References
- WHO (2004) Water sanitation and hygiene links to the health facts and fishes Genera. Switzerland World Health Organization, Geneva, Switzerland.
- Mohan VC, Sharma KK, Sharma A (2013) Limnological profile of chenani hydroelectric reservoir its connects channel and river Tawi in Udampur district J&K, India. Int Res J Biological Sci 2(3): 76-79.
- Sharma DD (2013) An assessment of phytoplankton diversity of tighra reservoir, Gwalior, Madhya Pradesh, India. Int J of Sci Res 2(12).
- Ananthan G, Sampathkumar P, Soundararajan P. Verampattinum coast of Pondichery. Int J of Aqua Biol 19: 67-72.
- Maybeck M, Kuusisto E, Makila A, Malkki E (1996) Water quality monitory. Int J Bartram & R balance, London, UK.
- Saha GN, Sahangal KL, Mutra E, Nandy AI (1971) Studies on the seasonal and diurnal variation in physic-chemical fresh water pond. Int J Fish Soci India 3: 79-102.
- Sastri GH, Singh NK, Tiwari U (2008) Physico-chemical analysis of chingra japara pond water in Gobbellake, Katinar, Bihar, India. J Aqua Biol.
- Sarang N, Kumar A, Sharma BK, Sharma LL, Verma PC, et al. (2006) Plankton diversity along with shoreline of RPS Lake, NSL 39(4): 160- 163.
- Salve BC, Hiware CJ (2006) Studies on water quality of Wanparakalpa reservoir, Naspur, near, Parli Vaijanath district, Beed Maharashtra region. J of Aqu Biol 21(2): 113-117.
- Huchinson GE (1975) A treaties on limnology. Limnological Botany 3: 669.
- Sinha MP (1986) Limnobiotic study on tropic status of pollution fresh water reservoir of coal field area. Poll Res 15: 13-17.
- Shashikanth M, Vijay Kumar K (2007) Ecology and abundance of zooplankton in Kajjarla reservoir. Ent mon Assis.
- Ashok SD (2001) Hydrological studies of a fresh water reservoir Nipani from Belgam district.
- Brraich OS, Kayr R (2005) Phytoplankton community structure and species density of Nangal wetland, Punjab, India. Int J of Bio Sci 4(3): 76-83.
© 2018 Sivalingam P. This is an open access article distributed under the terms of the Creative Commons Attribution License , which permits unrestricted use, distribution, and build upon your work non-commercially.
 a Creative Commons Attribution 4.0 International License. Based on a work at www.crimsonpublishers.com.
Best viewed in


.jpg)


 Editorial Board Registrations
 Submit your Article
 Refer a Friend
 Advertise With Us
.jpg)


.jpg)


.bmp)
.jpg)
.png)
.jpg)


.jpg)


.png)

.png)


.png)


