- Submissions

Full Text
Intervention in Obesity & Diabetes
Prevalence of Overweight and Obesity among Adult in Selected Areas of Bangladesh
Md Nahian Rahman1, Syeda Saima Alam2, Abu Zobayed3, Md Mahedi Hasan4, Shaidaton Nisha1 and Khaleda Islam5
1MSc, Institute of Nutrition and Food Science, University of Dhaka, Bangladesh
2Lecturer, Department of Food Technology and Nutrition Science, Noakhali Science and Technology University, Bangladesh
3M Pharm, Department of Clinical Pharmacy & Pharmacology, Faculty of Pharmacy, University of Dhaka, Bangladesh/p>
4Nutrition Consultant, District Nutrition Coordinator(DNC), Kishorganj, UNICEF, Bangladesh
5Professor, Institute of Nutrition and Food Science, University of Dhaka, Bangladesh
*Corresponding author: Md Nahian Rahman,, MSc, Institute of Nutrition and Food Science, University of Dhaka, Bangladesh. Email: Rahman_nahian@yahoo.com Mobile:+8801674645407
Submission:August 10, 2020;Published: September 30, 2020
ISSN 2592-0263Volume4 Issue4
Abstract
Obesity is becoming the most common health problem of the 21st century, as it will contribute significantly to the high prevalence of cardiovascular disease in developing countries. This study aims to estimate the prevalence of overweight and obesity and determine potential influencing factors among adults in selected areas in Bangladesh. A cross-sectional survey was conducted in4 districts of Bangladesh (Dhaka, Mymensing, Khulna and Sylhet) in 2018. A total of 400 respondents aged 18-93 years from the general population were included using a multistage stratified random cluster sampling design. Data were obtained from face-to-face interview and physical examination. After being weighted according to a complex sampling scheme, the sample was used to estimate the prevalence of overweight (body mass index (BMI) 23-27.49kg/m2) and obesity (BMI ≥27.5kg/m2).The overall prevalence of overweight was 23.25% (male 25.11%; female 20.61%), and the prevalence of obesity was 6.75% (male 6.81%; female 6.67%). The prevalence of both overweight and obesity were higher in men than women (p<0.001). The prevalence of overweightwas higher inrespondents aged 36 to50 years than others age group .The prevalence of obesitywas higher inrespondents aged 51 to 65 yearsthan others age group (p<0.05). The results of this study will be helpful to policy makers in developing education and publicity to prevent and control the occurrence of overweight and obesity
Keywords: Obesity; Overweight; Body mass index; Diabetes; Bangladesh
Introduction
Overweight and obesity have been shown to be related to multiple chronic conditions, and lead to a heavy economic burden on families and increasing costs to society throughout the world [1]. According to a WHO report, [2] obesity is defined as a body mass index (BMI)≥30 kg/m2, and overweight as a BMI of 25-29.9kg/m2. For Asian people, obesity suggests a BMI≥27.5kg/m2 and overweight indicates a BMI of 23-27.49kg/m2 [3]. In 2013, in order to make physicians pay more attention to the condition, the American Medical Association classified obesity as a disease [4]. Over the last 33 years, rates of either being overweight or obese doubled among Bangladeshi adults but remained low among children, according to a new, first-of-its-kind analysis of trend data from 188 countries. In 1980, 7% of adults and 3% of children were overweight or obese [5]. According to the Institute for Health Metrics and Evaluation (IHME), of the 17% of overweight or obese adults in Bangladesh, just 4% were obese, and obesity rates in Bangladesh are increasing at a slower pace. From 1980 to 2013 obesity rates in adults grew from 2% to 4%, and rates in children and adolescents remained at about 1.5% [5]. Over the two last decades Bangladesh, a low-income country, has experienced a rapid demographic and epidemiological transition. The population has increased substantially with rapid urbanization and changing pattern of disease, which at least in part, can be explained by nutritional changes. However, the nutritional status of the adult population has not been previously described. Hence, the objective of this study was to estimate the prevalence and explore socio-demographic determinants of overweight and obesity among the Bangladeshi adult population.
Methods
Study setting
The study was conducted in Dhaka, Mymensing, Sylhet and Khulna District in Bangladesh
Study design, period, and sample size
A community-based cross sectional study was conducted from January 01 to March 30, 2018. The source population was individuals aged 18 years and above permanently living there. The sample size was calculated was found to be 400.
Sampling technique
This study was conducted among 400 adults aged 18-93 years who lived in Dhaka, Mymensing, Sylhet and Khulna District for more than six months before the survey. Multistage sampling technique was used; the primary sampling units, four districts were randomly selected from the total of 8 districts. Sample size was equally distributed to each of the selected districts. Finally, systematic random sampling technique was employed to select households to be visited for data collection. From the selected households, eligible adults aged between 18 and 93 were identified, and if there were more than one in a household, then one was randomly selected.
Data collection
All the participants’ identities were confirmed by the investigators. During the investigation, each completed questionnaire was examined by two investigators to ensure validity and consistency. After the fieldwork, data were manipulated by parallel double entry, and we also performed three verifications to check for incomplete and inconsistent responses. The questionnaire provided demographics, lifestyle habits and other related information on health. Height and weight were determined using a standardized protocol with the subjects in light indoor clothing without shoes. Height was measured to the nearest 0.1cm, and weight to the nearest 0.1kg.
Data collection and measurement
Data on demographic and behavioral characteristics were collected by trained personnel through a face-to-face interview using a semi structured questionnaire. The field study team was composed of enumerators, laboratory technicians, nurses, and supervisors. The World Health Organization (WHO) stepwise approach (three steps) for noncommunicable disease surveillance was used to collect the data [6].
Step 1: Demographic and behavioral characteristic data
In this step, demographic and behavioral risk factors were collected through face-to-face interviews using an intervieweradministered questionnaire. Each participant was questioned for age, sex, educational status, marital status, occupation type, physical activity, history of raised blood pressure and diabetes, fruit and vegetable intake, alcohol consumption, and smoking habit.
Step 2: Physical measurements
Physical measurements of height and weight needed to calculate body mass index (BMI), waist circumference, and blood pressure were taken in this step. Blood pressure (BP) was taken in a sitting position from the right arm using a digital sphygmomanometer. Two readings were taken 5 minutes apart, and the mean was considered as the final BP result. Prehypertension is defined as systolic BP of 120-139 and diastolic BP 80-89mmHg. Hypertension is defined as systolic BP of ≥140mmHg or diastolic BP of ≥90mmHg. A portable weight and height scale was used to measure the weight of the participant wearing light clothes and height in upright standing position on a flat surface. Then, body mass index (BMI) was calculated by weight in kilograms divided by height in meters squared formula. BMI <18.5 kg/m2 is considered as underweight, 18.5-22.9kg/m2 as normal, 23-27.49 kg/m2 as overweight, and ≥27.50kg/m2 as obese. Waist circumference (WC) was measured at the approximate midpoint between the lower margin of the last palpable rib and the top of the iliac crest, using a flexible plastic tape. WC values > 94 and >80cm for men and women, respectively, were considered high according to the World Health Organization (WHO) recommendation.
Step 3: Biochemical measurements
The Accu-Chek Active system uses a capillary blood sample which is set to plasma serum standard, showing result in plasma glucose values. This measurement was immediately performed for all participants, and the results were recorded in the questionnaire. Fasting capillary blood samples were collected three times at different occasions (for three consecutive days) from a single study participant, and glucose measurement was carried out within fractions of seconds after sample collection. Then, their average was taken for analysis, and this might have minimized the appearance of abnormal results. The diagnosis of DM was based on the American Diabetes Association diabetes mellitus classification criteria with fasting blood glucose of ≥126mg/dl being considered as positive for DM; impaired fasting glucose, FBG: ≤110mg/dl to <126mg/dl; normoglycemic, FBG: ≤61mg/dl to <110mg/dl), and hypoglycemic, <61mg/dl [7].
Data analysis
The data was entered, cleaned, and analyzed using the SPSS version 23.0 software package. Descriptive statistics were used to summarize the characteristics of study participants.
Consent to participate
Informed verbal consent was gathered from each participant. Any information obtained in each course of the study was kept confidential.
Results
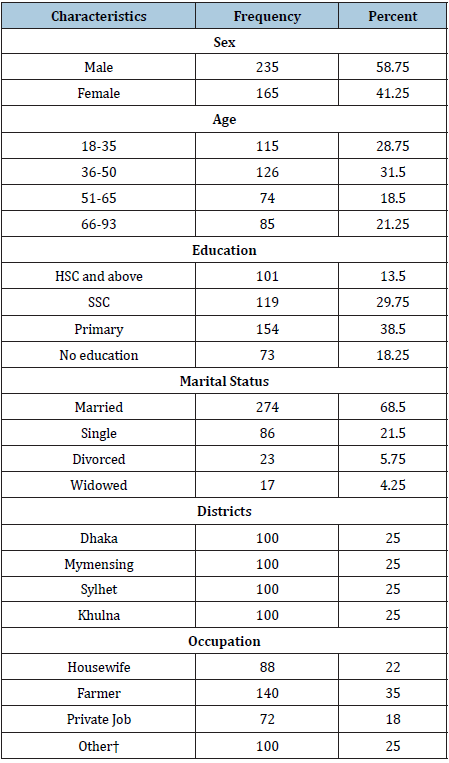
A of total 400 valid observations were included in the analysis. The mean age of participants was 43.43±19.82 years. Two hundred forty-one (60.25%) of the participants were younger than 50 years old. 58.75% of study participants were male. More than half (56.75%) of adults either attended primary education or did not attend formal education. Two thirds of them (68.5%) were married while 86 (21.5%) were single. Concerning occupation, 140 (35%) adults were farmer whereas 88 (22%) were housewife (Table 1).
Table 1: Sociodemographic characteristics of adults in Bangladesh. Other†: Including students (n=26), Unemployed (n=35), Business (n=18), and daily laborer (n=21).
Distribution of adults’ behavioral characteristics
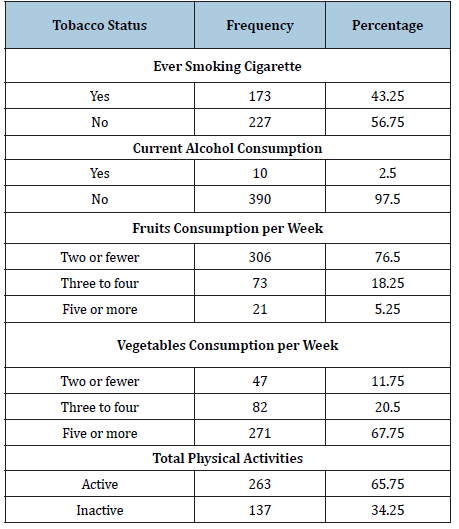
From total of participants responding, 173 (43.25%) were smokers. Only Ten (2.5%) participants consumed alcohol over the last 30 days preceding the time of data collection. Three hundred six (76.5%) participants ate fruits two or fewer days a week. Fortyseven (11.75%) participants ate vegetables for two or fewer days during regular weekdays. One hundred thirty seven (34.25%) adults were not involved in adequate physical activity or physical inactivity (Table 2).
Table 2: Distribution of adults behavioral characteristics. Other†: Including students (n=26), Unemployed (n=35), Business (n=18), and daily laborer (n=21).
Physical and biochemical measurements
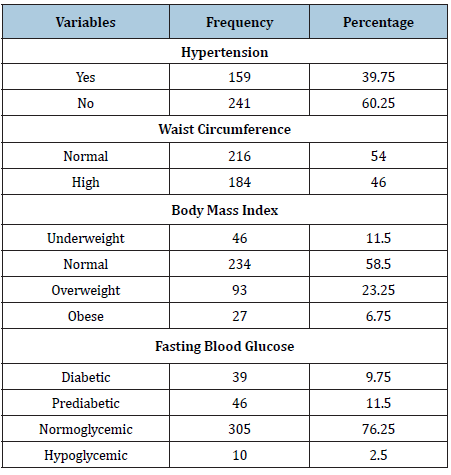
Table 3: Physical and biochemical measurement characteristics of study population.
Prevalence of overweight and obesity
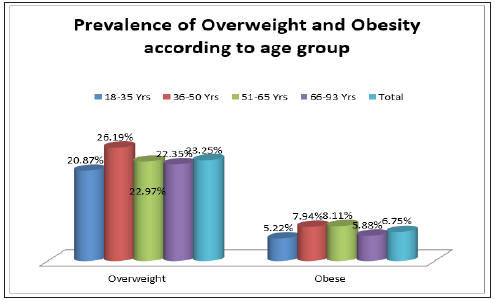
The overall prevalence of overweight was 23.25% (male 25.11%; female 20.61%), and the prevalence of obesity was 6.75% (male 6.81%; female 6.67%). The prevalence of both overweight and obesity were higher in men than women (p<0.001) (Figure 1). The overall prevalence of overweight was 23.25% (18-35 years old 20.87%; 36-50 years old 26.19%; 51-65 years old 22.97% and 66- 93 years old 22.35%), and the prevalence of obesity was 6.75 (18-35 years old 5.22%;36-50 years old 7.94%; 51-65 years old 8.11% and 66-93 years old 5.88%) (Figure 2). The prevalence of overweight was higher in respondents aged 36 to50 years than others age group. The prevalence of obesity was higher in respondents aged 51 to 65 years than others age group (p<0.05) (Tables 4 & 5).
Table 4: Prevalence of overweight and obesity according to gender (sex).

Table 5: Prevalence of overweight and obesity according to age group.

Figure 1: Prevalence of overweight and obesity according to gender (sex).
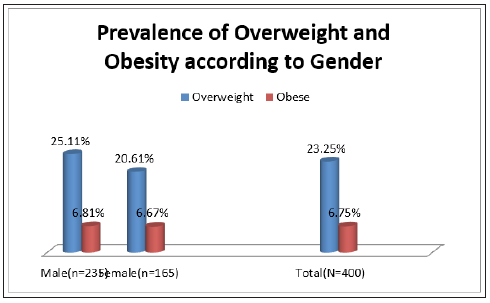
Figure 2: Prevalence of overweight and obesity according to age group
Discussion
A report by WHO in 2014, confirmed that globally the prevalence of overweight and obesity affected more than 1.9 billion adults aged 18 years or older, where 39% of adults were overweight and 13% were obese [8]. Bangladesh’s economic transitioning will expose the population to Westernized lifestyles, including processed foods, increased mechanization of tasks and population shifts from rural areas to cities [9]. Over the last 33 years, rates of either being overweight or obese doubled among Bangladeshi adults but remained low among children, according to a new, first-of-its-kind analysis of trend data from 188 countries. In 1980, 7% of adults and 3% of children were overweight or obese. In 2013, those rates had climbed to 17% for adults but only 4.5% for children [10]. Of the 17% of overweight or obese adults in Bangladesh, just 4% were obese, and obesity rates in Bangladesh are increasing at a slower pace. From 1980 to 2013 obesity rates in adults grew from 2% to 4%, and rates in children and adolescents remained at about 1.5% [10]. In our study, total of 400 respondents aged 18-93 years from the general population were included using a multistage stratified random cluster sampling design. Data were obtained from faceto- face interview and physical examination. After being weighted according to a complex sampling scheme, the sample was used to estimate the prevalence of overweight (body mass index (BMI) 23- 27.49kg/m2) and obesity (BMI ≥27.5kg/m2).The overall prevalence of overweight was 23.25% (male 25.11%; female 20.61%), and the prevalence of obesity was 6.75% (male 6.81%; female 6.67%). The prevalence of both overweight and obesity were higher in men than women (p<0.001). The prevalence of overweight was higher in respondents aged 36 to50 years than others age group .The prevalence of obesity was higher in respondents aged 51 to 65 years than others age group (p<0.05).
Conclusion
In conclusion, our study showed high prevalence of overweight and obesity which should be considered as a public health concern and should be followed by specific interventions at the community level, especially targeting the low income citizens, with multidisciplinary activities, starting from childhood as a primordial prevention program.
References
- Zhang YX, Zhao JS, Chu ZH, Zhou JY (2015) Prevalence of elevated blood pressure is associated with the increasing prevalence of obesity among children and adolescents in Shandong, China. Int J Cardiol 201:150-151.
- Flegal KM, Kit BK, Orpana H, Graubard BI (2013) Association of all-cause mortality with overweight and obesity using standard body mass index categories: A systematic review and meta-analysis. JAMA 309(1): 71-82.
- World Health Organization (2004) Appropriate body-mass index for Asian populations and its implications for policy and intervention strategies. Lancet 363(9403): 157-163.
- Addo PN, Nyarko KM, Sackey SO, Akweongo P, Sarfo B (2015) Prevalence of obesity and overweight and associated factors among financial institution workers in Accra Metropolis, Ghana: A cross sectional study. BMC Res Notes 8: 599.
- Ng M, Fleming T, Robinson M, Thomson B, Graetz N, et al. (2014) Global, regional, and national prevalence of overweight and obesity in children and adults during 1980-2013: A systematic analysis for the Global Burden of Disease Study 2013. The Lancet 384(9945): 766-781.
- Riley L, Guthold R, Cowan M, Savin S, Bhatti L, et al. (2016) The World Health Organization STEPwise approach to noncommunicable disease risk-factor surveillance: methods, challenges, and opportunities. American Journal of Public Health 106(1): 74-78.
- American Diabetes Association (2014) Diagnosis and classification of diabetes mellitus. Diabetes Care 37(1): S81-S90.
- World Health Organization (2016) Obesity and overweight, Switzerland.
- Islam A, Biswas T (2014) Chronic non-communicable diseases and the healthcare system in Bangladesh: current status and way forward. Chronic Dis Int 1(2): 6.
- Institute for Health Metrics and Evaluation (IHME) Adult rates of overweight and obesity rise in Bangladesh, USA.
© 2020 Md Nahian Rahman. This is an open access article distributed under the terms of the Creative Commons Attribution License , which permits unrestricted use, distribution, and build upon your work non-commercially.
 a Creative Commons Attribution 4.0 International License. Based on a work at www.crimsonpublishers.com.
Best viewed in


.jpg)


 Editorial Board Registrations
 Submit your Article
 Refer a Friend
 Advertise With Us
.jpg)


.jpg)


.bmp)
.jpg)
.png)
.jpg)


.jpg)


.png)

.png)


.png)


