- Submissions

Full Text
Intervention in Obesity & Diabetes
Positive Feedback Regulation Effect Exits Between Activation of Insulin Signaling Pathway and Apolipoprotein M Expression
Jun Zhang1, Miaomei Yu1, Shuang Yao1, Yuxia Zhan1, Guanghua Luo1* and Ning Xu2*
1Comprehensive Laboratory, the Third Affiliated Hospital of Soochow University, Changzhou, China
2Section of Clinical Chemistry & Pharmacology, Institute of Laboratory Medicine, Lunds University, Lund, Sweden
*Corresponding author:Guanghua Luo, Comprehensive Laboratory, the Third Affiliated Hospital of Soochow University, Changzhou, China, , E-mail: *Ning Xu, Section of Clinical Chemistry & Pharmacology, Institute of Laboratory Medicine, Lunds University, Lund, Sweden
Submission:July 10, 2019;Published: July 19, 2019

ISSN 2578-0263Volume3 Issue1
Abstract
This study is aimed to explore the effect of improved insulin sensitivity on the expression of apolipoprotein M (ApoM). Primary hepatocytes and skeletal myocytes of ApoM knockout (ApoM-/-) mouse were transfected with lentivirus vector containing the human ApoM gene (LV-ApoM), and an empty vector was used as a control group (LV-Ctrl). JNK inhibitor, SP600125 was added to improve the insulin sensitivity of cells. After 18h of cultivation, the cells were collected after stimulation with 100nM. insulin for 30min. The expression levels of ApoM and JNK1 mRNA were detected by real-time PCR, while the expression of phosphorylate protein kinase B (p-AKT) was assessed by Western blot analysis. The results showed that enhancement of insulin signaling pathway by SP600125 significantly increased ApoM mRNA expression and ApoM overexpression significantly elevated the protein level of p-AKT in primary skeletal myocytes, which indicated that increased insulin sensitivity could promote the expression of ApoM and ApoM overexpression could also promote the activation of insulin signaling pathway.
Keywords: Apolipoprotein M (ApoM); Type 2 diabetes; Hepatocytes; Skeletal myocytes; Insulin
Abbreviations: ApoM: Apolipoprotein M; HDL: High Density Lipoprotein; PBS: Phosphate Buffer Saline; PAS: Periodic Acid-Schiff; GFP: Green Fluorescent Protein; GAPDH: Glyceraldehyde 3-Phosphate Dehydrogenase
Introduction
Apolipoprotein M (ApoM) exsits mainly in high density lipoprotein (HDL) and is critical for the formation and maturation of pre-beta-HDL particles [1]. Studies have confirmed that plasma ApoM levels are moderately reduced in patients with type 2 diabetes [2], and serum ApoM concentrations can be considered as serum biomarkers for the identification of maturity-onset diabetes of the young type 3 (MODY3) which is monogenetic diabetes mellitus [3]. Even though these studies suggest that ApoM may have a role in the development of diabetes, the exact response mechanism and function of ApoM in the process of blood glucose regulation remains unclear. Our previous studies found that high concentrations of glucose and fatty emulsion can obviously reduce insulin sensitivity while downregulating the expression of ApoM in rat liver [4,5]. But the insulin sensitizer roglitazone can significantly reverse this effect and enhance the expression of ApoM in rat liver [6]. ob/ ob obese mice with hyperinsulinemia accompanied by obvious insulin resistance exhibit significant hypo-ApoMemia, but abnormal ApoM expression was partially reversed after insulin injection [7]. Since insulin resistance can trigger the downregulation of ApoM expression, we assumed that improving insulin sensitivity might be able to promote ApoM expression, and the rise in ApoM expression could subsequently increase insulin sensitivity. To confirm this hypothesis, lentivirus vector with ApoM was employed to transfect the hepatocytes and skeletal myocytes of ApoM-/- mice. Meanwhile, JNK inhibitor, SP600125 was used for enhancing insulin signaling pathway to observe whether increasing insulin sensitivity affects the ApoM expression and explore its underlying molecular mechanisms.
Materials and Methods
Separation and culture of primary mouse hepatocytes
Newborn ApoM–/– mice were sacrificed by decapitation and sterilized with 75% ethanol. The liver tissue of mice was aseptically isolated under ice bath, and each liver specimen was rinsed by 4 ℃ pre-cooled phosphate buffer saline (PBS) until it was gray white. Then, we peeled the liver capsule and fibrous layer, and cut it into tissue pieces of about 1 mm3, which were digested with 0.25% trypsin for 5 min at 37 ℃, centrifuged for 5min at 1000rpm, and digested with 0.1% collagen enzyme for another 10min. After centrifugation, the cells were fully lysed with erythrocyte lysate for 10min, and resuspended in complete culture medium. After filtering out partial tissue blocks by 400-mesh colanders, the cells were counted and seeded at a density of 5×10⁵/ml in a 6-well plate coated with type I rat tail collagen and cultured under the condition of 37 ℃, 5% CO2. Fresh medium was changed every other day.
Separation and culture of primary skeletal myocytes
After the newborn ApoM–/– mice were sacrificed and sterilized, the skeletal muscles were taken from the thighs and washed with PBS. Then, we removed the fat and connective tissues, and cut them into tissue pieces of about 1mm3. These tissue blocks were evenly attached to the large dish previously washed with 1640 complete medium (Gibco, Life Technologies, USA), and cultured for 2 hours at 37 ℃ in a 5% CO2 incubator. After that, a little medium was added to stay overnight, and then changed every other day until the skeletal myocytes climbed out. The cells were counted and seeded at a density of 5×10⁵/ml in a 6-well plate for subsequent experiments.
Identification of primary hepatocytes by Periodic Acid- Schiff (PAS) staining
Primary hepatocytes inoculated in 6-well plates were cultured for 24h, fixed with 10% formarin for 60min, and identified using Periodic Acid-Schiff (PAS) staining according to the instructions of Solarbio (Beijing, China). After washing with ddH2O, the cells were placed in periodic acid solution for 8min, and then stained with Schiff Reagent for 15min in the dark. The nucleus was stained with hematoxylin staining solution for 2min, and then differentiated in acidic ethanol for 2 to 5s. The cells were observed and photographed under a fluorescence microscope.
Identification of primary skeletal myocytes by Immunofluorescence staining
Primary skeletal myocytes seeded in 6-well plates were cultured for 24h, washed once with PBS, and fixed with 4% paraformaldehyde (Beyotime, Shanghai, China) for 15min. 0.1% Tritonx-100 solution was added for permeability, and 5% bovine serum albumin (BSA) (Sigma-Aldrich, USA) was added to incubate the cells for 60min at room temperature. After removing the serum, we added mouse anti-α-SAM antibody (1:400, Sigma- Aldrich, USA) overnight at 4 ℃. The next day, the cells were washed with PBS for 3 times, and FITC-labeled goat anti-mouse second antibody (1:50, Proteintech, USA) was added, incubated at 37 ℃ for 2h. Washing again with PBS for 3 times, cells were photographed by fluorescence microscope after 4’,6-diamidino-2- phenylindole (DAPI) (1:1000, Bosterbio, USA) staining for 10min.
Cell transfection and treatment
Recombined ApoM overexpression and empty vectors (as a control) were constructed and synthesized by GeneChem Co., Ltd. (Shanghai, China). The lentiviral vectors were transfected into primary hepatocytes and skeletal myocytes following the manufacturer’s instructions. Cells were seeded (5×10⁵ cells/ ml) into 6-well plates and incubated for 24h to reach 50% confluence, and then replaced with infection medium containing lentiviral vectors at an appropriate multiplicity of infection (MOI). Successfully infected cells were green fluorescent protein (GFP) positive and observed under a fluorescent microscope after 72h. After ApoM overexpression and empty lentiviral transfection, JNK inhibitor, SP600125 (Sigma-Aldrich, USA) was added to final concentration of 50μM for 18h, followed by 100nM insulin (Eli Lilly, USA) for 30min. According to different treatments of cells, the experiments were divided into four groups: Ctrl group (transfected with empty vector), ApoM group (transfected with ApoM overexpression vector), SP600125 group (transfected with empty vector and treated with SP600125) and ApoM+SP600125 group (transfected with ApoM overexpression vector and treated with SP600125).
Extraction of total RNA and protein
RNA and protein were extracted according to the instructions of the DNA/RNA/protein isolation kit (Omega, USA). Real-time PCR (RT-PCR) detection
Real-time PCR (RT-PCR) detection
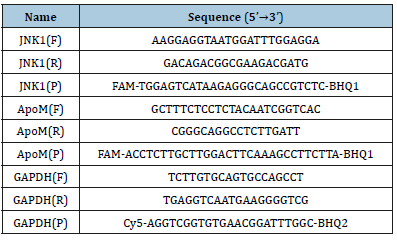
Table 1:

RNA reverse transcription to cDNA was accomplished by using the cDNA first chain synthesis kit (ThermoFisher, USA) according to the manufacturers’ instructions. The mRNA expression level of the ApoM and JNK1 genes was detected by RT-PCR with using cDNA as templates during amplification. Optimum reaction conditions were obtained with 25μl reaction mixture containing 2.5μl of 10xPCR buffer, 2.5μl of 25mM magnesium chloride (MgCl2), 0.5μl of 10mM 4xdNTPs, 0.25μl of 5U/μl Taq DNA polymerase, 0.04μl of 100μM each primer, 0.04μl of 100μM specific probe and 2μl template cDNA. The following PCR procedure was used: 95 ℃ for 3min. Subsequently, a 40 cycles of two-step PCR was performed consisting of 95 ℃ for 5s and 60 ℃ for 15s. All the RT-PCR assays were performed on the LightCycler (Roche, Switzerland). Quantification of target gene mRNA levels was performed by normalizing to glyceraldehyde 3-phosphate dehydrogenase (GAPDH) mRNA level by the comparative threshold cycle method (2-ΔCt) [8]. Sequences of primers and probes are presented in Table 1.
Western blot analysis
The proteins were mixed with 5×SDS-PAGE loading buffer (Beyotime, Shanghai, China) and boiled for 5min. The samples were loaded in a 10% polypropylene gel for 20min at 90V, followed by electrophoresis at 120V for 1.5h. Then, the proteins were transferred onto polyvinylidene fluoride membranes (PVDF) by a constant flow 250mA and blocked with 5% skim milk powder for 2h, and then incubated separately overnight at 4 °C with the following primary antibodies (Cell Signaling, USA): anti-AKT (1:1000), anti-p-AKT(1:1000) and anti-β-actin (1:3000). β-actin was used as the internal control to normalize protein loading. After washing four times with phosphate-buffered saline, 0.05% Tween 20, pH 7.4 (PBST), the membranes were incubated for 1h at room temperature with horseradish peroxidase-conjugated AffiniPure goat anti-rabbit IgG (1:3000, Proteintech, USA). The protein bands were visualized with the Pierce ECL Western Blotting Substrate kit (Thermo Scientific,USA) after washing with PBST.
Statistical Analysis
Statistical analysis was performed using GraphPad Prism 5.0. The t-test was used for comparison between the two groups. Oneway ANOVA was used to compare multiple comparisons. P<0.05 was considered statistically significant.
Result
Culture and identification of primary hepatocytes and skeletal myocytes
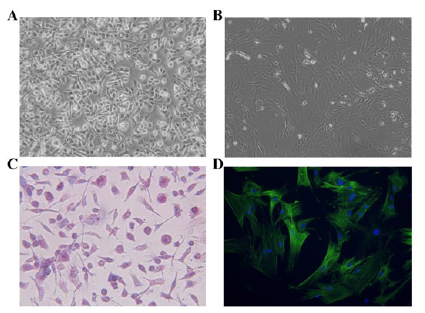
Figure 1:Culture and identification of mouse primary hepatocytes and skeletal myocytes. (A) Mouse primary hepatocytes under the light microscope (×100). (B) Mouse primary skeletal myocytes under the light microscope (×100). (C) Identification of primary hepatocytes by PAS staining (×200). (D) Identification of primary skeletal myocytes by α-SAM immunofluorescent staining (×400).

Mouse primary hepatocytes are round or oval and mononuclear or binuclear before adherence. After 24h of culture, some unattached hepatocytes were found under the light microscope, while the adherent cells were enlarged, flattened and extended outward. The hepatocytes were irregularly polygonal, and adjacent cells began to establish a connection, forming an island or a cord-like structure. After 48h of culture, more than 90% of the cells were observed to have typical hepatocyte morphology. The cells were polygonal, with a clear outline, large and round nuclei, and mostly binuclear hepatocytes (Figure 1A). Initially, mouse primary skeletal myocytes exist as myoblasts, presenting a single round or fusiform shape. After 48h of culture, the cells were completely adherent and began to proliferate, gradually extended into a fusiform or spindle shape, which fused with each other and were arranged in an order. Under the light microscope, skeletal myocytes were observed to exhibit multi-nuclear, fusion, contractile and other morphological features (Figure 1B). The results of PAS staining showed that the cytoplasm of hepatocytes was different shades of red, and dense purple red glycogen particles were observed under high magnification, while the nucleus was blue (Figure 1C). As shown in Figure 1D, the results of immunofluorescence staining showed that the matured myoblasts were positive for α-SAM and green for cytoplasm.
Expression of ApoM and JNK1 after lentivirus transfection and SP600125 treatment
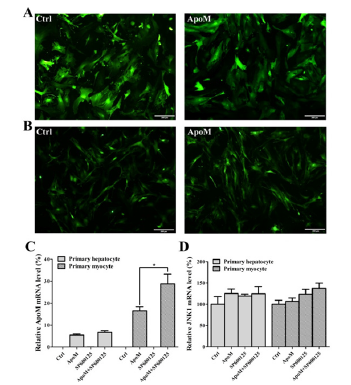
After 72h of lentivirus transfection, the transfection efficiency was observed under an inverted fluorescence microscope. The results showed that the GFP fluorescence efficiency of the Ctrl group and the ApoM group in both primary hepatocytes (Figure 2A) and skeletal myocytes (Figure 2B) were over 90%. The RT-PCR results of hepatocytes and skeletal myocytes showed that there was no ApoM expression (ApoM–/– cells) in the Ctrl group, and the ApoM mRNA expression level in the ApoM group was significantly increased. Moreover, the expression level of ApoM mRNA in the ApoM+SP600125 group of primary skeletal myocytes was significantly higher than that in the ApoM group alone (P<0.05), but there was no significant difference in hepatocytes (Figure 2C). There was no significant difference in JNK1 mRNA expression levels between the two groups (Figure 2D).
Figure 2:Expression of ApoM and JNK1 after lentivirus transfection and SP600125 treatment. (A) Lentivirus transfection efficiency of the Ctrl group (Left) and the ApoM group (Right) in primary hepatocytes. (B) Lentivirus transfection efficiency of the Ctrl group (Left) and the ApoM group (Right) in primary skeletal myocytes. (C) ApoM mRNA expression level of each group. (D) JNK1 mRNA expression level of each group.

Protein levels of p-AKT and AKT after lentivirus transfection and SP600125 treatment
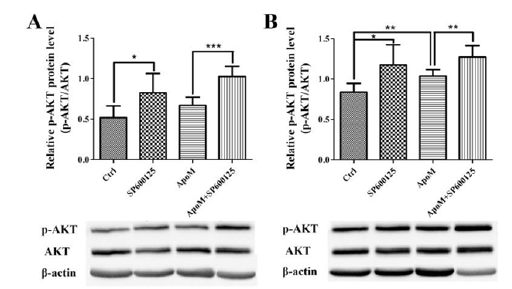
Figure 3:Expression of p-AKT and AKT after lentivirus transfection and SP600125 treatment. (A) Expression level of p-AKT protein in primary hepatocytes. (B) Expression level of p-AKT protein in primary skeletal myocytes.

Western blot analysis was performed to detect the relative expression of p-AKT protein (the ratio of p-AKT to AKT) in Ctrl group, ApoM group, SP600125 group and ApoM+SP600125 group of primary hepatocytes and skeletal myocytes. The results showed that the expression level of p-AKT protein in hepatocytes (Figure 3A) and skeletal myocytes (Figure 3B) was significantly increased after SP600125 treatment compared with their respective control group (P<0.05). In addition, overexpression of ApoM significantly increased the expression of p-AKT protein in primary skeletal myocytes compared to the Ctrl group (P<0.05), whereas there was no significant difference in primary hepatocytes (Figure 3).
Discussion
Insulin resistance is a complicated metabolic disorder that cannot be explained by a single etiological pathway. The factors of insulin resistance mainly include the accumulation of abnormal lipid metabolites, the activation of the unfolded protein reaction (UPR) pathway and the innate immune signaling pathway [9]. c-Jun NH2-terminal kinases (JNK), a member of mitogen-active protein kinases (MAPKs) family, plays an important role in cellular stress response [10]. It is worth noting that the activation of JNK occurs in the above three mechanisms leading to insulin resistance [9]. Our previous studies showed that among the 88 genes associated with type 2 diabetes, only mitogen-activated protein kinase 8 (MAPK8) and insulin-like growth factor II (IGF-II) expression levels were significantly reduced. MAPK8, also known as JNK1, is closely related to the formation of insulin resistance in vivo [11]. Therefore, we selected the JNK inhibitor SP600125, a small molecule compound, to treat primary cells and block the JNK signaling pathway to increase insulin sensitivity. By detecting the key molecule AKT and its phosphorylation level in the insulin signaling pathway, we found that SP600125 can significantly promote insulin signaling, which is consistent with previous researches [12]. In the present study, ApoM was overexpressed in mouse primary skeletal myocytes by lentiviral transfection, and the JNK signaling pathway was blocked by the JNK inhibitor SP600125. The results showed that the expression level of ApoM mRNA in the ApoM+SP600125 group was significantly higher than that in the ApoM group, suggesting that increased insulin sensitivity could promote the expression of ApoM. Furthermore, ApoM overexpression in primary skeletal myocytes significantly increased the expression of p-AKT protein compared to the Ctrl group, whereas there was no significant difference in primary hepatocytes. This result indicates that ApoM can promote the activation of the insulin signaling pathway in skeletal myocytes. We speculated that this may be related to the inconsistent transfection efficiency of the same titer of lentivirus in the two primary cells, and the difference in the number and affinity of insulin receptors on the cell membrane surface. Insulin sensitivity is affected by both the number of insulin receptors and their affinity. Either decrease in insulin receptor affinity or decrease in the number of insulin receptors can reduce insulin sensitivity and even lead to insulin resistance [13]. With further analysis of the experimental results, we demonstrated that that ApoM is capable of promoting the activation of insulin signaling pathway. MAPK signaling pathway including JNK and p38 is one of the important ways of signal transduction of eukaryotic cells and one of the key targets for glucose transportation [14]. The activation agent of p38 MAPK pathway is similar to the JNK pathway. Studies have manifested that enhanced p38,MAPK can induce apoptosis of beta cell in pancreas islet and impair cell’s sensitivity to glucose [15]. ApoM, predominantly rich in HDL, plays an important role in regulating cholesterol outflow by affecting the formation of pre beta-HDL. In HDL, S1P binds with ApoM and then activates downstream MAPK and AKT pathways, compensate for reduced expression of Cyclooxase-2(COX-2) in glycated HDL, which has protective effect on people with type 2 diabetes [16]. ApoM can increase insulin secretion through maintaining S1P concentrations both in vivo and in vitro, which can help improve outcomes in diabetic patients [17].
In conclusion, we demonstrated that the increase of insulin sensitivity can promote the expression of ApoM, while ApoM overexpression can also promote the activation of insulin signaling pathway, whereby resulting in positive feedback regulation effect to further promote glucose and lipid metabolism cascade reactions. However, the specific mechanism requires further investigation.
Acknowledgment
This research was supported by the Natural Science Foundation of Jiangsu province (BK20151179), the International Cooperation Foundation of Changzhou (CZ20150012) and the Changzhou High-Level Medical Talents Training Project (No: 2016ZCLJ002).
References
- Wolfrum C, Poy MN, Stoffel M (2005) Apolipoprotein M is required for prebeta-HDL formation and cholesterol efflux to HDL and protects against atherosclerosis. Nature medicine 11(4): 418-422.
- Plomgaard P, Dullaart RP, De Vries R, Groen AK, Dahlback B, et al. (2009) Apolipoprotein M predicts pre-beta-HDL formation: Studies in type 2 diabetic and nondiabetic subjects. Journal of internal medicine 266(3): 258-267.
- Richter S, Shih DQ, Pearson ER, Wolfrum C, Fajans SS, (2003) Regulation of apolipoprotein M gene expression by MODY3 gene hepatocyte nuclear factor-1alpha: Haploinsufficiency is associated with reduced serum apolipoprotein M levels. Diabetes 52(12): 2989-2995.
- Zhang X, Jiang B, Luo G, Nilsson EP, Xu N (2007) Hyperglycemia downregulates apolipoprotein M expression in vivo and in vitro. Biochimica et biophysica acta 1771(7): 879-882.
- Luo G, Shi Y, Zhang J, Mu Q, Qin L, et al. (2014) Palmitic acid suppresses apolipoprotein M gene expression via the pathway of PPARbeta/delta in HepG2 cells. Biochemical and biophysical research communications 445(1): 203-207.
- Xu N, Nilsson EP, Ahren B (2006) Suppression of apolipoprotein M expression and secretion in alloxan-diabetic mouse: Partial reversal by insulin. Biochemical and biophysical research communications 342(4): 1174-1177.
- Schmittgen TD, Livak KJ (2008) Analyzing real-time PCR data by the comparative C(T) method. Nature protocols 3(6): 1101-1108.
- Samuel VT, Shulman GI (2012) Mechanisms for insulin resistance: Common threads and missing links. Cell 148(5): 852-871.
- Solinas G, Becattini B (2017) JNK at the crossroad of obesity, insulin resistance, and cell stress response. Molecular metabolism 6(2): 174- 184.
- Kumar A, Singh UK, Kini SG, Garg V, Agrawal S, et al. (2015) JNK pathway signaling: A novel and smarter therapeutic targets for various biological diseases. Future medicinal chemistry 7(15): 2065-2086.
- Kaneto H, Nakatani Y, Miyatsuka T, Kawamori D, Matsuoka TA, et al. (2004) Possible novel therapy for diabetes with cell-permeable JNKinhibitory peptide. Nature medicine 10(10): 1128-1132.
- Thorsson AV, Hintz RL (1977) Insulin receptors in the newborn. Increase in receptor affinity and number. The New England journal of medicine 297(17): 908-912.
- Kim N, Lee JO, Lee HJ, Lee YW, Kim HI, et al. (2016) AMPK, a metabolic sensor, is involved in isoeugenol-induced glucose uptake in muscle cells. The Journal of endocrinology 228(2): 105-114.
- Solas M, Gerenu G, Gil-Bea FJ, Ramirez MJ (2013) Mineralocorticoid receptor activation induces insulin resistance through c-Jun N-terminal kinases in response to chronic corticosterone: Cognitive implications. Journal of neuroendocrinology 25(4): 350-356.
- Chen W, Lu H, Yang J, Xiang H, Peng H (2016) Sphingosine 1-phosphate in metabolic syndrome (Review). International journal of molecular medicine 38(4): 1030-1038.
- Frej C, Mendez AJ, Ruiz M, Castillo M, Hughes TA, et al. (2017) A Shift in ApoM/S1P between HDL-particles in women with type 1 diabetes mellitus is associated with impaired anti-inflammatory effects of the ApoM/S1P complex. Arteriosclerosis Thrombosis and Vascular biology 37(6): 1194-1205.
© 2019 Guanghua Luo,Ning Xu. This is an open access article distributed under the terms of the Creative Commons Attribution License , which permits unrestricted use, distribution, and build upon your work non-commercially.
 a Creative Commons Attribution 4.0 International License. Based on a work at www.crimsonpublishers.com.
Best viewed in


.jpg)


 Editorial Board Registrations
 Submit your Article
 Refer a Friend
 Advertise With Us
.jpg)


.jpg)


.bmp)
.jpg)
.png)
.jpg)


.jpg)


.png)

.png)


.png)


