- Submissions

Full Text
Integrative Journal of Conference Proceedings
Energy Producing and Consumption in Georgia
Demur Chomakhidze1*, Lali Zivzivadze2, Akaki Kiladze2, Mariam Kuchava2 and Sophio Silagadze2
1 Georgian Technical University, Georgia
2 Akaki Tsereteli State University, Georgia
*Corresponding author:Demur Chomakhidze, Georgian Technical University, Georgia
Submission: January 28, 2019;Published: February 21, 2019

Volume1 Issue1February 21,2019
Abstract
The paper investigates the energy balance of Georgia. To that end, the production and consumption of fuel and energy resources are analyzed for the 26-year period of independence of Georgia. The analysis is done by categories of energy resources and main sectors of industry. Data regarding the export and import of energy resources and level and dynamics of covering country’s consumption by local production is provided. The energy balance of Georgia suggests that in Georgia there are some achievements as challenges. Positively can be assessed the fact that during 2013-2017 years, aggregated energy balance of Georgia was carried out, while it was not possible for the fast 20 years. Another achievement can be seen, an increase of renewable energy resources in energy production structure [1]. It is shown that, traditionally, the energy balance of Georgia is in deep deficit. Moreover, energy intensity and electricity intensity of Gross domestic product (GDP) in Georgia is higher than in other countries. Not satisfying condition can be noted in consumption of energy within sectors, as in structure of production. The article provides improvements for reduction of balance deficit. The country imports almost all amount of oil and natural gas. Electricity balance is relatively stable. In the recent years, some amount of electivity is exported to the neighboring countries. Generally, the country satisfies only 30-35% of own energy consumption by local generation, and the rest amount of resources are imported from abroad [2]. The reason for deficit to some extent is irrational and wasteful consumption of energy resources. The article examines the organizational difficulties in drawing up energy balance of Georgia and statistical problems of recording of energy production and consumption at the initial stage of market economy [3].
Keywords: Georgia; Energy balance; Electricity; Oil products; Natural gas
Introduction
Energy balance of Georgia poster for energy 7 symposium
Georgian National Energy and Water Supply Regulatory Commission, Tbilisi 0194, Georgia.
A. Georgia is located in the South Caucasus, on the crossroad of eastern Europa and western Asia
B. Area 69 700km2, from which 20% is occupied by Russia
C. Population: 3,720,400 (1.1.2018)
D. Capital: Tbilisi
E. Currency: GEL (1 GEL=2.66$ 01.01.2019)
F. GDP: 37846,6mln gel (2017)
G. Not very rich country in fuel and energy resources, but almost all kinds of these resources are found in its territory in greater or lesser amounts [4].
H. The rivers hold huge amounts of hydropower, largely compensating for fuel shortage in the country. Currently, resources of technical hydropower are utilized at only 12%
I. Georgia is rich in alternative sources (solar, thermal waters, wind, etc.).
Role and importance
a) Energy Balance (EB) in Georgia is of great importance.
b) Most significant material balances are fuel and energy balances which comprise all types of fuel and energy resources differing by origin and types of consumption and enable to determine amount and structure of producing and consuming such resources [5].
c) Energy balances are reflected in the amounts and structure of the fuel and energy consumption within industrial structures that points out economic growth and industrial development level of the country.
Brief historical overview
a. During Soviet period energy balances in all former Soviet countries, including Georgia were drawn up once every 5 years.
b. Energy Balances have not been drawn up in Georgia approximately for 22 years. (1991-2012) (Figure 1).
c. The cause was the fact that statistical forms approved during the period of planned economy differed from International forms of statistics approved for similar reasons.
d. In 1991-2012, there was no statistics of energy balance of Georgia, the author, Demur Chomakhidze, with his own initiative carried out statistics of EB.
e. With the help of international organizations, significant changes took place in Georgia in 2013-2014. Particularly, GEOStat targeted at developing energy balances in compliance with international standards. 3 Publications have been issued [6] (Table 1).
f. During the transition period (1991-1995) energy generation and consumption were characterized by a decreasing trend. Where as in the following years (1996-2000) the trend started to go up.
g. During 1991e1995 energy generation decreased by 2.3 times, end-use by 7.1 times [7].
h. During 1996-2000 the energy. Generation increased by 51.7% and 19%. The deficit decrease trend is still going on.
Figure 1:Energy Balance of Georgia 1991-2012.
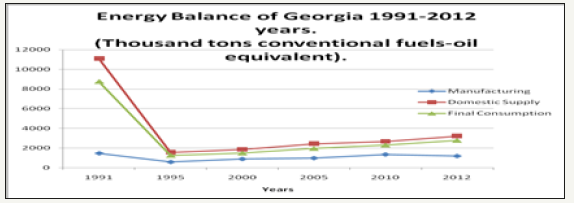
Table 1:Energy balance of Georgia 1991-2002 year. (Thousand tons convertional fuels-oil equivalent).

It is clearly demonstrated that
i. The consumption of energy resources of Georgia in the period of the independence of Georgia increased more than the energy generation [8].
ii. The rate of energy resources consumption has gradually improved where as in the first years of the transition period the energy resources were wasted that was typical for the Soviet period [9].
Balance of the last decades the aggregated energy balance
A. In the last 2013-2017, the energy sector has undergone significant quantitative and qualitative changes:
a. The rate of growth of the country’s economy.
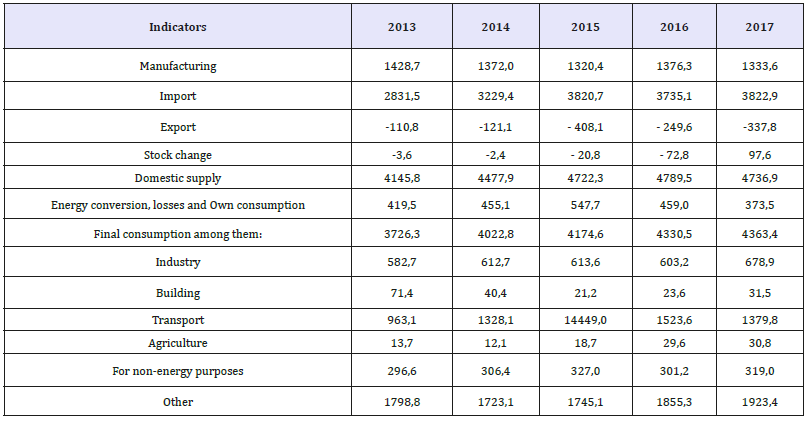
b. The condition of the world economic and energy markets (Table 2 and Figure 2).
B. Formation of fuel and energy complex oriented on own resources and expanding the use of hydro and other renewable resources.
C. Formation of a favorable investment environment, formation of the complex based on the energy of the future [10].
D. In 2004-2015 production of energy resources has increased by 37.1% and final consumption by 92.2%.
E. Share of local resources in gross supply of fuel and energy resources has decreased (from 40.2- 28.2%).
F. In 2013-2015 local production was reduced due to the reduction of coal, crude oil, biofuel and wastes and has increased due to increasing of natural gas, hydropower, geothermal power, solar power etc. The trend continues 2016- 2017 in years [11].
Figure 2:Thousand tons conventional fuels-Oil equivalent.
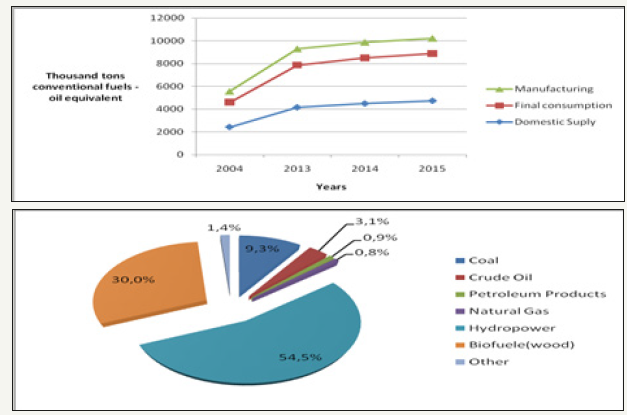
Table 2:Aggregated energy balance of Georgia 2013-2017 years.
Electricity balance (Table 3)
Table 3:Balance of electric of Georgia in 2005-2017 years (mln kWt, hour).
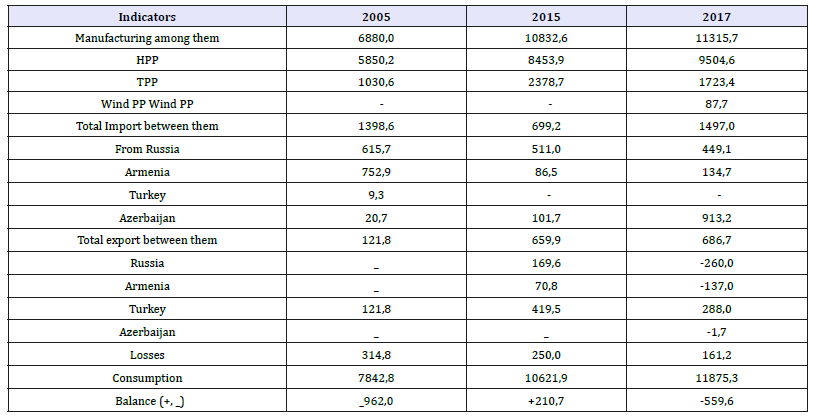
Figure 3:Balance of electric of Georgia in 2005-2015 years.

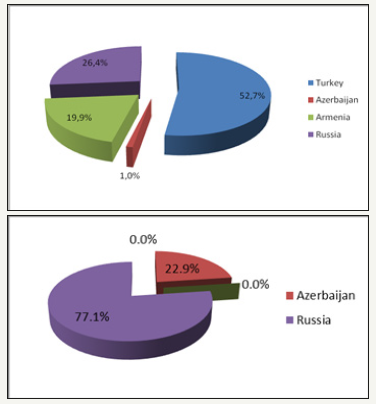
In 2015, the share of import in gross domestic supply has reached 80.9%. Electricity export from Georgia is mainly carried out in spring and summer [12]. In 2015, Energy resource manufacturing and domestic supply decreased a little. Final consumption increased a little. During this analyzing period, especially in the last years there isn’t shortage in electricity balance (Figure 3).
Country exports certain amount of electricity. In 2005-2015, electricity exports increased 5.4 times, while import reduced by half. As for the electricity generation and consumption, in these years the first one increased by 57.4% and the second one by 35.4%. The main part of electricity generation (78%, 2015) comes from hydropower plants while technical capability of our country’s rich hydro resources is utilized only by 12.3% in this year. In 2016 electric energy production increased by 7% and reached the Maximum level (11.6 billon kWh) Export 2016 (Figure 4).
The same situation is in all segments of energy sector. It should be especially noted that despite serious deficit, energy intensity and electricity intensity of Gross domestic product (GDP) in Georgia are higher than in other countries. Reduction of energy intensity of GDP is an important reserve for improvement of energy balance.
The Table 2 shows that 2013-2017, the import volume was increased from 2831,5 tones to 3822,9 (by 35%), while export was decreased from 110,8 tones to 337,8 (3times less) [13]. The production of local resources decreased by 6,7% (from 1428,7- 1333,6). Accordingly, supply of local resources to the country decreased from 38,3 to 30,5% [14].
Figure 4:In 2016 electric energy production increased by 7% and reached the Maximum level (11.6 billon kWh) Export 2016.
However, during this period some positive tendencies can be observed. Namely, the production of renewable energy resources increased by 12,9% (from 726,6-820,1) and the portion of renewable energy resources became higher from the total energy production by 10,7%. (From 50,8%-61,5%). Between 1991-2010, local production decreased from 1461 tones to 1339, so by 8,4% [15].
In Georgia, energy usage is not in a right way. Namely, 3-4 times more energy is consumed on GDP, than in developed countries. And this causes a big energy balance deficit. For a deep energy balance analysis, developing an econometric modeling would be useful that should be carried out in near future.
References
- Chomakhidze D (2014) Georgia’s energy sector; economics, regulation, technology, statistics. Tbilisi, Georgia.
- Gvelesiani T, Chomakhidze D (2011) Georgia’s energy security. Tbilisi, Georgia.
- Chomakhidze D (2012) The regulation principles of sustainable energy development. Georgian Technical University, Tbilisi, Georgia.
- Tavadze G, Chomakhidze D (2005) Natural monopolies and their regulation. Tbilisi: Publishing house Tergi, Georgia.
- Locmelis K, Bariss U, Blumberga D (2017) Latvian energy policy on energy intensive industries. Energy Procedia 113: 362-368.
- Khabdullin A, Khabdullina Z, Khabdullin A, Khabdullina G, Lauka D, et al. (2017) Analysis of industrial electricity consumption flexibility. Assessment of saving potential in Latvia and Kazakhstan. Energy Procedia 113: 450-453.
- (2016) Georgian National Energy and Water Supply Regulatory Commission, Tbilisi, Georgia.
- Energy Balance of Georgia (2016) Statistical Publication. National Statistics Office of Georgia, Tbilisi, Georgia.
- Energy Balance of Georgia (2015) Statistical Publication National Statistics Office of Georgia, Tbilisi, Georgia.
- Energy Balance of Georgia (2018) Statistical Publication National Statistics Office of Georgia, Tbilisi, Georgia.
- Electricity balance of Georgia 2016. Electricity Market Operator. Tbilisi, Georgia.
- (2015) Georgian National Energy and Water Supply Regulatory Commission. Tbilisi, Georgia.
- (2014) Georgian National Energy and Water Supply Regulatory Commission. Tbilisi, Georgia.
- Chomakhidze D (2016) Energy Balance of Georgia. Annals of Agrarian Science 14(3): 196-200.
- (2016) Key World Energy Statistics.
© 2018 Demur Chomakhidze. This is an open access article distributed under the terms of the Creative Commons Attribution License , which permits unrestricted use, distribution, and build upon your work non-commercially.
 a Creative Commons Attribution 4.0 International License. Based on a work at www.crimsonpublishers.com.
Best viewed in


.jpg)


 Editorial Board Registrations
 Submit your Article
 Refer a Friend
 Advertise With Us
.jpg)


.jpg)


.bmp)
.jpg)
.png)
.jpg)


.jpg)


.png)

.png)


.png)


