- Submissions

Full Text
Gastroenterology Medicine & Research
Role of Biofield Energy Healing Treatment Based Test Formulation on Colon Cytokines Using TNBS-Induced Ulcerative Colitis in Sprague Dawley Rats
Mahendra Kumar Trivedi1* and Snehasis Jana2
1Trivedi Global, Inc, Henderson, Nevada, USA
2Trivedi Science Research Laboratory Pvt Ltd, Thane-West, Maharashtra, India
*Corresponding author:Mahendra Kumar Trivedi, Trivedi Global, Inc, Henderson, Nevada, USA
Submission: January 27, 2021;Published: February 11, 2021
ISSN 2637-7632Volume5 Issue4
Abstract
A novel test formulation was formulated and the study aimed to evaluate the therapeutic effect of Biofield Energy Healing (the Trivedi Effect®-Consciousness Energy Healing) based test formulation on the colon cytokines. Each ingredient of the test formulation was divided into two parts, one part was defined as control and the other part was described as the Biofield Energy Treated test formulation, which received Biofield Energy Healing Treatment by a renowned Biofield Energy Healer Mr. Mahendra Kumar Trivedi. The expression of colon C-reactive protein (CRP) and pro-inflammatory cytokines viz. tumor necrosis factor-α, (TNF-α), interleukin-6 (IL-6), interleukin-10 (IL-10), IL-23, interferon-γ (IFN-γ), and tumor growth factor-β (TGF-β) was determined by ELISA method. CRP level was significantly decreased by 38.5% (p<0.01), 22.3%, 51.2% (p<0.01), 43.9% (p<0.01), and 56.4% (p<0.01) in G5: Biofield Energy Treated test formulation; G6: Biofield treatment per se to animals (-15 days), G7 (Biofield Energy Treated test formulation at day -15), G8: Biofield Energy Treatment per se to animals plus Biofield Energy Treated test formulation (-15 day), and G9 (Biofield Treatment per se (day-15) to animals plus untreated test formulation) groups, respectively as compared with the disease control (G2) group. The TGF-β level among the tested groups such as G5, G7, G8, and G9 was significantly decreased by 19%, 28.5% (p<0.001), 19.3%, and 11.6%, respectively as compared with the G2 group. In addition, the level of IL-23 was significantly (p≤0.001) decreased by 71.1% and 62.4% in the G7 and G8 groups, respectively with respect to the G2 group. The level of IL-6 was significantly decreased by 14.9%, 45% (p<0.001), 39.3% (p<0.001), and 20.9% (p<0.001), in the G6, G7, G8, and G9 groups, respectively as compared with the G2 group. The level of TNF-α was significantly reduced by 12.2%, 30% (p<0.001), 59.1% (p<0.001), 49.2%, and 15.5% (p<0.001) in the G5, G6, G7, G8, and G9 groups, respectively as compared with the G2 group. Further, the level of IFN-γ was significantly decreased by 15.6%, 40.5% (p<0.001), 62.1% (p<0.001), 52.6% (p<0.001), and 28.4% by G5, G6, G7, G8, and G9 respectively, as compared with the G2. Besides, IL-10 level was significantly increased by 31.7% (p<0.001), 14.3%, and 18.7% (p<0.05) in the G5, G6, and G9 groups, respectively as compared with the G2. Thus, it can be concluded that the Trivedi Effect®-Consciousness Energy Healing significantly modulates the colon cytokines after treatment with the test formulation and Biofield Energy Treatment per se. Thus, the Biofield Energy Treated test formulation can be utilized against many inflammatory bowel diseases (IBDs), including Crohn's disease and ulcerative colitis, hepatic, colitis, gastrointestinal, and neurodegenerative along with various other factors such as microbial, parasitic and viral inflammatory responses.
Keywords: Biofield energy healing; The Trivedi effect®; Inflammatory bowel diseases; Inflammatory cytokines; CRP
Introduction
The correlation of the gut health, micro biota, and cytokines have been well studies and reported in past two decades against various inflammatory bowel diseases (IBDs) and associated mucosal inflammations. The cytokines play a key role in the mechanism of the diseases and can suggest the development of the new therapies. The cytokines play an important response mechanism in inflammation especially in Crohn’s disease and ulcerative colitis. The pathogenesis of IBDs are not completely understood, but the role of cytokines in the intestinal immune system has significant impact in disruption of normal state of controlled gut inflammations [1]. These are the small peptides proteins formed by the immune cells, which helped in cellular communication among cells, motivate the antigen specific effector cells proliferation, and also regulates the local and systemic inflammation in various pathways such as autocrine, paracrine, and endocrine [2]. Innate immune response is the major response in gut inflammation and its related diseases. Most of the cytokines are secreted by activated dendritic cells and the macrophages, which regulates the inflammatory response in gut inflammatory diseases. Once, these cytokines are secreted by antigen presenting cells, they trigger and differentiate various T cells by activating adaptive immune response. Gut inflammation dysregulates the T cells, and manage the over-reactive and auto-reactive cells along with the present imbalance of Treg/Th1, Th2 and Th17 cells. T cell irregulation or its overproduction leads to the development of gut inflammatory diseases [3]. These cells along with various types of cytokines play a complex role in inflammatory gut diseases [4]. These cellular interactions are regulated using both pro or anti-inflammatory cytokines (TNF-α, INF-γ, IL-1, IL-6, IL-4, IL-5, IL10, and TGF-β) and different defined cytokines such as IL-13, IL-12, IL-18, IL-23 [5]. In addition, cytokines mediate various vital common responses such as inflammatory mediator’s production regulation, along with regulation of leukotriens, reactive oxygen metabolites, platelet-activating factor, nitric oxide, and activation of the nuclear factor κB (NF-κB), inhibition of apoptosis, and prostaglandins in determination of the nature of the immune response [6]. Thus, there is the need of some novel formulation which alters the level of cytokines to improve the gut health. The present study aimed to test the impact of the Biofield Energy Treatment per se and the effect of the test formulation comprised of zinc chloride, ferrous sulphate, copper chloride (II-cupric), vitamin B6 (Pyridoxine HCl), vitamin B12 (Cyanocobalamin), magnesium (II) gluconate, and cholecalciferol (Vit. D3) against the colon cytokines. The novel test formulation was treated with Biofield Energy Healing Treatment, as one of the best CAM approach with significant therapeutic outcomes. Biofield Energy Healing is one of the emerging frontiers aspect to CAM and various clinical approach has been used with significant results [7-10]. Various scientific reports reported the importance of Biofield Energy against various pathogenic cases such as improved immune function of cervical cancer patients and many more [11,12]. CAM therapies have been recommended by The National Center for Complementary/Alternative Medicine (NCCAM) and there therapies exist in various forms such as external qigong, Johrei, Reiki, therapeutic touch, yoga, Qi Gong, polarity therapy, Tai Chi, pranic healing, deep breathing, chiropractic/osteopathic manipulation, guided imagery, meditation, massage, homeopathy, hypnotherapy, progressive relaxation, acupressure, acupuncture, special diets, relaxation techniques, Rolfing structural integration, healing touch, movement therapy, pilates, mindfulness, Ayurvedic medicine, traditional Chinese herbs and medicines in biological systems both in vitro and in vivo. Human Biofield Energy has subtle energy that has the capacity to work in an effective manner [13] with its various clinical benefits [14]. This energy can be harness and transmit it into living and non-living things by the process of Biofield Energy Healing Treatment. Biofield Energy Treatment (the Trivedi Effect®- Consciousness Energy Healing Treatment) has been extensively studied with significant outcomes in the field of pharmaceuticals [15-17], nutraceuticals [18,19], metals and ceramics [20-22], microbiology [23-25], microbial genetics [26,27], cancer research [28,29], livestock, agriculture science [30-32], improved bioavailability of many compounds [33-35], improved skin health [36,37], improved properties of nutraceuticals [38,39], improved overall bone health [40-42], human health and wellness. Thus, the study was planned on colon cytokines estimation that could significantly helped to improve the prevalence of gut inflammatory diseases using novel test formulation consisting of minerals such as Mg, Zn, Fe, Cu and vitamins including B6, B12, D3 using TNBS (Tri Nitro Benzene Sulfonic acid)-induced ulcerative colitis in SD rats.
Materials and Methods
Chemicals and reagents
Copper chloride, cholecalciferol (vitamin D3), sodium carboxymethyl cellulose (Na-CMC), Sulphasalazine, and iron (II) sulfate were procured from Sigma-Aldrich, USA. Pyridoxine hydrochloride (vitamin B6), zinc chloride, cyanocobalamin (vitamin B12), and magnesium (II) gluconate were purchased from TCI, Japan. TNBS (Trinitro Benzene Sulphonic acid) was purchased from HiMedia, India. All the other chemicals used in this experiment were analytical grade procured from India.
Experimental animals
Randomly breed male Sprague Dawley (SD) rats with body weight around 220 to 350gm were used in this study. The animals were purchased from M/s. National Institute of Biologicals, India. Animals were randomly divided into nine groups based on their body weights consist of eight animals of each group. They were kept individually in sterilized polypropylene cages with stainless steel top grill having provision for holding pellet feed and drinking water bottle fitted with stainless steel sipper tube. The animals were maintained as per standard protocol throughout the experiment.
Consciousness energy healing strategies
The novel test formulation was divided into two parts. One part of each ingredient was considered as control, where no Biofield Energy Treatment was provided. Another part of each ingredient received Biofield Energy Treatment by Mr. Mahendra Kumar Trivedi (known as the Trivedi Effect®) under laboratory conditions for ~3 minutes. In addition, three different test group as per experimental protocol, the animals were also received Biofield Energy Treatment under laboratory conditions for ~3 minutes. The blessing/treatment was given to the test items by his physical presence without touching in the laboratory of Dabur Research Foundation, near New Delhi, India. Similarly, the control samples were subjected to “sham” healer under the same laboratory conditions for ~3 minutes. The “sham” healer did not have any knowledge about the Biofield Energy Treatment. After that, the Biofield Energy Treated samples were kept in the similar sealed condition. The Biofield Energy Treated animals were also taken back to the animal experimental room for further proceedings.
Experimental test groups
The colon cytokines along with CRP were estimated using experimental setup, which was divided into 9 animals groups from G1 to G9. G1 denoted as normal control with vehicle (0.5% CMC), G2 group defined as colitis control, with 50% TNBS in ethanol using intra colonic route, G3 group included reference compound i.e. sulfasalazine (250mg/kg), G4 group included administration of untreated test formulation, G5 included Biofield Energy Treated test formulation, G6 group denoted as Biofield Energy Treatment per se to the animals (Day-15) along with vehicle (0.5% CMC), G7 group defined as Biofield Energy Treated test formulation from day-15, G8 group included Biofield Energy Treatment per se to the animals along with Biofield Energy Treated test formulation from day-15, and G9 group animals were administered with the Biofield Energy Treatment per se (day-15) to the animals along with the untreated test formulation. 50% TNBS in ethanol was given to the entire test group except G1.
Experimental procedure
Five days after acclimatization, animals were randomized and grouped based on their body weight. Groups G1, G2, and G6 were treated with 0.5%w/v CMC-Na in distilled water for 8 weeks (Day 1 to 56). Group 3 was treated orally with sulphasalazine (reference item) at a dose of 250mg/kg body weight for 8 weeks. The freshly prepared suspensions of untreated and Biofield Energy Treated Test formulation were administered orally to the G4 and G5 groups at a dose of 130.525mg/kg for 8 weeks. Similarly, group G7 and G8 group were treated with test formulation at a dose 130.525mg/kg from the day of Biofield Energy Treatment (day-15 to 56), while in group G9, Biofield Energy Treated animals were treated with untreated test formulation for 8 weeks. Before the induction of experimental colitis, a short fasting preceded. The duration ranged from 12 to 18 hours, while the chronic colitis was induced by intra colonic administration of TNBS-50% ethanol in a total volume of 400μL, at a dose of 10mg/rat. TNBS was instilled by a suitable medical-grade polyurethane catheter for enteral feeding approximately 8 cm proximal to the anal verge. Accordingly, TNBS injection was given on day 1, 8, 15, 21, 27, 34, 40, 48, and 54. After the end of the experiment, the colon was subsequently divided longitudinally into different pieces, homogenized and stored in -80°C for estimation of cytokines present in colon such as TNF- a, IL-6, IL-10, IL-23, IFN-γ, TGF-β, and C-reactive protein (CRP).
Assessment of colon cytokines and C-reactive protein
Colon cytokines were estimated using standard ELISA assay followed by manufacturer instructions. Colon tissue of all the animals after completion of the experiment was examined for colon cytokines and CRP. The colon was divided longitudinally into different pieces, homogenized, and stored in -80°C for further used for ELISA assay for testing cytokines using standards kits. The colon homogenate (100 mg tissue/mL) was subjected to the analyses of colon cytokines, biomarkers testing. The detailed test procedure of manufactured instructions was used for identification of cytokines using individual ELISA kit. Following kits such as Ray Biotech for rat IL-6, TNF-alpha, IFN-gamma, and IL-10, while TGF-β were tested using Enzo ELISA Kit, and interleukin 23(IL-23) and CRP level was tested using CUSABIO, ELISA Assay Kit as per manufacturer instructions.
Statistical analysis
The data was expressed as mean±SEM. Data was subjected to statistical analysis using Graph Pad Prism Software (PRISM Software, Version 5.0). ANOVA followed by Bonferroni and Dunnett’s test with a comparison among the control and the treatment groups. p<0.05 was considered as statistically significant.
Results and Discussion
Effect of the test formulation on Colon C - reactive protein (CRP)
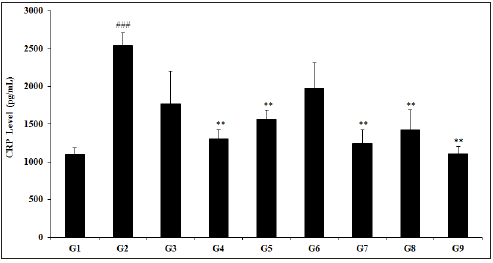
The effect of test formulation and Biofield Energy treatment per se on colon CRP level are presented in Figure 1. The CRP level among various test groups such as TNBS (G2) group was 2539.44±169.40pg/mL, which was significantly (p<0.001), higher than control (G1) group 1103.92±79.39pg/mL. Sulphasalazine treatment (G3) decreased CRP level (1362.40±153.87pg/mL) as compared to the G2 group. The test groups such as G4 (1303.47±122.99pg/mL), G5 (1562.19±117.67pg/mL), G6 (1973.96±336.71pg/mL), G7 (1240.42±184.65pg/mL), G8 (1424.03±270.58pg/mL), and G9 (1108.09±95.10pg/mL) groups showed a significantly decreased CRP as compared with disease control group. In comparison with the G2 group, the CRP level was significantly decreased by 38.5% (p<0.01), 22.3%, 51.2% (p<0.01), 43.9% (p<0.01), and 56.4% (p<0.01) in the G5, G6, G7, G8, and G9 groups, respectively. Besides, data suggested that the level of CRP was decreased by 4.8% and 15% in G7 and G9 groups, respectively as compared with the untreated test formulation group (G4). CRP has been treated as highly sensitive protein biomarker used for pathogenesis and other inflammation in gut inflammatory diseases [43]. Thus, data suggested significant reduced level of CRP after Biofield Energy Treatment using novel test formulation.
Figure 1: Effect of Biofield Energy Healing Treated Test formulation on change in colon CRP level in TNBS-induced Ulcerative Colitis Animal Model. G1: Normal control; G2: Disease control (50% TNBS in ethanol, (10mg); 400µL through intra-colonic route); G3: Sulphasalazine, 250mg/kg; G4: Untreated test formulation; G5: Biofield Energy Treated test formulation; G6: Biofield treatment per se to animals (-15 days); G7: Biofield Energy Treated test formulation (-15 day); G8: Biofield Energy Treatment per se to animals plus Biofield Energy Treated test formulation (-15 day); and G9: Biofield Energy Treatment per se to animals plus untreated test formulation. All the values are represented as mean ± SEM (n=8). ###p≤0.001 vs. G1 and **p≤0.01 vs. G2.
Effect of the test formulation on colon tumor growth factor-β (TGF-β)
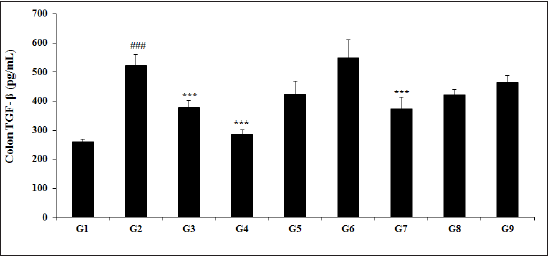
The effect of colon cytokines for the estimation of TGF- β is presented in Figure 2. The TGF-β activity in the animal colon treated with TNBS (G2) was 523±36.9pg/mL, which was significantly (p<0.001) higher than that of the normal control (G1) group 260.1±8.5pg/mL. Sulphasalazine treatment (G3) significantly (p<0.001) reduced the TGF-β activity (376.8±24.4pg/mL). The experimental test groups such as G4 (285.3±14.8pg/mL), G5 (423.8±43.8pg/mL), G6 (548.7±62.2pg/mL), G7 (373.7±39.1pg/mL), G8 (421.8±17.3pg/mL), and G9 (462.5±24.4pg/mL) groups showed a significantly decreased colon TGF-β level as compared with G2 group. The TGF-β level among the tested groups such as G5, G7, G8, and G9 was significantly decreased by 19%, 28.5% (p<0.001), 19.3%, and 11.6%, respectively as compared with the G2 group. Scientific studies suggested that TGF-β is regarded as one of the master regulator, which balance the gut microbiota and immune cell interactions [44], that has significant role in gut inflammatory diseases.
Figure 2: Effect of biofield energy healing treated test formulation on change in colon TGF-β level in TNBS-induced ulcerative colitis animal model. G1: Normal control; G2: Disease control (50% TNBS in ethanol, (10mg); 400µL through intra-colonic route); G3: Sulphasalazine, 250mg/kg; G4: Untreated test formulation; G5: Biofield Energy Treated test formulation; G6: Biofield treatment per se to animals (-15 days); G7: Biofield Energy Treated test formulation (-15 day); G8: Biofield Energy Treatment per se to animals plus Biofield Energy Treated test formulation (-15 day); and G9: Biofield Energy Treatment per se to animals plus untreated test formulation. All the values are represented as mean ± SEM (n=8). ###p≤0.001 vs. G1 and ***p≤0.001 vs. G2.
Effect of the test formulation on colon interleukin-23 (IL-23)
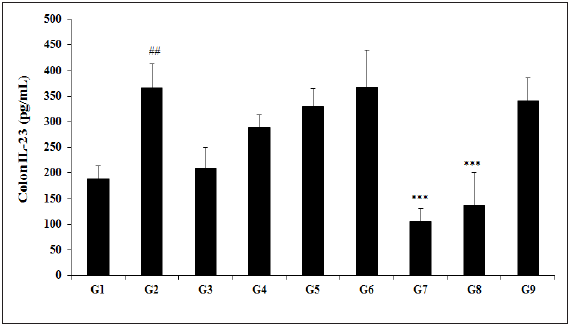
The results of Biofield Energy Treated test formulation with respect to the level of IL-23 are presented in Figure 3. The experimental data suggested in the animal colon treated with TNBS (G2) was 365.88±45.93pg/mL, which was significantly (p<0.01) higher than that of the normal control (G1) group 187.83±25.93pg/mL. Sulphasalazine treatment (G3) decreased the level of IL-23 (209.78±40.11pg/mL) as compared to the G2. The experimental test groups such as G4 (288.80±24.09pg/mL), G5 (330.15±34.54pg/mL), G6 (366.98±72.72pg/mL), G7 (105.88±25.23pg/mL), G8 (137.46±62.31pg/mL), and G9 (340.27±44.76pg/mL) groups showed a significantly decreased colon IL-23 level as compared with the G2 group. The level of IL-23 among the tested groups such as G5, G7, G8, and G9 was significantly decreased by 9.8%, 71.1% (p<0.001), 62.4% (p<0.001), and 7%, respectively as compared with the G2 group. Further, data also showed a significant decreased the level IL-23 by 63.3% and 52.4% in the G7 and G8 groups, respectively with respect to the untreated test formulation (G4) group. All major forms of inflammatory bowel diseases have severe inflammation and IL-10 family cytokines such as IL-22, IL-23, etc. plays a major role in healing and prevent the severity of the disease [45,46]. Thus, experimental data suggested significant decreased IL-23 level after Biofield Energy Treatment using novel test formulation, which suggested a novel cause of treatment of gut inflammatory diseases.
Figure 3:Effect of Biofield Energy Healing Treated Test formulation on change in colon IL-23 level in TNBS-induced Ulcerative Colitis Animal Model. G1: Normal control; G2: Disease control (50% TNBS in ethanol, (10mg); 400µL through intra-colonic route); G3: Sulphasalazine, 250mg/kg; G4: Untreated test formulation; G5: Biofield Energy Treated test formulation; G6: Biofield treatment per se to animals (-15 days); G7: Biofield Energy Treated test formulation (-15 day); G8: Biofield Energy Treatment per se to animals plus Biofield Energy Treated test formulation (-15 day); and G9: Biofield Energy Treatment per se to animals plus untreated test formulation. All the values are represented as mean ± SEM (n=8). ##p≤0.01 vs. G1 and ***p≤0.001 vs. G2
Effect of the test formulation on colon interleukin-6 (IL-6)
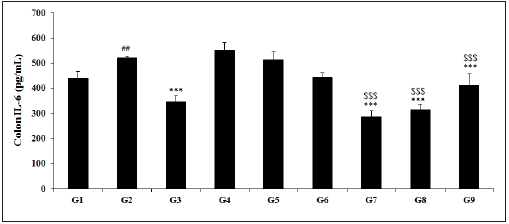
The colon level of IL-6 data after treatment with the Biofield Energy Treated Test formulation is displayed in the Figure 4. TNBS (G2) was 520.80±6.91pg/mL, which was significantly (p<0.01) higher than that of the control (G1) group 441.37±24.42pg/mL. Sulphasalazine treatment (G3) significantly (p<0.001) decreased the level of IL-6 (345.09±25.80pg/mL) with respect to the G2 group. The experimental test groups such as G4 (552.23±30.66pg/mL), G5 (513.55±31.80pg/mL), G6 (443.05±19.28pg/mL), G7 (286.55±24.20pg/mL), G8 (316.30±20.40pg/mL), and G9 (411.80±44.60pg/mL) groups showed a significantly decreased colon IL-6 level as compared with the G2 group. The level of IL-6 among the tested groups such as G5, G6, G7, G8, and G9 was significantly decreased by 1.4%, 14.9%, 45% (p<0.001), 39.3% (p<0.001), and 20.9% (p<0.001), respectively as compared with the G2 group. Besides, the experimental data also showed a significant decreased level IL-6 level by 7%, 19.8%, 48.1% (p<0.001), 42.7 (p<0.001), and 25.4% (p<0.001) in G5, G6, G7, G8, and G9 groups, respectively with respect to the untreated test formulation (G4) group. The data reported that the presence of IL-6 would be correlated with the cellular proliferation and repair of intestinal epithelial cells after injury [47]. Thus, experimental data suggested significant alteration in the level of IL-6 after Biofield Energy Treatment suggested a novel approach for treatment of gut inflammatory diseases.
Figure 4: Effect of Biofield Energy Healing Treated Test formulation on change in colon IL-6 level in TNBS-induced Ulcerative Colitis Animal Model. G1: Normal control; G2: Disease control (50% TNBS in ethanol, (10mg); 400µL through intra-colonic route); G3: Sulphasalazine, 250mg/kg; G4: Untreated test formulation; G5: Biofield Energy Treated test formulation; G6: Biofield treatment per se to animals (-15 days); G7: Biofield Energy Treated test formulation (-15 day); G8: Biofield Energy Treatment per se to animals plus Biofield Energy Treated test formulation (-15 day); and G9: Biofield Energy Treatment per se to animals plus untreated test formulation. All the values are represented as mean ± SEM (n=8). ##p≤0.01 vs. G1, ***p≤0.001 vs. G2 and $$$p≤0.001 vs. G4.
Effect of the test formulation on colon tumor necrosis factor-α (TNF-α)
Figure 5: Effect of Biofield Energy Healing Treated Test formulation on change in colon TNF-α level in TNBS-induced Ulcerative Colitis Animal Model. G1: Normal control; G2: Disease control (50% TNBS in ethanol, (10mg); 400µL through intra-colonic route); G3: Sulphasalazine, 250mg/kg; G4: Untreated test formulation; G5: Biofield Energy Treated test formulation; G6: Biofield treatment per se to animals (-15 days); G7: Biofield Energy Treated test formulation (-15 day); G8: Biofield Energy Treatment per se to animals plus Biofield Energy Treated test formulation (-15 day); and G9: Biofield Energy Treatment per se to animals plus untreated test formulation. All the values are represented as mean ± SEM (n=8). ***p≤0.001 vs. G2.
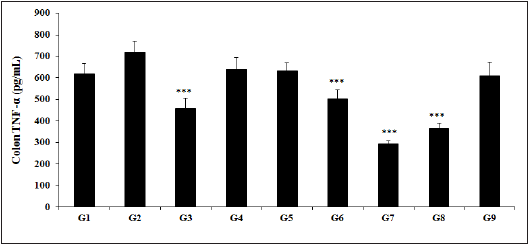
The Biofield Energy Treated test formulation with respect to the level of TNF-α in the colon is presented in Figure 5. Further, the animal study showed that TNBS (G2) group showed TNF-α level (720.21±48.99pg/mL), which was higher than that of the normal control (G1) group 617.22±49.70pg/mL. Sulphasalazine treatment (G3) significantly (p<0.001) decreased the level of TNF-α (458.85±45.78pg/mL) as compared with the G2 group. The experimental test groups such as G4 (642.21±51.13pg/mL), G5 (632.24±37.27pg/mL), G6 (503.92±41.16pg/mL), G7 (294.35±15.01pg/mL), G8 (365.92±24.40pg/mL), and G9 (608.74±64.44pg/mL) groups showed a significantly decreased colon TNF-α level as compared with the G2 group. The level of TNF-α among the tested groups such as G4, G5, G6, G7, G8, and G9 was significantly decreased by 10.8%, 12.2%, 30% (p<0.001), 59.1% (p<0.001), 49.2%, and 15.5% (p<0.001), respectively as compared with the G2 group. On the basis of experimental values, the TNF-α level was significantly reduced by 1.6%, 21.5% (p<0.001), 54.2% (p<0.001), 43% (p<0.001), and 5.2% by G5, G6, G7, G8, and G9 respectively, as compared with the untreated test formulation (G4) group. Various gut inflammatory diseases has been well studied with increased TNF-α level such as Crohn’s disease and many other inflammations [48]. However, experimental data showed a significant reduced level of TNF-α after Biofield Energy Treatment, which suggested the treatment, can be initiated in many inflammatory bowel diseases.
Effect of the test formulation on colon interferon- γ (IFN-γ)
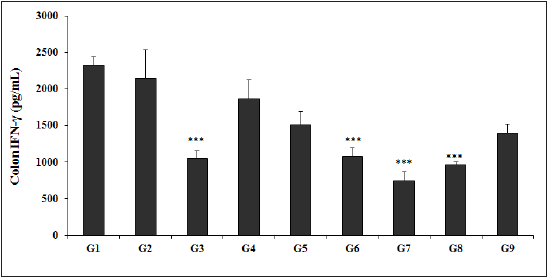
The experimental data of colon IFN-γ is presented in Figure 6, and the results of IFN-γ showed that TNBS (G2) group data was 2125.13±228.06pg/mL and found to be lower than that of the normal control (G1) group 2427.63±152.02pg/mL. Sulphasalazine treatment showed a significant (p<0.001) decreased level of IFN-γ (1237.63±191.36pg/mL) as compared with the G2 group. Further, level of IFN-γ in other experimental test groups such as G4 (2102.63±341.95pg/mL), G5 (1793.25±216.54pg/mL), G6 (1264.50±125.95pg/mL), G7 (806.38±147.04pg/mL), G8 (1006.38±49.24pg/mL), and G9 (1520.75±146.14pg/mL) groups showed a significantly decreased colon IFN-γ level as compared with the G2 group. The level of IFN-γ among the tested groups such as G5, G6, G7, G8, and G9 was significantly decreased by 15.6%, 40.5% (p<0.001), 62.1% (p<0.001), 52.6% (p<0.001), and 28.4%, respectively as compared with the G2 group. Besides, IFN-γ level was significantly decreased by 14.7%, 39.9%, 61.6%, 52.1%, and 27.7% by G5, G6, G7, G8, and G9 respectively, as compared with the untreated test formulation (G4) group. Colon IFN-γ has been studied with the gut immunity against various pathogenic infections along with various inflammations [49].
Figure 6: Effect of Biofield Energy Healing Treated Test formulation on change in colon IFN-γ level in TNBS-induced Ulcerative Colitis Animal Model. G1: Normal control; G2: Disease control (50% TNBS in ethanol, (10mg); 400µL through intra-colonic route); G3: Sulphasalazine, 250mg/kg; G4: Untreated test formulation; G5: Biofield Energy Treated test formulation; G6: Biofield treatment per se to animals (-15 days); G7: Biofield Energy Treated test formulation (-15 day); G8: Biofield Energy Treatment per se to animals plus Biofield Energy Treated test formulation (-15 day); and G9: Biofield Energy Treatment per se to animals plus untreated test formulation. All the values are represented as mean ± SEM (n=8). ***p≤0.001 vs. G2.
Effect of the test formulation on colon interleukin-10 (IL-10)
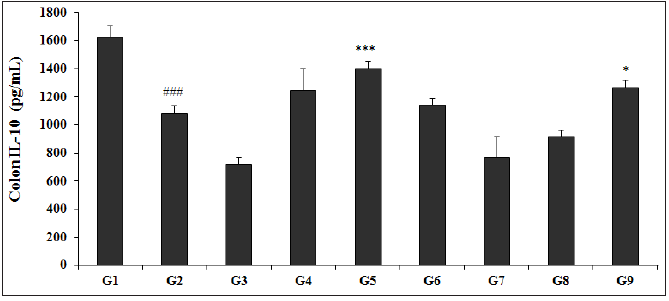
The Biofield Energy Treated test formulation with respect to the level of IL-10 in the colon is presented in Figure 7. The experimental results showed that the IL-10 level in the colon with TNBS (G2) was found to be 1328.43±49.61pg/mL, which was found to be significantly (p<0.001) lower than that of the normal control (G1) group, 1685±40.62pg/mL. Sulphasalazine treatment (G3) showed the level of IL-10 (955.75±65.11pg/mL). Further, the colon IL-10 level in other experimental test groups such as G4 (1520.25±155.59pg/mL), G5 (1749±81.20pg/mL), G6 (1518.50±83.22pg/mL), G7 (890.43±71.90pg/mL), G8 (1042.0±69.84pg/mL), and G9 (1576.75±98.49pg/mL) groups showed a significantly increased colon IL-10 level as compared with the G2 group. The level of IL-10 among the tested groups such as G4, G5, G6, and G9 was significantly increased by 14.4%, 31.7% (p<0.001), 14.3%, and 18.7% (p<0.05), respectively as compared with the G2 group. Moreover, the experimental data suggested that IL-10 level was significantly increased by 15% and 3.7% in the G5 and, G9 groups, respectively as compared with the untreated test formulation (G4) group. Colon IL-10 and its association with gut microbiota were well reported [50]. However, experimental data showed a significant increased the level of IL-10 after Biofield Energy Treatment (the Trivedi Effect®), which suggested the use in gastrointestinal inflammatory diseases.
Figure 7: Effect of Biofield Energy Healing Treated Test formulation on change in colon IL-10 level in TNBS-induced Ulcerative Colitis Animal Model. G1: Normal control; G2: Disease control (50% TNBS in ethanol, (10mg); 400µL through intra-colonic route); G3: Sulphasalazine, 250mg/kg; G4: Untreated test formulation; G5: Biofield Energy Treated test formulation; G6: Biofield treatment per se to animals (-15 days); G7: Biofield Energy Treated test formulation (-15 day); G8: Biofield Energy Treatment per se to animals plus Biofield Energy Treated test formulation (-15 day); and G9: Biofield Energy Treatment per se to animals plus untreated test formulation. All the values are represented as mean ± SEM (n=8). ###p≤0.001 vs. G1 and *p≤0.05 and ***p≤0.001 vs. G2.
Conclusion
On the basis of current study experimental gut health colon cytokines study, it is concluded that the novel test formulation showed a significant action on the tested colon cytokines after administration of the Biofield Energy Treated test formulation and Biofield Energy Treatment per se as compared with the untreated test formulation. Colon CRP level was significantly decreased by 38.5%, 22.3%, 51.2%, 43.9%, and 56.4% in G5, G6, G7, G8, and G9 groups, respectively as compared with the disease control (G2) group. In addition, colon TGF-β level was significantly decreased by 19%, 28.5%, and 19.3%, in G5, G7, and G8 groups, respectively as compared with the G2 group. Similarly, the level of IL-23 was significantly decreased by 71.1% and 62.4% in G7 and G8 groups, respectively with respect to the G2 group. IL-6 was significantly decreased by 45%, 39.3%, and 20.9% in the G7, G8, and G9 groups, respectively as compared with the G2 group. Further, the level of TNF-α was significantly reduced by 30%, 59.1%, and 49.2% by G6, G7, and G9 groups, respectively as compared with the G2. In addition, the level of IFN-γ was significantly decreased by 40.5%, 62.1%, 52.6%, and 28.4% in the G6, G7, G8, and G9 groups, respectively as compared with the G2 group. The level of IL-10 was significantly increased by 31.7% and 18.7% by G5 and G8 groups, respectively as compared with the G2 group. On the basis of experimental results of various tested cytokines and their expression, the test formulation showed a significant gut health activity after treated with the Trivedi Effect®- Biofield Energy Healing. The Biofield Energy Treated test formulation can be used as a Complementary and Alternative Medicine (CAM) to prevent the immune-mediated diseases such as inflammatory bowel diseases (IBD), such as Crohn's disease, ulcerative colitis, hepatic, colitis, gastrointestinal, and neurodegenerative, Stress, Asthma, and many more. Besides, it can also be utilized in autoimmune disorders such as Alopecia Areata, Aplastic Anemia, Addison Disease, Diabetes, Celiac Disease, Dermatomyositis, Graves’ Disease, Hashimoto Thyroiditis, Multiple Sclerosis, Myasthenia Gravis, Pernicious Anemia, Sjogren Syndrome, Fibromyalgia, Vitiligo, Psoriasis, Scleroderma, Chronic Fatigue Syndrome and Vasculitis, Type 1 to improve the overall health and quality of life.
Acknowledgement
The authors are gratefully acknowledged to Trivedi science, Trivedi Global, Inc., and Trivedi master wellness and to Dabur Research Foundation (DRF), India for their support.
References
- Jump RL, Levine AD (2004) Mechanisms of natural tolerance in the intestine: Implications for inflammatory bowel disease. Inflamm Bowel Dis 10(4): 462-478.
- Neuman MG (2007) Immune dysfunction in inflammatory bowel disease. Transl Res 149(4): 173-186.
- Leon F, Smythies LE, Smith PD, Kelsall BL (2006) Involvement of dendritic cells in the pathogenesis of inflammatory bowel disease. Adv Exp Med Biol 579: 117-132.
- Xavier RJ, Podolsky DK (2007) Unravelling the pathogenesis of inflammatory bowel disease. Nature 448(7152): 427-434.
- Papadakis KA, Targan SR (2000) Role of cytokines in the pathogenesis of inflammatory bowel disease. Annu Rev Med 51: 289-298.
- Ince MN, Elliott DE (2007) Immunologic and molecular mechanisms in inflammatory bowel disease. Surg Clin North Am 87(3): 681-696.
- Funk RH, Monsees T, Ozkucur N (2009) Electromagnetic effects-from cell biology to medicine. Prog Histochem Cytochem 43(4): 177-264.
- Bischof M, Del Giudice E (2013) Communication and the emergence of collective behavior in living organisms: A quantum approach. Mol Biol Int 2013: 987549.
- Jain S, Rapgay L, Daubenmier J, Muehsam D, Rapgay L, et al. (2015) Indo-Tibetan philosophical and medical systems: perspectives on the biofield. Global Adv Health Med 4: 16-24.
- Fröhlich H (1968) Long-range coherence and energy storage in biological systems. Int J Quant Chem 2(5): 641-649.
- Peck SD (1998) The efficacy of therapeutic touch for improving functional ability in elders with degenerative arthritis. Nurs Sci Q 11(3): 123-132.
- Turner JG, Clark AJ, Gauthier DK, Williams M (1998) The effect of therapeutic touch on pain and anxiety in burn patients. J Adv Nurs 28(1): 10-20.
- Barnes PM, Bloom B, Nahin RL (2008) Complementary and alternative medicine use among adults and children: United States, 2007. Natl Health Stat Report 12: 1-23.
- Rubik B (2002) The biofield hypothesis: Its biophysical basis and role in medicine. J Altern Complement Med 8(6): 703-717.
- Trivedi MK, Patil S, Shettigar H, Bairwa K, Jana S (2015) Spectroscopic characterization of chloramphenicol and tetracycline: An impact of biofield. Pharm Anal Acta 6(7): 395.
- Trivedi MK, Patil S, Shettigar H, Bairwa K, Jana S (2015) Spectroscopic characterization of biofield treated metronidazole and tinidazole. Med Chem 5(7): 340-344.
- Trivedi MK, Branton A, Trivedi D, Shettigar H, Bairwa K, et al. (2015) Fourier transform infrared and ultraviolet-visible spectroscopic characterization of biofield treated salicylic acid and sparfloxacin. Nat Prod Chem Res 3: 186.
- Trivedi MK, Branton A, Trivedi D, Nayak G, Plikerd WD, et al. (2017) A Systematic study of the biofield energy healing treatment on physicochemical, thermal, structural, and behavioral properties of magnesium gluconate. International Journal of Bioorganic Chemistry 2(3): 135-145.
- Trivedi MK, Branton A, Trivedi D, Nayak G, Plikerd WD, et al. (2017) Chromatographic and spectroscopic characterization of the consciousness energy healing treated Withania somnifera (ashwagandha) root extract. European Journal of Biophysics 5(2): 38-47.
- Trivedi MK, Tallapragada RM, Branton A, Trivedi D, Nayak G, et al. (2015) Characterization of physical and structural properties of aluminum carbide powder: Impact of biofield treatment. J Aeronaut Aerospace Eng 4: 142.
- Trivedi MK, Nayak G, Patil S, Tallapragada RM, Latiyal O, et al. (2015) Impact of biofield treatment on atomic and structural characteristics of barium titanate powder. Ind Eng Manage 4(3): 166.
- Trivedi MK, Patil S, Nayak G, Jana S, Latiyal O (2015) Influence of biofield treatment on physical, structural and spectral properties of boron nitride. J Material Sci Eng 4: 181.
- Trivedi MK, Patil S, Shettigar H, Bairwa K, Jana S (2015) Phenotypic and biotypic characterization of Klebsiella oxytoca: An impact of biofield treatment. J Microb Biochem Technol 7(4): 202-205.
- Trivedi MK, Branton A, Trivedi D, Gangwar M, Jana S (2015) Antimicrobial susceptibility, biochemical characterization and molecular typing of biofield treated Klebsiella pneumoniae. J Health Med Inform 6(5): 206.
- Trivedi MK, Branton A, Trivedi D, Nayak G, Gangwar M, et al. (2015) Antibiogram, biochemical reactions, and genotypic pattern of biofield treated Pseudomonas aeruginosa. J Trop Dis 4(1): 181.
- Trivedi MK, Branton A, Trivedi D, Nayak G, Mondal SC, et al. (2015) Evaluation of antibiogram, genotype and phylogenetic analysis of biofield treated Nocardia otitidis. Biol Syst Open Access 4(2): 143.
- Trivedi MK, Branton A, Trivedi D, Nayak G, Charan S, et al. (2015) Phenotyping and 16S rDNA analysis after biofield treatment on Citrobacter braakii: A urinary pathogen. J Clin Med Genom 3(1): 129.
- Trivedi MK, Patil S, Shettigar H, Mondal SC, Jana S (2015) The potential impact of biofield treatment on human brain tumor cells: A time-lapse video microscopy. J Integr Oncol 4(3): 141.
- Trivedi MK, Patil S, Shettigar H, Gangwar M, Jana S (2015) In vitro evaluation of biofield treatment on cancer biomarkers involved in endometrial and prostate cancer cell lines. J Cancer Sci Ther 7: 253-257.
- Trivedi MK, Branton A, Trivedi D, Nayak G, Gangwar M, et al. (2015) Effect of biofield energy treatment on chlorophyll content, pathological study, and molecular analysis of cashew plant (Anacardium occidentale L.). Journal of Plant Sciences 3(6): 372-382.
- Trivedi MK, Branton A, Trivedi D, Nayak G, Gangwar M, et al. (2016) Molecular analysis of biofield treated eggplant and watermelon crops. Adv Crop Sci Tech 4: 208.
- Trivedi MK, Branton A, Trivedi D, Nayak G, Mondal SC, et al. (2015) Effect of biofield treated energized water on the growth and health status in chicken (Gallus domesticus). Poult Fish Wildl Sci 3: 140.
- Branton A, Jana S (2017) The influence of energy of consciousness healing treatment on low bioavailable resveratrol in male Sprague Dawley International Journal of Clinical and Developmental Anatomy 3(3): 9-15.
- Branton A, Jana S (2017) The use of novel and unique biofield energy healing treatment for the improvement of poorly bioavailable compound, berberine in male Sprague Dawley American Journal of Clinical and Experimental Medicine 5(4): 138-144.
- Branton A, Jana S (2017) Effect of The biofield energy healing treatment on the pharmacokinetics of 25-hydroxyvitamin D3 [25(OH)D3] in rats after a single oral dose of vitamin D3. American Journal of Pharmacology and Phytotherapy 2(1): 11-18.
- Kinney JP, Trivedi MK, Branton A, Trivedi D, Nayak G, et al. (2017) Overall skin health potential of the biofield energy healing based herbomineral formulation using various skin parameters. American Journal of Life Sciences 5(2): 65-74.
- Singh J, Trivedi MK, Branton A, Trivedi D, Nayak G, et al. (2017) Consciousness energy healing treatment based herbomineral formulation: A safe and effective approach for skin health. American Journal of Pharmacology and Phytotherapy 2(1): 1-10.
- Trivedi MK, Branton A, Trivedi D, Nayak G, Plikerd WD, et al. (2017) A systematic study of the biofield energy healing treatment on physicochemical, thermal, structural, and behavioral properties of magnesium gluconate. International Journal of Bioorganic Chemistry 2(3): 135-145.
- Trivedi MK, Branton A, Trivedi D, Nayak G, Plikerd WD, et al. (2017) Chromatographic and spectroscopic characterization of the consciousness energy healing treated Withania somnifera (ashwagandha) root extract. European Journal of Biophysics 5(2): 38-47.
- Anagnos D, Trivedi K, Branton A, Trivedi D, Nayak G, et al. (2018) Influence of biofield treated vitamin D3 on proliferation, differentiation, and maturation of bone-related parameters in MG-63 cell-line. International Journal of Biomedical Engineering and Clinical Science 4(1): 6-14.
- Lee AC, Trivedi K, Branton A, Trivedi D, Nayak G, et al. (2018) The potential benefits of biofield energy treated vitamin D3 on bone mineralization in human bone osteosarcoma cells (MG-63). International Journal of Nutrition and Food Sciences 7(1): 30-38.
- Stutheit ME, Trivedi K, Branton A, Trivedi D, Nayak G, et al. (2018) Biofield energy treated vitamin D3: Therapeutic implication on bone health using osteoblasts cells. American Journal of Life Sciences 6(1): 13-21.
- Hod K, Ringel-Kulka T, Martin CF, Maharshak N, Ringel Y (2016) High-sensitive C-reactive protein as a marker for inflammation in irritable bowel syndrome. J Clin Gastroenterol 50(3): 227-232.
- Bauché D, Marie JC (2017) Transforming growth factor β: A master regulator of the gut microbiota and immune cell interactions. Clin Transl Immunology 6(4): e136.
- Mizoguchi A (2012) Healing of intestinal inflammation by IL-22. Inflamm Bowel Dis 18(9): 1777-1784.
- Monteleone I, Pallone F, Monteleone G (2009) Interleukin-23 and Th17 cells in the control of gut inflammation. Mediators Inflamm 2009: 297645.
- Kuhn KA, Manieri NA, Liu TC, Stappenbeck TS (2014) IL-6 stimulates intestinal epithelial proliferation and repair after injury. PLoS One 9(12): e114195.
- Borruel N, Carol M, Casellas F, Antolín M, Lara F, et al. (2002) Increased mucosal tumour necrosis factor alpha production in Crohn's disease can be downregulated ex vivo by probiotic bacteria. Gut 51(5): 659-664.
- Bao S, Beagley KW, France MP, Shen J, Husband AJ (2000) Interferon-gamma plays a critical role in intestinal immunity against Salmonella typhimurium infection. Immunology 99(3): 464-472.
- LeBlanc AM, del Carmen S, Zurita-Turk M (2011) Importance of IL-10 modulation by probiotic microorganisms in gastrointestinal inflammatory diseases. ISRN Gastroenterol 2011: 11.
© 2021 Mahendra Kumar Trivedi. This is an open access article distributed under the terms of the Creative Commons Attribution License , which permits unrestricted use, distribution, and build upon your work non-commercially.
 a Creative Commons Attribution 4.0 International License. Based on a work at www.crimsonpublishers.com.
Best viewed in


.jpg)


 Editorial Board Registrations
 Submit your Article
 Refer a Friend
 Advertise With Us
.jpg)


.jpg)


.bmp)
.jpg)
.png)
.jpg)


.jpg)


.png)

.png)


.png)


