- Submissions

Full Text
Gerontology & Geriatrics Studies
Nutritional Status and Morbidity Pattern of the Selected Geriatric Population in Dhaka City
Nazia Ahmed1, Md. Nahian Rahman2, Refath Naznin Shimu1 and Khaleda Islam3
1MS in Food and Nutrition, College of Home Economics, University of Dhaka, Bangladesh
2MS in Nutrition and Food Science, Institute of Nutrition and Food Science, University of Dhaka, Bangladesh
3Professor, Institute of Nutrition and Food Science, University of Dhaka, Bangladesh
*Corresponding author: Nazia Ahmed, MS in Food and Nutrition, College of Home Economics, University of Dhaka, Bangladesh, Phone Number: +8801775403874, Email: nahmed643@gmail.com
Submission: July 20, 2020;Published: August 14, 2020
ISSN 2578-0093Volume6 Issue2
Abstract
The study was conducted to observe the nutritional status and morbidity pattern of the selected Geriatric Population in Dhaka City. A number of 150 Geriatric People (77 Female, 73 Male) were interviewed and relevant information was collected through pretested standard questionnaires. Data collected through questionnaire were cleaned, edited and entered into software of the computer and analysis was carried out by using SPSS methods. The Nutritional Status part from Mini Nutritional Assessment showed that, the respondents of 7.3% had the severe decrease in food intake, 46.0% had moderate decrease in food intake and 46.7% had the no decrease in food intake. The respondents of 5.3% had weight loss greater than 3kg (6.6lbs), 6.0% respondents didn’t have the idea about weight loss, 44.0% respondents were having weight loss between 1 and 3kg (2.2 and 6.6lbs) and 44.67% respondents were losing no weight during the last 3 months. The total respondents of 22.67% had MAC less than 21cm, 35.33% had MAC 21 to 22cm and 42.0% have MAC greater than 22cm. The total respondents of 6.7% had BMI (less than 19), 10.7% hade BMI (19 to less than 21), 15.3% had BMI (21 to less than 23) and 67.3% had BMI (23 or greater). The total respondents of 27.33% were at normal nutritional status, 42.0% respondents were at risk of malnutrition status and 30.67% respondents were at malnourished status. The total respondents of 60% were having CC less than 31cm and other 40% respondents were having CC 31cm or greater than 31cm. The total respondents of 18.0% were not considered as good health status in comparison with other people of the same age, 19.3% considered nothing as they don’t know about their health, 49.3% respondents were considered their health as good in comparison with other people of the same age and 13.3% respondents were considered better health in comparison with other people of the same age.
Keywords: Nutritional status; Morbidity pattern; Geriatric population; Dhaka city
Introduction
Geriatric people are known as Aged as well as Elderly person. The term geriatric comes from the Greek ‘geron meaning old man’ and ‘iatros meaning healer’. The human body has many stages in entire life. Elderly definition is considered by both chronological age and accumulation of various deficits over the time [1]. Ageing is a common and natural process for human being. Old age is used to describe the post period of time in human life. United Nation agreed the cut off age of the elder people is 60+ years old. Worldwide, the number of older people is sharply increased. By the year 2025, the world will host 1.2 billion people aged 60 and over and rising to 1.9 billion in 2050. The proportion of the elderly population to total population was 5.8% in 2000 and it expected to reach 8.7% by year 2025 and 15.0% by 2050 [2]. In Bangladesh the life expectancy of the geriatric people is 71.52 years (2017). In 2025, the life expectancy will be increased by 74 years [3,4].
It is important that an evaluation contemplating the different dimensions of health conditions and lifestyle should be conducted to identify the factors that affect nutritional status and, possibly, to develop strategies to promote health and quality of life. Although there are different procedures to evaluate the nutritional status in the elderly, the body mass index (BMI) is commonly used in epidemiological studies [5-7]. It had been reported that at least 1% of the healthy elderly individuals at community level suffer from malnutrition which increased from 20% to 37% among those who required hospitalization or institutionalized care. Low food intake or consumption of compromised dietary variety by the elderly with poor appetite and difficulty in mastication may lead elderly more vulnerable to malnutrition and micronutrient deficiency. Such health disorders are further accentuated by social, psychological and physical factors [5-7].
Methods
- Number of Population- 150 elderly persons (73 Male and 77 Female) were taken for the study.
- Study Area- Selected home, parks from Dhaka City.
- Study Tool- To assess nutritional status by MNA (Mini Nutritional Assessment). The MNA (Mini Nutritional Assessment) is a validated nutrition screening and assessment tool that can identify geriatric people who are malnourished or at risk of malnutrition. The MNA was developed nearly 20 years ago and is the most well validated nutrition screening tool for the elderly.
- Type of Study - The study was a purposive observational and cross-sectional quantitative study.
- Sample was selected by the following criteria:
- Presence of at least one elderly at more than 60 years in the household.
- The household which consists of more than one elderly, only one eligible subject was chosen by randomly.
Data collection method used for this study
A questionnaire was developed to obtain relevant information regarding the general information, socio economic information and individual general health and illness information. The Mini Nutritional Assessment (MNA) is developed by Nestle Nutrition Indicator for measuring the nutritional status measurement. The purpose of the pre-test was to test the content, wording, the typical sequence of questions and duration of the interview and the reliability of some items. At the present the questionnaire which were improved and reformed to ensure content coverage, the reliability and validity of the study.
Data processing and analysis
The nutritional status of elderly was assessed by MNA (Mini Nutritional Assessment). This assessment had showed three malnutrition indicator scores. The scores were used as follows- “24 to 30 points” indicated normal nutritional status, “17 to 23.5 points” indicated at risk of malnutrition and “less than 17 points” showed malnourished. All the statistical analysis and all other data processing were done by SPSS 20.0 windows program. Data were analyzed in terms of frequency distribution, percentage, chi-square test, correlation, co-efficient and descriptive studies. For tabular, charts and graphical representation Microsoft Word and Microsoft Excel were used.
Table 1: Socio-demographic characteristics of the respondents.
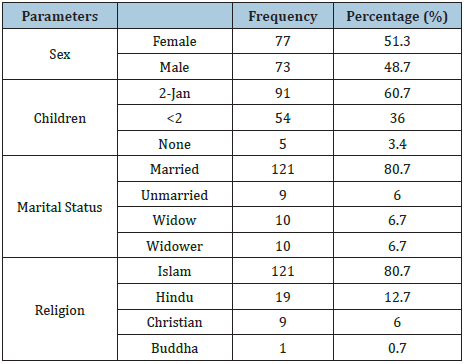
Table 2: Percent distribution of the respondents of calfcircumferences (CC) in cm.

Table 3: Correlations between balanced diet knowledge and malnutrition indicator.
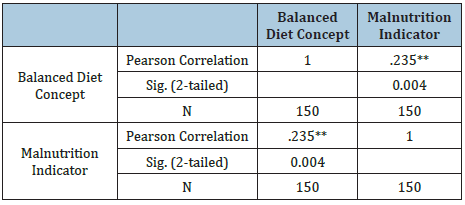
Figure 1: Percent figure distribution of the respondent’s food intake problems (loss of appetite, digestive problems and chewing difficulties)..
Figure 2: Percent figure distribution of the respondent’s weight loss.
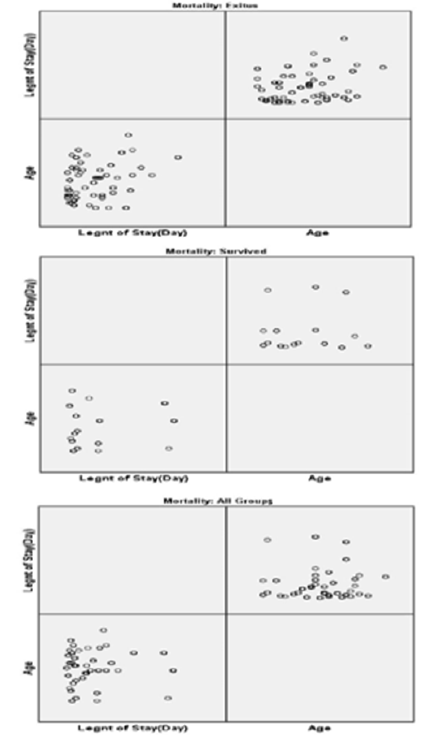
Figure 3: Percent figure distribution of the respondents BMI (Body Mass Index)
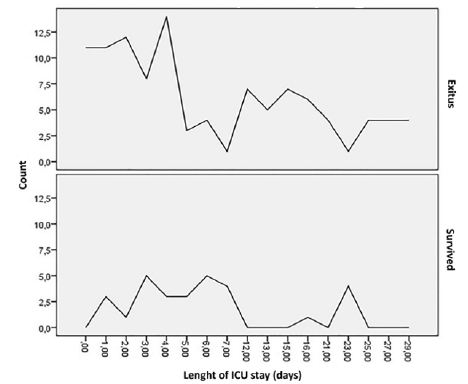
Figure 4: Percent figure distribution of the respondent’s mid-arm circumference (MAC) in cm.

Figure 5: Percent figure distribution of the respondent’s mid-arm circumference (MAC) in cm.

Table 4: Crosstabs between dependent and independent variables.

The Table 1 shows that out of 150 respondents 51.3%, 48.7% are Female and Male. Among the respondents 80.7% are married 6% unmarried 6.7% are widow and 6.7% are widower and they also having from different religions such as 80.7% are Muslims 12.7% are Hindu, 6.0% are Christian and 0.7% are Buddha. The Figure 1 shows that the respondents of 7.3% have the severe decrease in food intake, 46.0% have moderate decrease in food intake and 46.7% have the no decrease in food intake. The Figure 2 shows that the respondents of 5.3% have weight loss greater than 3kg (6.6lbs),6.0% respondents don’t have the idea about weight loss, 44.0% respondents are having weight loss between 1 and 3kg (2.2 and 6.6lbs) and 44.67% respondents are losing no weight during the last 3 months. The Figure 3 shows that the total respondents of 6.7% have BMI (less than 19), 10.7% have BMI (19 to less than 21) , 15.3% have BMI (21 to less than 23) and 67.3% have BMI (23 or greater)The Table 2 shows that the total respondents of 60% are having CC less than 31cm and other 40% respondents are having CC 31cm or greater than 31cm. The Figure 4 shows that the total respondents of 22.67% have MAC less than 21cm, 35.33% have MAC 21 to 22cm and 42.0% have MAC greater than 22cm. The Figure 5 shows that the total respondents of 18.0% are not considered as good health status in comparison with other people of the same age , 19.3% considered nothing as they don’t know about their health , 49.3% respondents are considered their health as good in comparison with other people of the same age and 13.3% respondents are considered better health in comparison with other people of the same age. The Table 3 shows the positive linear correlation (.235) and the respondents are significantly related with Balanced Diet Knowledge and Malnutrition Indicator as Pearson’s Correlation with P-value test show the P value (0.004).The Table 4 shows that the nutritional status measured by MNA of the respondents which is significantly related with Malnutrition Indicator; Mid-Arm Circumferences ; Calf-Circumferences ; Mode of Feeding; Loss of Appetite; Takes more than 3 Drugs; Neuro Psychological Problems; Intake Dairy Products; Intake Meat, Fish, Poultry; Intake Fruits and Vegetables, because the Chi-square test show the (P-value <0.05 ). The Table 5 shows the positive linear correlation (.281) and the respondents are significantly related with Body Mass Index related with (BMI) and Self view of Nutritional status as Pearson’s Correlation with P-value test show the P value (0.001).
Table 5: Correlations between body mass index and self-view of nutritional status.

** Correlation is significant at the 0.01 level (2-tailed).
Discussion
The study subjects, 78.7% were in the age group of 62-70 years similar to a study by Lena et al. [8]. There were 51.3% males and 48.77% females among the study subjects in contrast to a hospitalbased study at Karkala, Karnataka with 60% females and 40% males [7]. According to the NSS, 6.3% of the elderly were illiterate in India, almost similar to this study with 3.3% illiterate. It was 7% in a study conducted in Tamil Nadu by Elango [8,9]. Singh et al reported that 2.8% were illiterate and 87.76% belonged to the Hindu religion which is not similar to this study as it was only 12.7% [9]. In the present study 29.3% participants were benefitted by old age government pension which was almost similar to the scenario in northern India where 10% elderly received this benefit. In another nationwide study conducted in selected states, awareness about Indira Gandhi National Old Age Pension Scheme was 78.5% and Indira Gandhi National Widow Pension Scheme was 71.6% which was better than our observations [10,11]. In a study among the elderly by Sushma Tiwari et al in rural Varanasi, 19.5% was pre obese [8] and among the elderly by this study was 67.3% pre obese. This observation was not so similar to this study. The study showed that the respondents were significantly related with Body Mass Index (BMI) and Self view of Nutritional status as Pearson’s Correlation with P-value test showed the P value (0.001) and also the respondents were significantly related with Balanced Diet Knowledge and Malnutrition Indicator as Pearson’s Correlation with P-value test showed the P value (0.004).
Conclusion
Older age is a normal process of human’s life. Everyone gets older at a particular time. They are senior citizens of a community, society and country. Bangladesh is a developing country. In our country geriatric people are not in good position. As families are becoming nuclear, people started to think these respected older people as the burden of their family. As a result, those old people get shelter in old homes. But it is not the actual picture; many of us love their parents and show responsibility to them. Under nutrition is becoming increasingly prevalent in the ever-growing elderly population. As can be seen, there is a complex web of factors affecting nutritional status in the elderly involving the ageing process itself, illness, drug treatment and socio-economic factors. Deterioration of the nutritional status is associated with food consumption, recent weight loss, disease-associated stress, degree of self-sufficiency. Hence it is necessary to pay special attention to functional capacity when planning nutritional care for this group, especially when they are debilitating by disease.
References
- Barua A, Mangesh R, HarshaKumar HN, Mathew S (2007) A cross-sectional study on quality of life in geriatric population. Indian J Comm Med 32(2): 146-147.
- (1998) Morbidity and treatment of ailments. NSS 52nd round, July 1995-June 1996, Report No.441. Ministry of Statistics and Program Implementation, New Delhi, India.
- Ibrahim NK, Ghabrah TM, Qadi M (2005) Morbidity profile of elderly attended/admitted in Jeddah health facilities, Saudi Arabia. Bull High Inst Public Health 35 173-190.
- Carnes, Bruce (2013) Re: Who is elderly?
- Herne S (1995) Research on food choice and nutritional status in elderly people: a review. British Food Journal 97(9).
- Donini LM, Savina C, Cannella C (2003) Eating habits and appetite control in the elderly: the anorexia of aging. International Psychogeriatrics 15(1): 73-87.
- Wham CA, Teh ROY, Robinson M, Kerse NM (2011) What is associated with nutrition risk in very old age? The Journal of Nutrition, Health & Aging 15(4): 247-251.
- Lena A, Ashok K, Padma M, Kamath V, Kamath A (2009) Health and social problems of the elderly: A cross-sectional study in Udupi Taluk, Karnataka. Indian Journal of Community Medicine 34(2): 131-134.
- Amarya S, Singh K, Sabharwal M (2015) Changes during aging and their association with malnutrition. Journal of Clinical Gerontology and Geriatrics 6(3): 78-84.
- Barua A, Mangesh R, Kumar HH, Mathew S (2007) A cross-sectional study on quality of life in geriatric population. Indian Journal of Community Medicine 32(2): 146.
- Yadav S, Arokiasamy P (2014) Understanding epidemiological transition in India. Global Health Action 7(1): 23248.
© 2020 Nazia Ahmed. This is an open access article distributed under the terms of the Creative Commons Attribution License , which permits unrestricted use, distribution, and build upon your work non-commercially.
 a Creative Commons Attribution 4.0 International License. Based on a work at www.crimsonpublishers.com.
Best viewed in


.jpg)


 Editorial Board Registrations
 Submit your Article
 Refer a Friend
 Advertise With Us
.jpg)


.jpg)


.bmp)
.jpg)
.png)
.jpg)


.jpg)


.png)

.png)


.png)


