- Submissions

Full Text
Gerontology & Geriatrics Studies
Analysis and Forecast Based on the Kinetic Equation for Changing the Numerical Composition of Living Systems
Alexander Alexandrovich Viktorov1* and Viacheslav Alexandrovich Kholodnov2
1State Research Center Burnasyan Federal Medical Biophysical Center of Federal Medical Biological Agency, Russia
2Kotelnikov Institute of Radio Engineering and Electronics of Russian Academy of Sciences, Russia
*Corresponding author: Alexander Alexandrovich Viktorov, State Research Center Burnasyan Federal Medical Biophysical Center of Federal Medical Biological Agency, Russia
Submission: February 21, 2020;Published: March 16, 2020

ISSN 2578-0093Volume5 Issue5
Abstract
The possibility of applying the kinetic theory of aging of biological species published earlier by the authors of this work to assess and predict changes in the number of specific populations is evaluated. The populations of the USA, China and Russia, as well as the population of mice observed in the experiment “Mouse paradise” of the American scientist John Calhoun are considered. To this end, a historically consistent analysis of the main previously proposed multi-scenario mathematical models describing demographic data and predicting the dynamics of the population was performed. The results of these models show a decrease in the population growth rate, a tendency toward a limit with an increase in historical time, the achievement of such a limit in some developed countries with a relatively high level of social security, a subsequent decrease in the number and further uncertainty of the final population outlook in the distant future. In addition, these models made it possible to establish that the observed population growth in developed countries is unambiguously accompanied by its aging-a relative predominant increase in the number of elderly people compared to the number of the younger generation (people are aging, the population of countries is aging).
In this work, the assumption was made and confirmed that the dynamics of the aging of the population of the countries of the World corresponds to the dynamics of aging of a person of one generation and is mathematically described by the differential equation of the kinetic theory of aging of living systems of the same type with close values of the parameters. The biophysical meaning of the parameters of the kinetic equation reflects Selye’s G [1] concept of the determining role of stress in human life and populations. An analysis of the changes in the numbers of the considered populations of humans and mice at various stages of their development is qualitatively commented on from the standpoint of comparative tension according to Selye G [1]. To assess the degree of aging of a biological object of one population in kinetic theory, the probability of death during life is selected as an indicator of aging. In this work, the probability of reaching the maximum population size was chosen as an indicator of the aging of a biological object of various populations. The published literature predicts various options for changing the population after reaching a maximum maintaining the reached maximum level and decreasing to a certain limit, less than the maximum achieved. In this paper, based on an analysis of its results and an analogy with the complete degeneration of mice in the “Mouse Paradise” experiment, a conclusion is drawn about a hypothetically possible third variant of the limiting decrease in the population-its complete degeneration.
Keywords: Model; Kinetic theory; Dynamics; Population; Tension; Living system
Introduction
The mathematical description and forecasting of population dynamics of the countries of the World is considered in numerous scientific publications. Malthus model of exponential population growth was the result of the assertion that population increases in geometric progression [2]. Verhulst examined population dynamics under the initial assumptions that the rate of population reproduction is proportional to its current base and available resource pool [3]. The author called the solution of the corresponding differential equation as logistic curve. In accordance with empirical “Law” of Forester, the hyperbolic growth of Earth’s population observed over several millennia is described by function with a singularity point - a point in time when the function goes to infinity [4]. Moreover, according to calculations of Horner, it corresponds to year 2025, and according to Forester - November 13, 2026 [5]. However, in period 60-90 years of the 20th century, population growth began to decelerate (demographic transition period), hyperbolic growth stopped, and hypothesis appeared about the limit of population growth of humanity. To describe new demographic trends, Kremer introduced in his model of hyperbolic growth additional function of per capita product, that equilibrium value determines equilibrium population size, according to his concept of technological development [6].
Kapitsa [7] put forth markedly different concept stated that the change in population over millennia is determined by biological factor, namely by dominant feature of human psychology and information interaction of members of society, and that change is not related to other factors of environment (the principle of demographic imperative) [7,8]. Kapitsa [8] modified Forester model, excluding the singularity point, and obtained the equation for dependence of population on reduced time τ in the form of the inverse trigonometric function arcctg(τ). The reduced time τ includes time t1=2000 years corresponding to the middle of demographic transition period. Asymptotic stabilization of the population of the Earth corresponds to 12 billion people, while 90% of maximum population, equals to about 11 billion, is expected by 2150.
One of the modern approaches to evaluating trends in demography is solving partial differential equation concerned demographic balance of birth and death rates [9,10]. The most popular databases on demographic prospects of 226 countries and regions of the World are the United States Sensus Bureau (International Database) and the United Nations Population Department (UNPD). UNPD database contains statistics and provides projections of global population changes for the period up to year 2150-the Global Review and Inventory of Population Policies (GRIPP), and, coordinates the Population Information Network (POPIN) [11-16]. Forecast calculations methods are based on mortality table. Four groups of forecasting methods are used: extrapolation methods, economic and mathematical methods, classification by year of birth and cohort component method, and methods of expert estimates. Unlike extrapolation and analytical methods, cohort component method (classification by year of birth) based on use of demographic balance equation allows to get not only the total population, but also its distribution by sex and age.
In practice, several variants of demographic forecasts are always developed. So, e.g., there are three options of forecast by Russian Statistics Agency (ROSSTAT), and by UNPD-eight. Since the future is not exactly known today, the forecast is multi-scenario and is determined, first, by used ideology of forecast model. In recent decades, reducing the birth rate, which overlaps the simultaneous reducing mortality, has become the prevailing trend in economically developed countries leading to decrease in the growth rate of the population and to change its age composition towards aging the population. Aging process is characterized by increase in the relative share of the elderly population. Part of population aged 60 and over has increased from 8% in year 1950 to 12.3% in year 2015. by year 2030, it will be 16.5%, by year 2050, it will reach 21.5% of the total World’s population [15,16].
The accuracy of population estimates in the census is 5%, and in the long-term forecast, tens and hundreds of % [12,17]. For example, according to the forecasts of demographers from the Expert Council under Russian Government, based on the report of the Higher School of Economics (HSE) “Population of Russia” of 2012, the population of Russia was estimated on 6 scenarios, and by optimistic scenario, in year 2060, population of Russia may be close to 150 million people, and pessimistic-near 70 million people. According to the UN forecast, presented by 9 variants, the population of Russia at the same time was estimated from about 152 million to 110 million [15-17]. At present, population of Russia is about 146.8 million.
Calculation results on 4 options made by experts of HSE Institute for Demography published in Bulletin “Population and Society” No. 371-372 (2009) show wide interval in predicted size of the World population in 2060 ranging from about 27 billion people down to 6 billion people. Currently, total population is approximately equal to 7.7 billion people. Thus, in highly advanced countries, aging of population and even depopulation has been recorded. However, key challenge remains not clear-what will be the end of this process? Bright hypothetical illustration of negative forecast concerned possible future of mankind may be the results of experiments with mice conducted repeatedly by American scientist John Calhoun in conditions when mice were provided with full availability of space, food, water, favorable physical environmental factors and high hygiene in their crate [18]. The result of same-type experiments was population extinction after a rapid increase in size, hundreds of times higher than the initial cohort (several initial heterosexual couples), due to the gradual stratification of mice society into separate non-interacting and aggressive caste clans, cannibalism, the termination of mating of the opposite sexes, homosexuality, desire for self-sufficiency. Anyway, mathematical forecast requires not only, and rather, not so much a formal adequacy of the model to previous experimental data but of author’s hypothesis about the future, which predicting mathematical result on the base of clear physical idea. The goal of research is to evaluate the possibility of applying mathematical model of aging of various biological species to describe changes in the population of different countries of the World [19].
Research Method
Kinetic theory of aging of living systems (LS) considers the human life cycle as time interval during which a biological aging process occurs [20,21]. Aging is characterized numerically by change in the probability of human’s death from D=0 (birth) to D=1 (the probability of an unavoidable physiological fact of death). Kinetic theory of aging of various biological species is described by mathematical model based on equation (in dimensionless units) [19,22]:

where D is Cumulative Function of Mortality (CFM) of the living system; τ=C·t is dimensionless time (0≤τ≤1); t is calendar time; C is constant with dimension inverse to calendar time; μ is dimensionless parameter illustrating the “tension” of the system; k is constant that accounting for adaptation of the system; θ is parameter that taking into account the change in the aging rate with increasing in age of the system. The probability of human death (Dτ), as indicator of the degree of human aging to age τ, is determined statistically by the ratio of the number of people dying in a certain time interval τ to the total number of people of a given generation (generation size). Dimensionless time τ is the ratio of the calendar age t to the life expectancy tmb, i.e., τ=t / tmb. Term “tension” means tension, stress, pressure, load. The term stress was introduced into biology by Canadian physiologist G. Selye [1] in 1936, which later described it as a “General adaptation syndrome”, i.e., “A general nonspecific neurohormonal reaction of organism to any requirement claimed to it.”
The biological role of stress is determined by the strength and duration of stressors, which include all sorts of stimuli, as directly acting on the human body (physical, chemical, mechanical, biological, emotions, pain, hunger, etc.), as well not direct actions on it but potentially dangerous (e.g., seeing of object that poses a threat to humans). There are also irritants that have unexpected character, suddenly acting on the body, including communicative stressors associated with the activity of 2nd signal system (word power). The indicator of tension S=μ/(1-θ·D), as the level of the general adaptive syndrome of the body under influence of stressors, increases with increasing in body age D(τ). Kinetic equation (1) allows obtaining various integral and differential probabilistic indicators of LS aging in dimensionless units: CFM of LS D (τ ) = ∫ (∂D/∂τ )dτ -probability of system death over a period not exceeding τ; ∂D/∂τ - probability density of death; mortality rate (∂D/∂τ)/(1-D); life duration expectancy:

Equation (1) contains 3 parameters, and each, in its own
time interval, affects to the greatest extent on character of time
dependence D(τ). These parameters are found as a result of analysis
and processing of the experimental statistical dependences D(τ) in
accordance with kinetic Equation (1). Equation is solved numerically
to select suitable dimensionless model parameters by comparing
with available experimental data. Based on the mathematical
analysis of this equation, it follows that the average rate of change
of D with time τ in the interval 0.07≤D≤0.7 is determined mainly
by parameter μ. Initial interval 0
Then, the value of parameter k is estimated based on
approximation of the experimental data by solving equation (1) D(τ)
in interval 0
Then, the value of parameter k is estimated based on approximation of the experimental data by solving equation (1) D(τ) in interval 0<D˂0.07. Finally, parameter θ is estimated similarly in interval 1>D>0.7. After such multiple iterations of approximating the experimental data D(τ) by numerical solutions of Equation (1) with adjustable parameters, the final choice of parameters is completed by refinement using the least squares method to match the calculations of the experimental dependence D(τ) within an error not exceeding 5% [22,23]. The parameters found in this way are uniquely determined to the extent defined by the convergence of solutions of kinetic equation to experimental results within measurement accuracy.
A human is getting old. Population of the countries of the World is also aging. Obviously, indicators of aging, as also process of increase in age of LS, can be different. To estimate the degree of human aging in kinetic theory, the probability of death is chosen as such indicator. Population growth in highly industrial countries is unambiguously accompanied by its aging-a relative predominant growth in the number of elderly people. Therefore, we choose the ratio of current population size to the maximum possible as indicator of aging population of the countries of the World. The limit of this relationship with increase in calendar time is 1. According to scenarios of World forecasts, the maximum possible humanity size can be reached before year 2060, and maybe not. We introduce the dimensionless coordinates.
Dimensionless time is defined as the ratio of calendar time from the beginning of the process to time interval corresponding to aging index reaching value of 1. Time at which selected aging index is much less than 1 is taken as the beginning of process. Let’s take the previous notations D and τ for these coordinates. These parameters will vary from 0 to 1 accounting for that D (0) is much less than 1. Aging index D(τ) will display the probability of reaching population its maximum value. Under these assumptions, the task of modeling the dynamics of population size is reduced to previous mathematical model of kinetic theory of LS aging-Equation (1), but with different interpretation of the calculation results. In this case, the previous interpretation of model parameters (1) is retained. Current population N(τ) will be calculated as the product of D(τ) by expected maximum number Nm: N(τ)=D(τ)·Nm. If, after reaching the maximum, population begins to decrease, this means the transition of aging process to a new phase-the excess of mortality over fertility. For the mathematical description of this phase, function D will be considered as the probability of death of the population, varying from 0 to 1, with 1 corresponding to probability of reaching the maximum number of dead. The maximum number of dead can range from the initial maximum number of 1st stage of aging (e.g., similar to the case of complete degeneration of mice paradise), to level lower than this value (e.g., as in the case of long-time demographic forecast of population size of China). Obviously, to describe the aging process at 2nd stage, the use of the same kinetic Equation (1) is also valid. Then the total population size at these two stages Nm(τ) is determined by difference between population size of 1st stage Nm1×D1(τ) and number of deaths of 2nd stage Nm2×D2(τ), i.e., . In general, this process can represent a continuous oscillation of growth and decrease waves with possible difference in amplitudes and duration. Each wave can be described by the same kinetic equation. Let’s verify the feasibility of this model by comparing calculations with demographic data.
Result and Discussion
In accordance with study objects, the term Living System (LS) is understood as population-totality of people of different generations living simultaneously on Earth or within a specific territory-continent, country, region, etc., as well as the group of animals discussed below. Table 1 presents parameters of general kinetic model for all studied LS, formulas and calculation results of population dynamics in the USA (Figure 1), China (Figure 2), Russia (Figure 3) and the demographic experiment “Mice paradise” (Figure 4) The calculation results describe the dynamics of the number of individuals in interval of calendar times from 150 years (USA, China) to 218 years (the Russian Empire, the RSFSR, the USSR, the Russian Federation) and 1700 days for the “Mice paradise”. The population N(t) is calculated according to formulas shown in 7th column of Table 1, in which Di(t) functions and Nmi parameters contribute. Intervals common for determining Di(t) functions by time t are also indicated.
All parameters of the approximating functions (columns 2-5 of) are found by the method indicated above for selecting scenarios that are closest to demographic data. Time intervals for parameters determination is indicated in column 6. The number of time segments of approximation for different countries is determined by the number of function jumps and/or by changing the sign of the first derivative, i.e., the presence of falling part of the function. The population of Russia itself, which by various names was consistently taken up different geographical territories, has suffered three jumps - in years 1914, 1941 and 1991, therefore, it is described by 4 segments of piecewise continuous functions. The population of China and mice paradise are approximated by two functions, due to the decrease in population after passing the maximum.
Data in Table 1 show that taken approach allows to describe in detail stages and features of LS size dynamics. Specifically, this refers to population growth in the USA (Figure 1), growth and possible decrease in population in China (Figure 2), the loss of part of population of the Russian Empire and the USSR due to two World wars and the collapse of the USSR (Figure 3), biological degradation of “Mice paradise” up to complete extinction of its members (Figure 4). Discrepancy in results of calculations and experiment does not exceed 5% when varying model parameters for population as follows μ=(1.520-1.539), θ=(0.584 - 0.675), k=4.472 and 4.468 and for “Mice paradise” μ=1.555 and 1.565, θ=0.550 and 0.510, k=4.468. Modeling fit can be improved by more careful selection of model parameters, but this task was not considered in this paper. Figure 5 shows comparison of stress index S=μ/(1-θD) of different LS depending on D value, having in mind that stress in LS increases with increasing in age. Parameters values μ and θ of various LSs used for producing graphs in Figure 5 are given in Table 2. Comparing population size changes trends show that the lowest tension (stress) is observed among the Chinese population, then with small maximum difference (5.5% at D=1)-among the US population.
Table 1: Parameters values for modeling population change rates using Equation (1): for the countries of the World and “mice paradise”. Formulas for calculating sizes of biological species N(t) as function of time.

Table 2: Parameters values μ and θ of various LSs used for producing graphs in Figure 5.

Figure 1: Dependence of the USA population size N on time t. Points-demographic data from [12,13], solid and dash lines-calculation results obtained in frame of current work.
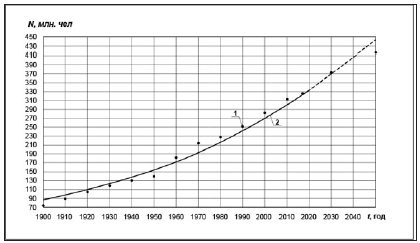
Figure 2: Dependence of China population size N on time t. Points-demographic data from [24,25], solid and dash lines-calculation results obtained in frame of current work.
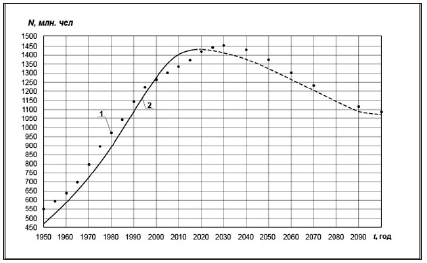
Figure 3: Dependence of population size N on time t of Russian Empire (years 1800-1914), RSFSR (years 1918-1922), USSR (years 1922-1991) and Russia (1991-2018). Symbols ∎ (segment 3)-demographic data from [6, 11, 26], solid line (segment 2)-calculation results obtained in frame of current work with account of population loss due to 1st and 2nd World wars and collapse of the USSR in year 1991. Symbols •-demographic data for Russia including being a part of Russian Empire, RSFSR and USSR.
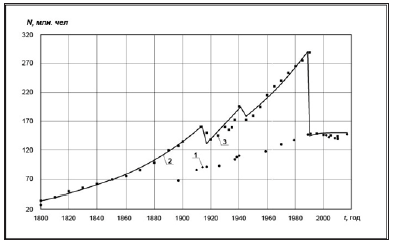
Figure 4: Dependence of “Mice Paradise” population size N on time t. Points (1)-experimental data from [17], solid line (2)-calculation results obtained in frame of current work.
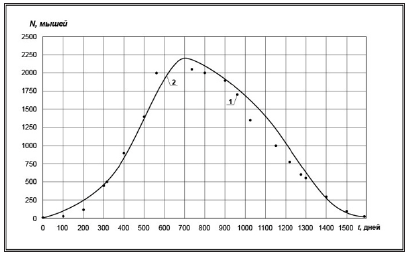
Figure 5: Dependence of stress index S=μ/(1- θD) of different LS on probability D of achieving maximal population size. Life systems names and parameters values μ and θ are given in Table 2.
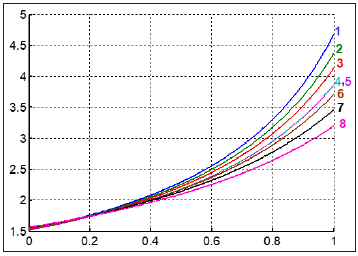
The greatest tension is observed among Russian population in the interval from year 1800 to 1941, with maximum increase compared with China by 28% at D=1. Tension among population of the USSR in period from year 1945 to 1991. significantly decreases and practically corresponds to the tension of the US population. After the collapse of the USSR in year 1991. and till year 2018. the tension among population of Russia again increases significantly, approaching stress of period 1800-1941 years, exceeding China by about 20% at D=1. In Russian version, a decrease in the population in 1914-1918, 1941-1945 years and in year 1991 considered as function jumps in where function itself is not defined. Thus, the tension among population in the Russian Empire, the RSFSR, the USSR and the Russia is different at different stages of life.
It is also interesting to compare (Figure 5) the differences in tension (stress) of co-existence of people and animals with increase in their numbers and aging [19,24]. So, for values of parameters averaged over biological species (except for Drosophila) μ=1.520 [1.517(rats)≤μ≤1.523(dogs)], θ=0.632 [0.580(horses)≤θ≤0.665 (rats)] and k=4.485 [4.440(horses)≤k≤4.513(dogs)], average tension with aging of representatives of biological species is in interval between tension of China population with increase in its size and Russian population in period from year 1800 to 1941, exceeding the tension among China population by about 13% at D=1. At the same time, the confidence interval of the aging tension region of these animals is completely covered interval of changes in the tension among populations of China, USA and Russia with increase in their size.
Even more interesting are the results of comparing the tension among mice paradise population (Figure 5): the stress among mice with increase in number and degeneration of the population residing in comfortable living conditions specially created is less than stress among population even in China, and stress of mice during extinction is slightly less than stress with the growth of population. The parameters of mathematical models describing growth of mice population and its death are close, differing by 0.6% for μ and 7.8% for θ, values of parameter k coincide. For China, kinetic parameters of ascending and descending branches of the population coincide. At the same time, for mice from mice paradise, whose, from the point of view of the experimenter, are in extremely favorable conditions of existence, the tension among individuals is the smallest among all other cases considered. Here we do not consider the detailed reasons for proximity and difference in tension of LSs when they are in different conditions, since this task is too complicated from the point of view of classification of stresses and stressors according to G. Selye’s theory and requires a special study. However, based on performed analysis, there is reason to believe that humans, humanity and other biological species are developing and aging at the same time: under the influence of always existing tension (stress) and according to one regularity corresponding to the mathematical model presented in article. Note that sensitivity of LS to stressor intensity is different. For example, chronic X-ray radiation exposition of dogs within range of dose rate changes from 0 to 54cGr /day results in change in parameter μ from 1.523 to 4.200, while the life expectancy of dogs decreases under effect of radiation from 192 months to 1 month [24-27]. For human, there is no such data. We consider that physical interpretation of essence of our mathematical model corresponds to the concept of G Selye [1].
Conclusion
A. The kinetic theory of aging of living systems can be used to describe the population dynamics of the countries of the World.
B. There is reason to believe that human, population of the countries of the World, humanity and other biological species are developing and aging at the same time: under the influence of always existing tension (stress) and according to the same regularity corresponding to the mathematical model presented above.
References
- Selye G (1982) Stress without distress. Progress Publisher, Russia.
- Anikin AV, Malthus, Malthusianism (1975) Youth of science: Life and ideas of thinkers-economists before Marx. In: Anikin, Malthus, Malthusianism (Eds.), Politizdat (2nd edn), Russia, pp. 266-274.
- Verhulst PF (1845) Recherches mathématiques sur La Loi D’Accroissement de la population. Nouveaux Mémoires de l’Académie Royale des Sciences et Belles-Lettres de Bruxelles 8: 1-45.
- Von Foerester H, Mora P, Amiot L (1960) Doomsday: Friday, 13 November, A. D. 2026 At this date human population will approach infinity if it grows as it has grown in the last two millennia. Science 132 (3436): 1291-1295.
- Hoerner S (1975) Population explosion and interstellar expansion. Journal of the British Interplanetary Society 28: 691-712.
- Кrеmеr M (1993) Population growth and technological change: One million B. C. to 1990. The Quarterly Journal of Economics (108): 681-716.
- Kapitsa S (2000) Model of Earth's population growth and economic progress of mankind. Economic issues, Russia, Vol. 12.
- Kapitsa S (1999) How many people lived, lives and will live on the Earth. Nauka, Russia.
- Orlov YN (2015) Methods of mathematical demography: state-of-the-art, problems, exact results. M V Keldysh Institute of Applied Mathematics RAS, MIPT, sector of kinetic equations, department of higher mathematics, KIT, Russia.
- Staroverov OV (1997) The basics of mathematical demography. Nauka, Russia.
- UN Population Division (2009) World Population Prospects 2019.
- (1928) Statistical reference book of the USSR for year 1928. Russia.
- The World Factbook. USA. People and Society.
- USA quick facts from the us census bureau.
- (2015) United nations. Department of Economic and Social Affairs, Population Division.
- (2015) World population prospects: The 2015 revision, DVD Edition.
- Scherbakova EM (2015) Aging world population. Demoscope Weekly, Russia, pp. 667-668.
- John Calhoun (1973) Death squared: The explosive growth and demise of a mouse population. Proc Roy Soc Mev 66(2): 80-88.
- Viktorov AA, Kholodnov VA, Anofriev AV (2019) Kinetic model of aging biological species in natural habitat. Advances in Gerontology 9(3): 177-183.
- Viktorov AA, Kholodnov VA (2013) Kinetic theory for aging of living systems. Advances in Gerontology 3(4): 261-267.
- Viktorov AA, Kholodnov VA, Gladkikh VD, Alekhnovich VD (2013) Influence of environment on aging of living systems: A mathematical model. Advances in Gerontology 3(4): 255-260.
- Viktorov AA, Gladkikh VD, Ksenofontov AI, Morozova EE (2015) Forecasting environmental health risks based on the kinetic theory of aging of living systems. Advances in Gerontology 5(3): 141-146.
- Viktorov AA, Ksenofontov AI, Morozova EE (2014) Environmental risks to public health. National Research Nuclear University MEPhI Publishing, Russia.
- China in figures. Population. Total fertility rate. Russia.
- Nefedov SA (1999) On the demographic figures in the history of China (XI-XIX Centuries). Russia.
- (2007) Contemporary demographic policy: Russia and foreign experience. Analytical Bulletin of the Federation Council of the Federal Assembly of the Russian Federation, Russia, Vol. 25.
- Viktorov AA, Gladkikh VD, Morozova EE (2017) Aging of dogs and drosophila as described based on the kinetic theory. Advances in Gerontology 7(3): 177-183.
© 2020 Alexander Alexandrovich Viktorov. This is an open access article distributed under the terms of the Creative Commons Attribution License , which permits unrestricted use, distribution, and build upon your work non-commercially.
 a Creative Commons Attribution 4.0 International License. Based on a work at www.crimsonpublishers.com.
Best viewed in


.jpg)


 Editorial Board Registrations
 Submit your Article
 Refer a Friend
 Advertise With Us
.jpg)


.jpg)


.bmp)
.jpg)
.png)
.jpg)


.jpg)


.png)

.png)


.png)


