- Submissions

Full Text
Gerontology & Geriatrics Studies
Goniometry Apps: Do They Measure Up? Exploring the Accuracy of Mobile Device Apps
Caitlyn Buck, Brandon Martindale and Heather J Braden*
Department of Physical Therapy, USA
*Corresponding author: Heather J Braden, Department of Physical Therapy, USA
Submission: October 09, 2019;Published: October 29, 2019
ISSN 2578-0093Volume5 Issue2
Abstract
Purpose: Health care professionals use smartphones in the clinic with mobile device applications (apps) to measure data such as joint ROM. The purpose of this study was to examine goniometer apps and to compare their measurements to an electronic goniometer gold standard to identify the most precise apps.
Method: 7 different apps were identified for Apple and Android devices. Each of these apps provided measurements concurrently with an electronic goniometer reference at 6 different predetermined angles. Descriptive statistics, including mean, standard deviation (SD) from the gold standard electronic goniometer, standard error of mean (SEM), mean absolute difference (MAD), and 95% confidence intervals were calculated. An intraclass correlation coefficient (ICC) was calculated to observe for reliability. Bland- Altman plots were configured to show directional preference of two measurement techniques. A Pearson correlation coefficient (r) was used to determine validity to describe the strength and direction of the relationship for Goniometer Pro (Apple) or 360 Protractor (Android) and the gold standard. Results: The most accurate Apple app was Goniometer Pro and Android app was 360 Protractor. The ICCs for reliability for both the Apple app and the Android app were 0.99 (95% CI 0.98, 1.00). The Pearson correlation coefficient for validity was significant at r=1.00 (95% CI 0.99,1.00) Conclusion: Both Goniometer Pro on the Apple device and 360 Protractor on the Android device were the most accurate with high reliability and validity.
Introduction
In recent decades, technology has become an increasingly indispensable part of healthcare services. The development and dramatic improvement of smartphones has given health care professionals constant and portable access to a great wealth of technology at the tip of their fingers. Surveys of physicians show 81 percent report utilizing a mobile device at work [1]. Applications (apps) for smartphones are now available for almost everything imaginable; from reference materials and lab values to communication tools and measurement functions. These applications can and should be used to improve patient care and enhance provider efficiency in a variety of health care settings. Physical therapists regularly have a need for accurately assessing range of motion of a given joint. Range of motion measurements are used to assess functionality as well as document objective changes in patient limitations. Universal goniometers are one of the most widely used measuring tools and can be found in almost any physical therapy clinic. However, physical therapists work in a wide variety of settings where clinical implements are not always readily available. Therapists practicing in settings such as home health and acute care will only have access to tools and resources, they are able to carry with them. Having the ability to use smartphone applications for functions such as goniometric measurements can make practicing in less conventional settings more convenient. Additionally, goniometer apps can offer a free or cheap alternative to traditional measurement tools [2].
While there are many practical applications for smartphone use by healthcare providers, the variable quality and lack of regulation also means there are possible risks. While studies show a large percentage of healthcare workers utilizing this technology, only 23 percent report doing any sort of risk assessment before using an application at work [1]. Goniometer apps need to be validated as reliable clinical tools before being integrated into regular physical therapy practice. Many different goniometer apps are currently available, however, only 5 apps from a 2014 systematic review are still on the market [3]. With this technology constantly changing and updating, it is important to continue to research the validity and reliability of these applications and their use in clinical settings. Several previous studies of goniometer apps involved assessing only one or two app’s reliability as well as measuring only a particular joint motion or body segment [2,4]. Earlier studies that involved mobile devices for joint measurements had a lack of goniometer apps available and instead used only level apps to quantify joint range of motion [3,5]. Recent research has begun exploring measurements for a pathology of a specific joint [6,7]. Additionally, several other studies have explored interrater reliability when using goniometer applications rather than the application’s reliability of measurement compared to standard tools [8,9].
This study examines numerous goniometer applications across both Apple and Android mobile devices. Measurements from these apps were compared to measurements from an electronic goniometer as a gold standard to assess their reliability. Electronic goniometers allow for accurate measurements within one-tenth of a degree and have been found to be statistically equivalent to universal goniometers, which are the most common tool utilized by clinicians [9,10]. Additionally, the digitally displayed measurements from the electronic goniometer reduce reading error from the examiner. The results of the goniometer app measurements compared to the electronic goniometer were analyzed for consistency and precision in order to determine how well the apps perform. The aim of this study was to determine the reliability and validity of multiple goniometer apps on both Apple and Android devices compared to electronic goniometer measurements and identify the best performing apps to justify use of these apps in clinical settings in place of traditional measurement tools. In addition, this study assessed if there were any significant differences in performance between devices for applications available on both operating platforms to determine if the type of mobile device used affects the performance of the goniometer apps.
Methods
In this study, two different mobile devices were utilized to test the different apps and data collection. Both devices that were selected provide access to the two commonly used services for app downloads, which were iTunes store and Google Play store. There were three exclusion criteria for this study. First, the study aimed to use low cost or free applications, therefore any app over 15 dollars was excluded from this study. The second criteria excluded all apps whose primary function was through the camera system rather than use of the device’s accelerometer to measure angles. The last exclusion criteria were that any app without an English language setting for rater understanding was not utilized. Inclusion criteria allowed for leveler and protractor apps if capable to read angles from 0 to 180 degrees while meeting the other criteria. These apps were also considered due to other research articles utilizing these apps rather than goniometer apps due to availability at that time. Each app was individually tested and compared to the electronic goniometer.
Research Design
This is a non-experimental descriptive study that examines the 2 mobile devices against an electronic goniometer, measuring at 6 different angles across 7 different apps.
Raters
Two Doctor of Physical Therapy students from Angelo State University were the raters for this study. Rater training and repeated experiences with electronic goniometer use were completed prior to data collection with faculty guidance and following company guidelines. Further training was completed when the raters practiced with placement of the tools for consistency of measurements. Rater one took all the app measurements. The second rater managed all angles on the electronic goniometer concurrently.
Instruments
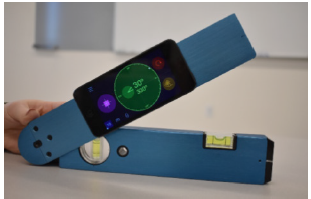
The electronic goniometer utilized was from the Baseline Evaluation Instruments production line See in Figure 1. The electronic goniometer can read 0 to 185 degrees to the tenth decimal with a digital screen. Prior to the study, the Baseline electronic goniometer integrity was assessed by comparing it to a 90 degrees carpenter’s arm. The electronic goniometer was measured three times with an average reading of 90 degrees, ±.1. The mobile devices that the apps were downloaded through were an Apple iPod Touch (Model A1574) and a Motorola Moto G4 mobile phone See in Figure 2. The integrity of the devices was checked preceding the study and data collection (Figure 3).
Figure 1:Baseline Electronic Goniometer.

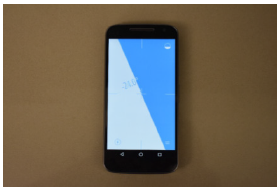
Figure 2:Left-Motorola Moto G4 Android mobile phone; Right - Apple iPod Touch (Model A1574).
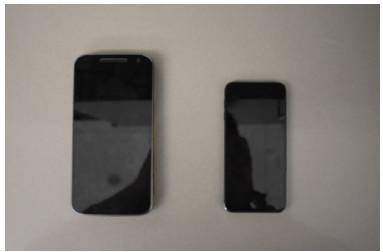
Figure 3:Procedural setup of the electronic goniometer and the mobile apps.
Procedure
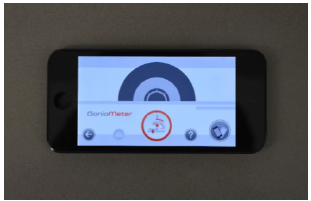
Following the inclusion and exclusion criteria, 7 different apps were selected, 2 of which were available on both mobile platforms. Five of the apps were on iTunes while the other four were available through Google Play. Data collection followed a procedure that was like a study by Wellmon et al. [11]. This research had pre-selected angles the app would measure. This study also had predetermined angles but measured every 30 degrees from 0 to 180 degrees between the distal (or mobile) and proximal (or stable) arm (Figure 4). Thus, a total of 6 different angles were measured for each app. This was intended to show if there were any potential changes in the apps’ accuracy throughout the range (Figure 5). Each mobile device was placed on the backside, one at a time, on the distal arm of the goniometer in order to register the movement and complete the data collection of the different angles. These mobile devices were fastened securely in the middle of the surface using double sided tape. Each app was opened individually while the electronic goniometer was set at its zero reading. Each app was zeroed out in order to start with equal readings prior to beginning data collection (Figure 6). Each app was moved with the distal arm to each preset angle, and the angle was held for 3 seconds for the app measurement to hold steady. The data was then gathered from the app when the electronic goniometer reading showed the angle desired. The distal arm was returned to the zero point, the app was again reset to zero, and the process repeated to that same angle. Each angle was measured a total of ten trials for each app, divided between two data collection sessions (Figure 7).
Figure 4:Angle Pro: Apple device app.
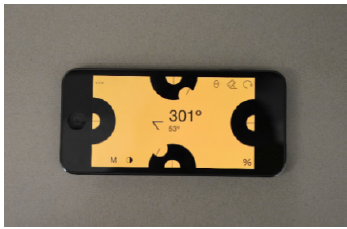
Figure 5:Get My ROM: Apple device app
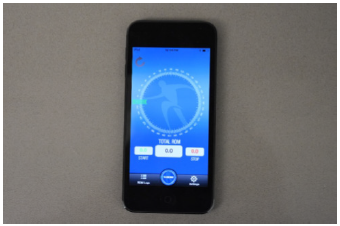
Figure 6:Goniometer Pro: Top - Apple device version, Bottom - Android device version.
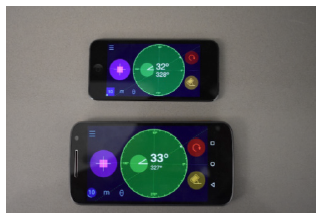
Figure 7:Measure to Move Goniometer: Apple device.
Statistical analysis
From the selected apps and data collection, the values of the ten trials for each angle for every app were calculated using IBM SPSS Statistics 21 to produce descriptive statistical data for mean, standard deviation, standard error of measurement, and mean absolute difference. The mean absolute differences were calculated as the absolute value of the difference between the measured angle and the reference angle (Figure 8). Using mean absolute difference, the best apps were identified by the smallest variance from the reference angle. One app from the Apple device was selected and one app from the Android device was selected as the best performing apps (Figure 9). The same two apps were then assessed for Intrarater reliability by calculating intraclass correlation coefficients (ICC) with 95% confidence intervals (CI). ICCs are considered viable tests to assess for reliability [12]. The ICC was performed by taking the worst measured angle out of the ten trials for each angle, and then comparing them to the reference angle (Figure 10). These values were compared to the electronic goniometer reference angle to produce ICC values to determine further correlation of the apps to the gold standard. According to Portney et al. [13], there are defined ranges of ICC values [13]. The ranges are as follows: less than 0.50 is poor, 0.50 to 0.75 is considered moderate, 0.75 to 0.9 is classified as good, and a value greater than 0.90 is rated excellent [13,14].
Figure 8:Rate Fast Gonio: Left-Android version, Right-Apple version.
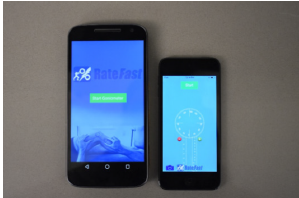
Figure 9:360 Protractor - Android version

Figure 10:Bubble Level, Spirit Level - Android device.
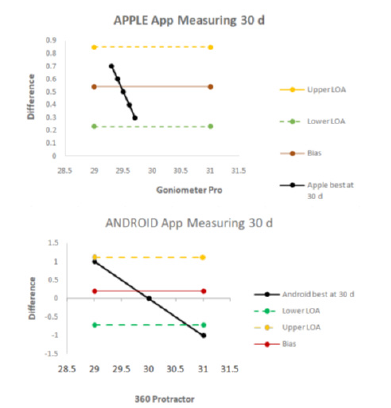
The measured angles of the ten trials at 30 degrees were compared for the best apps to find directional preference and level of agreement via the Bland-Altman plot, shown in Figure 11. In the Bland-Altman plot, the differences between the scores (on the y-axis) were plotted against the values of the app scores (on the x-axis). The deviation of the difference from zero line, which implies total agreement between the instruments, indicates the degree of agreement for each score taken at the given degree point [15]. A 95% limit of agreement (LOA) was defined as ±1.96 standard deviations from the mean, thus providing a lower and upper LOA. The scores were further assessed for agreement by checking if the values were between the upper and lower LOA. Concurrent validity was investigated with a Pearson’s r correlation coefficient to describe the strengths and direction of correlation at various degree points of the gold standard/electronic goniometer (reference criterion) to the best apps, Apple’s Goniometer Pro and Android’s 360 Protractor.
Figure 11:Bland-Altman Plots. This graph shows all 30-degree measurements taken for the best performing apps on both the Apple and Android devices fell within the upper and lower Limits of Agreement (LOA).
Result
The measurements were found to be normally distributed via plotting histograms and obtaining skewness and kurtosis values. From the nine total apps that were downloaded between the two mobile devices, information and background on the each were collected and compiled in Table 1. This includes details about prices, provider, number of downloads at the time of this study, and most recent update. Tables 2a and Table 2b contain the strengths and weaknesses concerning the interface of the app or usage that was noted during data collection. Images of each app interface can be found in Appendix C. Utilizing SPSS 21 to analyze the measurements, data produced descriptive statistical data including mean, standard deviation, standard error of measurement, and mean absolute difference (see Table 3 for Apple apps data and see Table 4 for Android apps data). By comparison of the numbers from the data, two apps were found to have mean values that were closest to the reference angle, with the smallest standard deviations; one app on the Android and one app on the Apple.
Table 1:Goniometer app Strength and weaknesses.
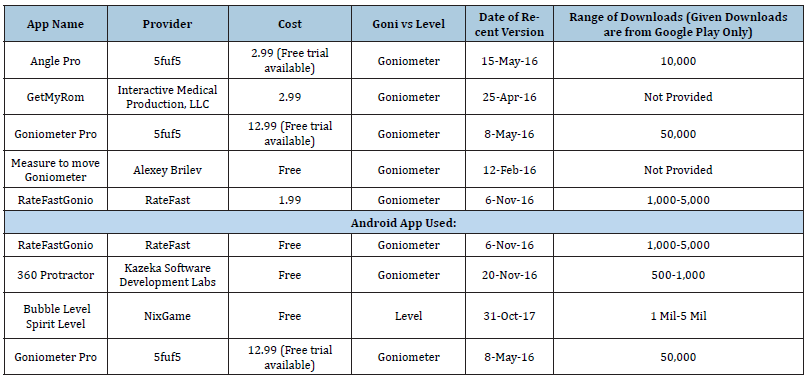
Table 2a:Goniometer app Strength and weaknesses.
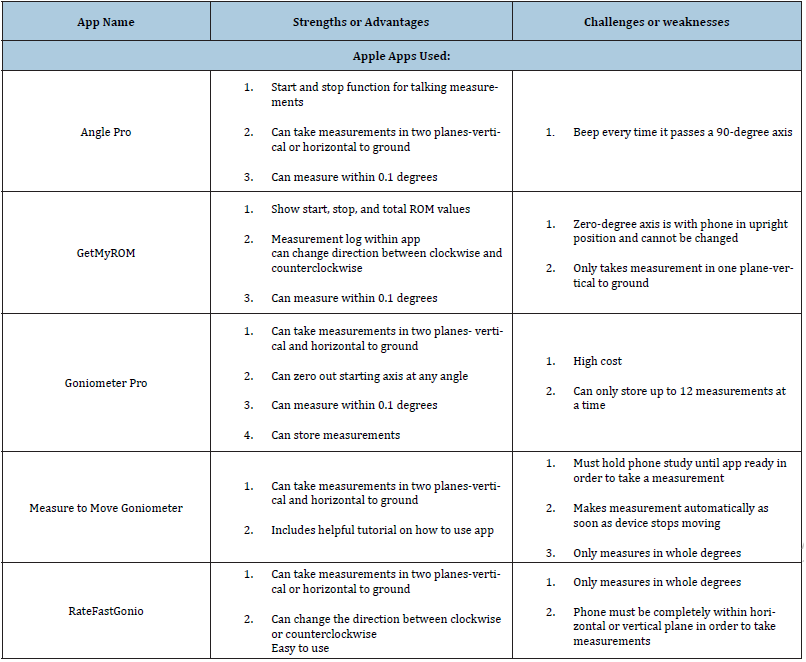
Table 2b:Goniometer app Strength and weaknesses.
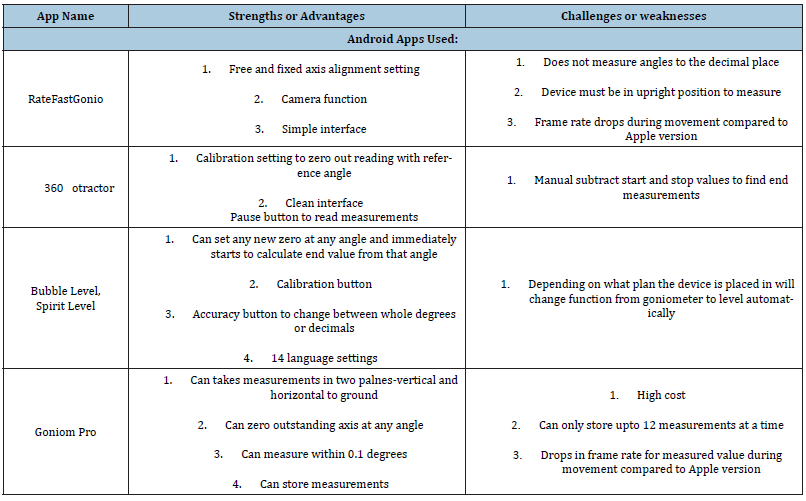
Table 3:Descriptive statistics for refences and app measures.
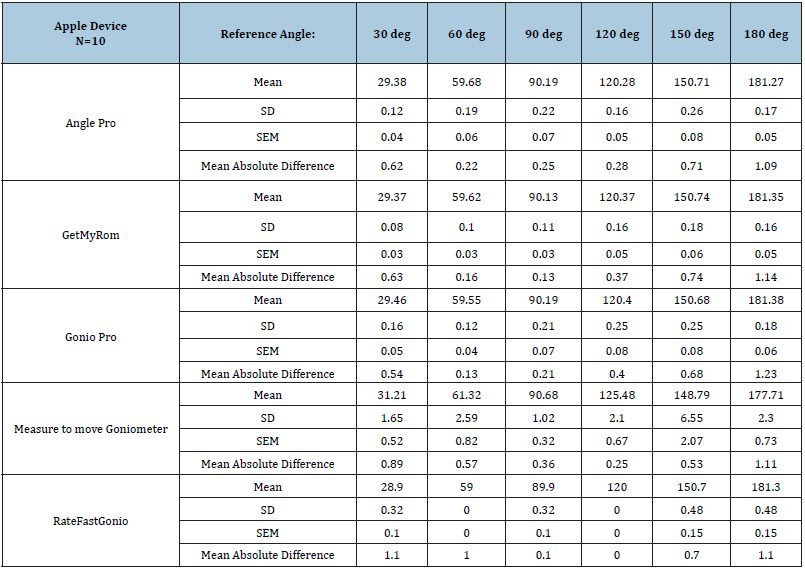
Table 4:Descriptive statistics for refences and app measures.
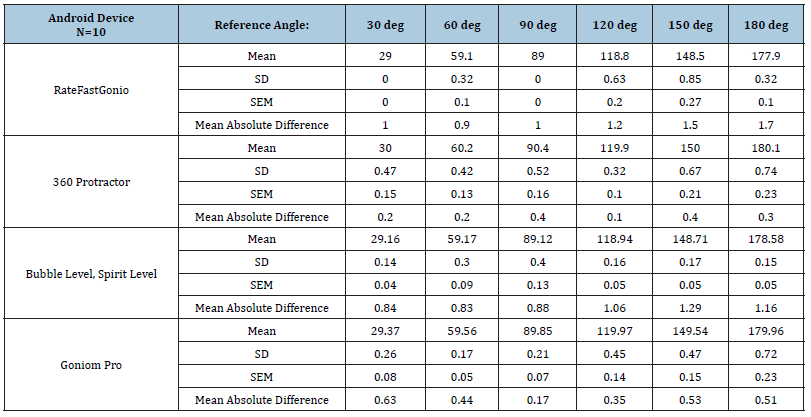
The best Apple app was found to be Goniometer Pro with mean values of 29.46, 59.55, 90.19, 120.40, 150.68, and 181.38 degrees and standard deviations at each reference angle respectively from 30 to 180 degrees of 0.16, 0.12, 0.21, 0.08, 0.08, and 0.06 degrees difference. The best Android app was found to be 360 Protractor with values for mean at each angle at 30.0, 60.20, 90.40, 119.90, 150, and 180.10 degrees and standard deviations measured at 0.15, 0.13, 0.16, 0.10, 0.21, and 0.23 variance for the respective angles
Inter-rater reliability
The two apps, Goniometer Pro Apple version and 360 Protractor, were selected to calculate the ICC for reliability because they had the smallest mean absolute difference values compared to the other apps of the same device. Thus, clinicians will be most interested in the results of the best apps that this study tested. Our results show that both apps have an ICC of 0.999 (95% CI .988, 1.000). Based on these results both apps fall in the ICC category of excellent correlation.
Concurrent validity
From these two best apps, the Goniometer Pro Apple version and 360 Protractor, Bland-Altman Plots were created for comparison of measured angles to the reference angle of 30 degrees (See Graphs 1 and 2). The Bland-Altman Plot graphically presents the discrepancy between the Apple and the Android ROM apps at the 30-degree measurement point. According to the Bland-Altman plot, the LOAs were 0.23 to 0.85 degrees for Apple for a mean difference (95% CI) of 0.54, which is equal to an expected between-measure variation of 0.62 (i.e. a range between 0.23 to 0.85 degrees) The Bland-Altman Plots can be found in Appendix D. Thus, the LOA indicated small differences between these two instruments for individual subjects. Only five points are labeled on the graph as the remaining values are imbedded under those five points as repeat values during data collection. For the Android app, the 360 Protractor produced LOAs of -0.72 to 1.12 for a mean difference of (95% CI) of 0.2 which is also between the expected LOA. However, some measured values were beyond the lower LOA. The majority of the values fell within the LOA. Again, there are fewer points on the graph than trials because multiple trials had the exact same values, similar to the Apple app. The Pearson correlation coefficient for validity was significant at r=1.00 (95% CI 0.99, 1.00), a very strong r value, with p<.01. In terms of comparison of the apps that were available on both mobile devices, the Goniometer Pro on the Apple device had a lower absolute mean difference of 0.54 compared to the Android device with a 0.63. The Rate Fast Goni performed slightly better on the Apple device compared to the Android device with a mean absolute difference of 1.0 and 1.1 respectively.
Discussion
The results of this study provide evidence of excellent reliability and validity of the smartphone goniometer apps to measure range of motion angles, compared to the reference measures, making it suitable for clinical use. The results of this study differ from previous research conducted on goniometer applications in that it examines the ability of the technology itself to accurately measure angles and tests multiple apps across two different smartphone platforms. As the results show, the best performing apps were the Goniometer Pro and the 360 Protractor on the Apple and Android devices respectively. However, all of the apps tested performed well enough to be statistically significant substitutions for traditional goniometer tools. The mean absolute difference at every angle for even the worst performing app was still less than the minimal detectable change in goniometric measurements using phone applications [16]. These results align with previous studies that have found the Goniometer Pro app on Apple devices to be valid in measuring healthy shoulder and wrist range of motion as well as pathological neck range of motion compared to traditional goniometer tools [4,7]. Additional features of each app can be found in Appendix A, including strengths and weaknesses of each app’s user interface.
Additionally, two of the apps, Goniometer Pro and Rate Fast Goni, were available on both the Apple and Android phones and were able to be compared across the two operating systems. On both devices, the Goniometer Pro offers a free trial version after which the full version of the app costs $12.99. The Rate Fast Goni is free on Android devices and costs $1.99 on Apple devices. The Android version of both the Goniometer Pro and the Rate Fast Goni app has a slower frame rate compared to the respective Apple versions, resulting in non-fluid movements when using the app. Furthermore, the Android version of the Rate Fast Goni can only take measurements with the phone moving in its vertical plane versus the Apple version of the same app which allows the phone to be used in both the vertical and horizontal planes. From the data, both apps on the Apple device had a lower absolute mean difference than their Android counterpart. This indicates that the Apple versions were more accurate than the Android versions of the apps for the given measurements.
The clinical significance of these results is that goniometer applications are found to be a reliable and valid substitution to traditional range of motion measurement tools to be used by clinicians for convenience and efficiency in practice. These results are very beneficial to clinicians who do not have measurement tools readily available to them as they can justifiably use a goniometer phone application instead. Physical therapists working in a variety of settings from home health to skilled nursing can utilize this available technology to aid in appropriately evaluating patient range of motion without having to carry around additional equipment. In addition, these apps could potentially be made useful on missionary trips in underdeveloped countries without adding to the burden of additional physical supplies. As seen, some applications perform better than others and offer different strengths and weaknesses in usability, so the results of this study may be used to aid clinicians in choosing which app is most appropriate for them. Throughout data collection, several complications were encountered that had to be resolved. Securing the mobile device to the distal arm of the electronic goniometer provided a challenge. The devices needed to be attached securely and consistently placed on the distal arm to give accurate readings. Double sided adhesive was used to secure each phone to the electronic goniometer and markings were used to keep accurate placement. The MotoG4 Android device provided an additional challenge due to the size of the camera on the backside of the device. A thin piece of cardboard with a cutout for the camera was secured to the back of the phone to make the backside flat so the phone would fit flush on the electronic goniometer arm. Another complication encountered was with the Measure to Move app on the Apple iPhone. This application takes a measurement as soon as the mobile device stops moving instead of pressing a button to take the measurement. This makes it difficult to make small adjustments before taking the measurement when trying to reach a specific angle. This was solved by taking the measurement as close as possible to the prescribed angle and recording both the angle on the goniometer and on the app to be compared. This still allowed the difference in measurements to be studied. However, this feature may cause difficulties in clinical settings as the app may record a measurement before the joint in question is at end range.
Reproducibility of goniometric measurements is an important trait so that measurements over a period of time can be compared to track patient progress. This study took ten measurements at each angle on each application being tested in order to account for any variability in the measurements. These ten measurements were split between to two separate testing times to again ensure the reproducibility of the measurements. Some limitations in this study were noted. Firstly, this study did not utilize human subjects and instead used a mechanical lever arm to produce the movements measured. This study was focused on testing the reliability and validity of the apps ability to measure angles so using a mechanical lever arm reduced the number of variables that could have muddied the measurements taken. However, when these results are applied clinically to measure patients range of motion, factors like position of the device and the clinician’s ability to use the app may change the accuracy of the apps. Previous studies conducted have shown good interrater reliability using the Goniometer Pro iPhone app in clinical settings for measuring range of motion in patients suffering non-specific neck pain [7,11]. Additionally, both Goniometer Pro and Get My ROM iPhone apps demonstrated excellent interrater reliability in measuring range both asymptomatic and symptomatic shoulders [4,6].
Another limitation is that the researchers were not blinded when taking measurements with the applications which could have added bias to the results. Separate researchers read the measurements from the electronic goniometer and phone applications to attempt to reduce this bias as much as possible. A potential solution to this could be to randomize each measurement taken so that the researcher operating the phone applications could remain blinded. It would be beneficial for follow-up studies to be conducted to test the best performing goniometer apps on human subjects. Now that the apps have been found to be reliable and valid in their measurements, the results should be reproduced on human subjects to further confirm their clinical applicability. Future studies may also examine phone applications in dynamic measurements as there is limited research currently available [4,15]. In addition, the apps tested could be studied across a wider range of mobile devices to increase the availability to clinicians. Finally, it is recommended that this study be updated in the future to investigate new mobile device technology and smartphone applications as they become available. In conclusion, this study has shown the technology in these apps is a reliable and valid substitution for traditional tools such as an electronic or universal goniometer in measuring angles. Mobile device goniometer apps can provide an effective and portable method for clinicians to assess joint range of motion and should continue to be studied for application in clinical practice.
Disclaimer
The devices, apps, and statistical software were purchased by Angelo State University’s Department of Physical Therapy for research purposes only. The authors of this study did not receive any financial incentive or other benefits from any commercial entities related to the content of this article.
Acknowledgement
The authors would like to thank Dr. Allyn Byars and Dr. Lee Atkins for their contributions to this study.
References
- Moore S, Jayewardene D (2014) The use of smartphones in clinical practice. Nurs Manag (Harrow) 21(4): 18-22.
- Pourahmadi M, Takamjani IE, Sarrafzadeh J, Bahramian M, Bandpei MAM, et al. (2017) Reliability and concurrent validity of a new iPhone® goniometric application for measuring active wrist range of motion: A cross-sectional study in asymptomatic subjects. J Anat 230(3): 484-495.
- Milani P, Coccetta C, Rabini A, Sciarra T, Massazza G, et al. (2014) Mobile smartphone applications for body position measurement in rehabilitation: a review of goniometric tools. PMR 6(11): 1038-1043.
- Lugoni L, Brunati R, Sale P, Casale R, Ronconi G, et al. (2019) Smartphone applications validated for joint angle measurement: A systematic review. Int J Rehabil Res 42(1): 11-19.
- Vohralik S, Bowen A, Burns J, Hiller C, Nightingale E (2015) Reliability and validity of a smartphone app to measure joint range. Am J Phys Med Rehabil 94(4): 325-330.
- Hernandez KM, Chang A, Harris NE, Jaarsma R, Gill T, et al. (2018) Smartphone applications for the evaluation of a pathologic shoulder range of motion and shoulder scores - a comparative study. JSES Open Access 2(1): 109-114.
- Pourahmadi M, Bagheri R, Taghipour M, Takamjani I, Sarrafzadeh J, et al. (2018) A new iPhone application for measuring active craniocervical range of motion in patients with non-specific neck pain: a reliability and validity study. Spine J 18(3): 447-457.
- Behnoush B, Tavakoli N, Bazmi E, Fard FN, Shahi MHP, et al. (2016) Smartphone and universal goniometer for measurement of elbow joint motions: a comparative study. Asian J Sports Med 7(2): e30668.
- Carey M, Laird D, Murray K, Stevenson J (2010) Reliability, validity, and clinical usability of a digital goniometer. Work 36(1): 55-66.
- Milanese S, Gordon S, Buettner P, Flavell C, Ruston S, et al. (2014) Reliability and concurrent validity of knee angle measurement: smart phone app versus universal goniometer used by experienced and novice clinicians. Man Ther 19(6): 569-574.
- Wellmon R, Gulick D, Peterson M, Gulick C (2016) Validity and reliability of 2 goniometer mobile apps: device, application, and examiner factors. J Sport Rehabil 25(4): 371-379.
- Jones A, Sealey R, Crowe M, Gordon S (2014) Concurrent validity and reliability of the simple goniometer iPhone app compared with the universal goniometer. Physiother Theory Pract 30(7): 512-516.
- Portney L, Watkins M (2009) Foundations of clinical research applications to practice. (3rd edn), Pearson Prentice Hall, Upper Saddle River, New Jersey.
- Atkins L, James C, Sizer P, Jonely H, Brismee J (2014) Reliability and concurrent criterion validity of a novel technique for analyzing hip kinematics during running. Physiotherapy Theor Pract 30(3): 210-217.
- Heiskanen J, Tolppanen A, Roine RP, Hartikanainen J, Hippelainen M, et al. (2016) Comparison of EQ-5D and 15D instruments for assessing the health-related quality of life in cardiac surgery patients. Eur Heart J Qual Care Clin Outcomes 2(3): 193-200.
- Mehta S, Barker K, Bowman B, Galloway H, Oliarshirazi N, et al. (2017) Reliability, concurrent validity, and minimal detectable change for iPhone goniometer app in assessing knee range of motion. J Knee Surg 30(6): 577-584.
© 2019 Heather J Braden. This is an open access article distributed under the terms of the Creative Commons Attribution License , which permits unrestricted use, distribution, and build upon your work non-commercially.
 a Creative Commons Attribution 4.0 International License. Based on a work at www.crimsonpublishers.com.
Best viewed in


.jpg)


 Editorial Board Registrations
 Submit your Article
 Refer a Friend
 Advertise With Us
.jpg)


.jpg)


.bmp)
.jpg)
.png)
.jpg)


.jpg)


.png)

.png)


.png)


