- Submissions

Full Text
Forensic Science & Addiction Research
Dating of Traumatic Brain Injury in Forensic Cases Using Immunohistochemical Markers (II): Glial Fibrillary Acidic Protein and CD68
Romero Tirado MA2*, Blanco Pampin JM2, Gallego Gómez R1, García-Caballero L3 and Varela Gómez M2
1Department of Morphological Sciences, Medicine College, University of Santiago de Compostela, Spain
2Department of Forensic Pathology, Institute of Legal Medicine of Galicia, Santiago de Compostela, Spain
3Department of surgery and medical-surgical specialities, University of Santiago de Compostela, Spain
*Corresponding author:Romero Tirado MA, Department of Forensic Pathology, Institute of Legal Medicine of Galicia, Santiago de Compostela, Spain
Submission: June 02, 2022;Published: June 13, 2022

ISSN 2578-0042 Volume5 Issue5
Abstract
Studies about head trauma are experimental or have either a clinical or a prognosis purpose. In this study human samples from autopsies are used with the purpose of answering medical-legal questions. Four experimental groups with a total of twenty-one individuals and a control group of four individuals were studied. Samples were obtained from the injured area of each individual, fixed in 10% formalin during 24 hours and preserved in 70% ethanol. Each experimental group was then compared to the control group using statistical analysis after cell count to diagnose hyperplasia. Glial Fibrillary Acidic Protein (GFPA) shows some processes that take place after the injury and their sequence: blood brain barrier (BBB) begins to change two hours postinjury, hypertrophic astrocytes are present twelve hours postinjury, hyperplasia and the different types of BBB reactions start twenty hours postinjury, astrocytes arrange geographically and hyperplasia reaches its peak on day seventeen, and finally, on day thirty, astrocytes begin to return to their normal morphology and constitutes the scar. Hyperplasia doesn’t return to basal levels for months or even years. CD68 shows that macrophages begin to migrate almost immediately. It also shows that a restrained microgliosis begins on the second hour postinjury. These two processes reach their peak between days 17 and 20 postinjury, at the same location where astrogliosis reaches its peak.
These changes could be used to approximate the date of trauma distinguishing between long survival cases from those whose death was immediate.
Keywords: Traumatic brain injury; Immunohistochemistry; Axonal injury
Highlights
A. Immunohistochemical markers are useful for dating severe traumatic brain injury.
B. Glial Fibrillary Acidic Protein (GFPA) highlights how astrocytes change their morphology
(hypertrophy) and rise their number (hyperplasia) during the inflammatory process.
C. Blood Brain Barrier (BBB) undergoes changes after trauma that are able to be seen
thanks to GFPA.
D. CD68 allows to see how macrophages migrate to brain parenchima and the behaviour of
microglia after an insult.
Introduction
As we explained in the first part of our previous paper [1], head trauma is one of the first causes of mortality and disability in industrialized countries, mainly in people younger than 45 years old, due to the increase of the use of motor vehicles. In fact, around 25% of violent deaths are consequence of head trauma [2]. Immunohistochemistry has shown better results than classical techniques, not only for diagnosis but also for clinical prognosis, because in many cases there is a relationship between mild head trauma and long-term sequelae, including neurodegenerative diseases like Alzheimer or Parkinson [3]. Nowadays most studies about traumatic brain injury are experimental on animals. There are also studies about clinical series with therapeutic or prognosis purposes, like those involving GFAP and SB100 protein [4,5], but all of them have only clinical relevance.
From a forensic point of view, classical techniques already revealed neuronal necrosis expressed as eosinophilic cytoplasm, nuclear lumps, pycnosis and caryorrexis [6,7]; and also that there are inflammatory cells (activated microglia) in addition to axonal bulbs [8]. This confirms the vitality of the injury, but the period of penumbra still remained too long. With the immunohistochemical techniques the evolution of gliosis, which is the specific inflammatory response in brain tissue, can be seen. As these techniques now reveal, the evolution of gliosis depends on astrocytes and microglia and need the help of macrophages and leukocytes that come from the bloodstream. It is supposed that there are two ways to widespread this reaction along the different structures of the CNS: along the injured axons between cortex and subcortex; and thanks to microparticles (a kind of extracellular vesicles secreted by neurons) [9]. Activated microglia removes the necrotic tissue (with the help of macrophages) and secretes growing factors that facilitate tissue regeneration. Under these conditions cells change their morphology and express certain proteins of membrane and cytokines [10]. They show a larger cytoplasm and more processes, which are thicker and more branched. These characteristics disappear after the first week postinjury, but some activated markers (TNF-α, IL1, IL6, OX6, OX42…) are still visible for a longer period of time [11]. After an injury, astrocytes undergo morphological changes, which can be seen using glial fibrillary acid protein (GFPA). This protein constitutes the cytoskeleton of this cell type allowing its identification in tissue sections. Astrocytes become hypertrophic (showing stronger staining and more processes) and hyperplasic (which means an increase in cell density in the tissue) [12]. In the previous paper the behavior of neurons using βAPP and the 68 kD subunit of NF was shown [1]. This paper exposes the inflammatory response of damaged brain tissue using GFAP and CD 68 which stained astrocytes and microglia respectively. Taken together we will have a more detailed idea about morphological and functional changes that occur after an injury, and this way we will make a closer approximation to injury dating as was proposed by Siman and cols [13].
Material and Methods
Twenty-five human brains from medical-legal autopsies were selected, none of which showed previous story of stroke, seizures, hypo or hyperglycemia or toxicological brain injury. For twentyone of the selected individuals death was related to severe head trauma and were designated as the experimental cases. The remaining four were designated as negative control cases, as the death of the individuals were due to sudden cardiac death without any head trauma. Of the experimental cases, eleven were men and ten were women with ages between 33 and 94 years. The bodies were refrigerated at 4ºC. During the autopsy and the examination of clinical files we considered the presence of skull fractures, intracranial hemorrhages, and eventual neurosurgery. Thus, the experimental cases for study were divided into four groups: 1) survival after injury less than 2 hours, 2) survival between 2 and 24 hours, 3) survival between 24 hours and 30 days and 4) survival longer than 30 days. As negative controls, samples from four cases of sudden cardiac death without any head trauma, agonic phenomena or metabolic issues were collected. For all cases, once the brain had been extracted and weighted, we made 1-1,5cm wide slices and obtained samples from de contusion areas. These samples were fixed in 10% buffered formaldehyde during no more than 24 hours, then they were routinely submerged in paraffin as usual. Sections of 4μ were obtained and laid in silanized slides (Dako®, Glostrup, Denmark). In every case conventional microscopic characteristics, like the presence of intracranial hemorrhage, were considered.
Immunohistochemistry technique
First, antigen retrieval was carried out by heating the slices in a
microwave oven for 20 minutes at 750W in Tris-EDTA buffer (Tris
10mM, EDTA 1mM, pH9). After washing in PBS (Buffered saline
phosphate, 100 mM phosphate pH 7,2; 150mM NaCl), sections
were incubated consecutively in:
1. Primary antibody (1h) CD 68 PGM1 and GFAP, (FLEX® readyto-
use, Dako, Glostrup, Denmark)
2. Peroxidase blocker (Dako) 10 minutes
3. EnVision® dual rabbit, mouse (Dako) 30 min
4. Diaminobenzidine. Liquid DAB+Substrate Chromogen System
(Dako) 10 minutes as commercial instructions recommend
(50μL DAB in 1mL of substrate buffer). After each step, sections
were washed twice during 5 minutes with PBS, and after DAB,
they were washed with distilled water. Solutions of primary
antibody β-APP were prepared with a commercial antibody
diluent (Dako). In every case, negative controls were included,
in which primary antibody was replaced with PBS. At the end,
sections were counterstained with Harris Hematoxylin during
30 seconds.
Immunoreactivity quantification
The KP1 clone of CD68 stained weakly the microglia; this is why the PGM1 clone that gives a stronger staining was employed. With the first clone our cell count was underestimated because the number of cells that we could see with it was much lower than with the latter clone. The number of immunoreactive cells per microscopic field with a magnification of 20x were counted. We photographed four zones of the white matter and another four zones in the gray matter near to the injury. The mean of stained cells per field was compared with the mean of stained cells in controls. We considered that hyperplasia exists if we observed 50% more of stained cells with GFAP (in both white and gray matter). This reference value was settled based in the studies of Weber and cols. [14] and Li and cols [4]. We considered positive the cases of CD 68 that showed a density of stained cells of more than 100% of controls. We assigned ++ to cases whose density was between 200% and 300%, and +++ to cases with a density higher of 300%, regarding the quantitative analysis made by Smith and cols [15].
Statistical analysis
For the statistical comparison of cellular density we employed the application SPSS (IBM version 20). To compare the central trend of cellular density in every group with GFAP and CD 68 we made at first, an ANOVA test which showed a significant difference. So, we proved the normal behavior of the sample using the Kosgorov/ Smirnov test and then the Scheffe test to compare “post hoc” each group against the controls.
Results
Control group (n=4)
GFAP showed a high expression in both protoplasmic astrocytes in the gray matter and fibrous astrocytes mainly located in the white matter. The former showed rounded and strongly stained somas where the nucleus cannot be distinguished. Their processes were shorter, more compact and more homogeneous than those of fibrous astrocytes. On the other hand, fibrous astrocytes had a larger soma with big nuclei surrounded by a small portion of cytoplasm, and long extensions that almost did not show branches. Both of them give off prolongations that surrounded the blood vessels forming part of Blood Brain Barrier (BBB). CD 68 was expressed by resident and activated microglia, and macrophages. Since the control group had no inflammatory pathology, only resident microglia was observed, mainly in the white matter. They are small cells with a central, elongated nuclei and a little amount of citoplasm polarized in two opposites extremes. They also showed few prolongations.
GFAP
Group 1 (survival less than 2 h. n=7):The majority of these cases showed no hypertrophic features (rounded soma, with more strongly stained cytoplasm and more prolongations) and it was easy to distinguish morphologically fibrous astrocytes from Protoplasmatic ones (Figure 1A). These cells did not show any morphological changes around hemorrhagic areas nor were they organized around injury foci. Nevertheless, in the two cases with a survival period longer than 30 minutes hypertrophy and an asymmetric increase of the thickness of the BBB was demonstrated, at the expense of the prolongations of the astrocytes (Figure 1B). After cell count (data not shown) we only observed hyperplasia in two cases, one of them with previous injury and the other one with not well known survival period. Geographic arrangement of the astrocytes around the injured area was also not observed. In summary, in this survival period, there was not enough time to observe a reaction of the astrocytes. We could see damaged and necrotic astrocytes in the injured area and around it because they are not reactive astrocytes, but necrotic cells affected by trauma. On other hand, the astrocytic reaction in BBB occurs earlier and could be detected 30 minutes after injury.
Figure 1: A. Fibrous astrocytes in white matter that don´t show hypertrophy nor hyperplasia in cases with a survival period
shorter than 2 h.
B. Some hypertrophic fibrous astrocytes in subcortical white matter. Restrained hyperplasia and some necrotic
astrocytes can also be seen.
C. Clear evidence of hypertrophy and hyperplasia of astrocytes.
D. The number and morphology of astrocytes returns to normal conditions in areas that are nor directly affected by
trauma. (CD 68 20X)
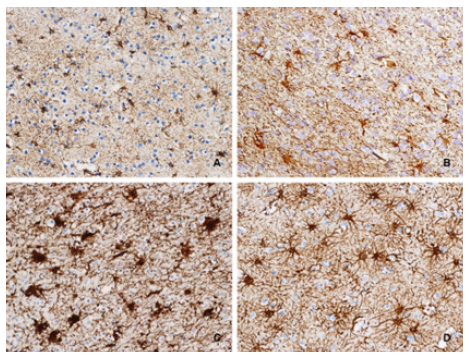
Group 2 (survival between 2 and 24 hours. n=6):GFAP immunoreactive astrocytes were hypertrophic not only in the injured region, but also in tissue outside that area. At the same time necrosis also involved astrocytes, which retracted and deformed. This phenomenon occured mainly at the edges of the injured tissue, along with hypertrophy (Figure 1C). The BBB showed different types of reactions. In some cases it was disrupted and hemorrhagic, in others it was hypertrophic. Finally, it was possible to observe the astrocytes sending more prolongations to reinforce and repair this structure (Figure 1D). Hyperplasia was observed in all cases except in two cases with a survival period of less than 20 h. This phenomenon occurred in the cortex and only in one case the astrocytes showed a geographic distribution, which suggests the beginning of the scar formation
Group 3 (survival between 1 and 30 days. n=6):The astrocytes were hypertrophic in all cases (Figure 2A). From day 17 of survival GFAP positive cells arranging near hemorrhagic areas were seAen, starting to take a lineal disposition (Figure 2B), consistent with scar formation. Since day 30 a well conformed barrier between necrotic and non-injured tissue was visible.
Hyperplasia was present in the gray matter in all cases of this group (Figure 1C), peaking on day 17. In the white matter hyperplasia was only observed in cases with a survival time of less than 17 days and it was between two and three times lower than in the gray matter. BBB always showed asymmetric hypertrophy and destroyed capillaries were not seen (Figure 2C).
Group 4 (survival longer than 30 days. n=2):In not injured tissue, the astrocytes has almost recovered its normal features (Figure 2D). The scar is well defined and its cells showed rounded morphology with fewer and larger processes. The number of cells per field decreased to normal levels in all cases, except in the gray matter of the case with the longest survival time. This might be due to the presence of a well-defined glial scar that replaces the parenchyma of the cortex. BBB also had a normal morphology again.
Figure 2: A. Asymmetric swelling of BBB due to new astrocytic processes.
B. Disrupted BBB. New astrocitic processes appear to repair it.
C. Protoplasmatic astrocytes fence a hemorrhagic focus.
D. Asymmetric hypertrophy of BBB with a large increase of astrocytic processes (GFAP 20X).

CD68
Group 1 (survival less than 2 h. n=7):Only resident microglia was observed using immunohistochemistry for CD68 in the brain sections of group 1 (Figure 3A). However, in one case with a surviving period of 30 minutes cell count demonstrated microglial hyperplasia (data not shown). Perivascular macrophages were also present in two cases (they were not included in the count). Although this finding is not pathognomonic of an inflammatory process, the presence of migrated macrophages was investigated, and we only found them in one case.
Group 2 (survival between 2 and 24 hours. n=6):In this group, microgliosis was demonstrated searching for CD68 immunoreactive microglia and it was found in both, white and gray matter in all cases. In these areas, macrophages were frequently found. A restrained increase of cellular density was found (Figure 3B), because only in two cases it was slightly higher than 200%. The first one has a survival period of 11 hours and the highest hyperplasia was present in the gray matter. The other one has 20h. of survival period and showed the increase of the number of cells in white matter. In the rest of cases the increase of cells was around 100%. As parenchymal (not perivascular) macrophages were included in the count, these results suggest diffuse incipient microgliosis.
Group 3 (survival between 1 and 30 days. n=6):Microgliosis mixed with macrophages was a constant feature in CD68 immunostained sections (Figure 3C), but unlike the group 2, a geographical distribution of these cells was observed, and was found in the same areas of astrogliosis. This concurrence was especially relevant in the last two cases. Microgliosis was usually higher in gray matter (as well as astrogliosis), with a peak between 17 and 20 days of survival, and never returned to baseline values.
Group 4
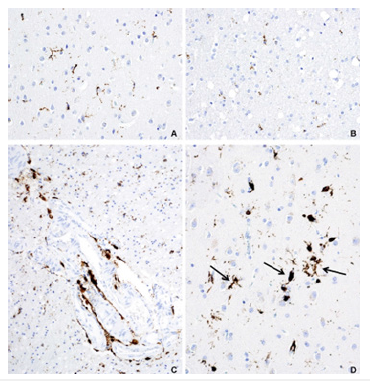
Group 4 (survival longer than 30 days. n=2):In this group microgliosis persists, mainly in the white matter (Figure 3D). Macrophages are more numerous in the gray matter and are found around vessels again (Figure 4A). CD68 immunoreactive macrophages may also be observed in meninges (Figure 4B).
Figure 3:A. Only resident microglia, mainly in white matter is observed.
B. Restrained increase of cellular density that suggest diffuse incipient microgliosis.
C. Microgliosis mixed with macrophages.
D. Microgliosis decreases but doesn´t return to baseline values even months after trauma. (CD 68 20X)
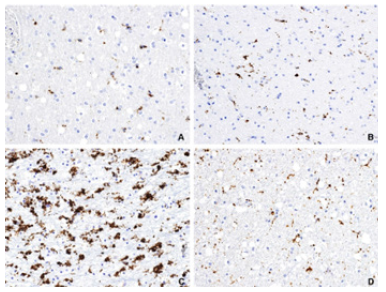
Figure 4: A. Resident microglia in gray and white matter respectively (control groups) (CD 68 20X).
B. Resident microglia in gray and white matter respectively (control groups) (CD 68 20X).
C. Perivascular macrophages in gray matter (CD68 10X).
D. Activated microglia (arrows) and migrated macrophages in gray matter (CD68 20X).
Highlights
GFAP immunoreactive astrocytes and microglia immunostained with CD 68 were counted (data not shown), in order to objectively evaluate the hyperplasia. This allows the statistical analysis about the behaviour of these cell types as survival time increases, in comparison to the control group (Figure 4C & 4D).
GFAP
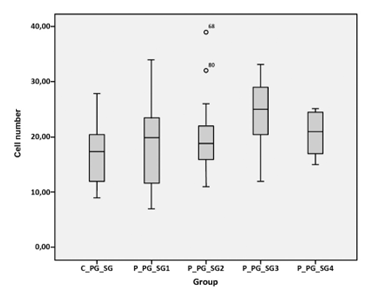
Gray matter:Significant differences were settled when comparing the average density of gray matter astrocytes in the control group to the cell density of other groups. For a difference to be statistically relevant, the p value should be less than 0,005 for a confidence range/level of 95%. In the present study p=0,002. When comparing each experimental group with the control group, only group 3 (with a survival period between 24 hours and 30 days) showed a significant difference (p=0,004). This is represented in the box graph below, which shows that the distribution of the averages is around a similar value for all groups, except for group 3 (Figure 5A).
Figure 5A: Y-axis: number of cells. X-axis: the first box corresponds to the control group in gray matter (C_PG_SG). The next boxes show the behavior of cell density in the four experimental groups, from less than two hours of survival (P_PG_SG_1) up to more than 30 days of survivela (P_PG_SG4). All means are grouped around a similar value, except for group 3.
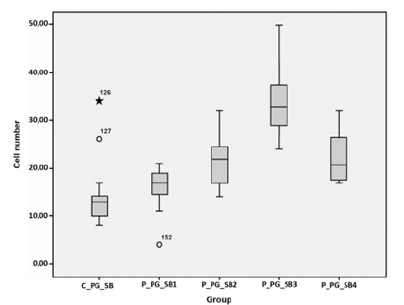
White matter:Significant differences were present in the groups 2 and 3 (between 2 hours and 30 days of survival) with a p=0,001 and p< 0,001 respectively. In addition, group 4 was close to significant values (p=0,017) The distribution of averages describes a curve that shows a progressive increase of the cellular density, which is higher in the gray matter, and has a peak of expression in group 3 with a survival period of weeks (Figure 5B).
Figure 5B: The first box correspond with control group in white matter (C_PG_SB). The next boxes show the behavior of cell density in the four experimental groups (P_PG_SB_1 to 4). The curve is similar to that of gray matter but with larger values of means
CD68
Gray matter:CD68 showed the same behavior as that of GFAP. Only the group 3 had significant differences, with a value of p< 0,001. The graph shows a curve similar to that of GFAP, with a peak in the group 3, although in this case the peak is smaller. Similarly, groups 2 and 4 (hours and months of survival, respectively) have values of p near to significant levels (Figure 5C).
Figure 5C: The first box correspond with control group in white matter (C_CD68_SG). The next boxes show the behavior of cell density in the four experimental groups (P_CD68_SG_1 to 4). The curve is similar to that of PGFA but with a smaller value of the peak. The mean values of groups two and four are near of significant values.

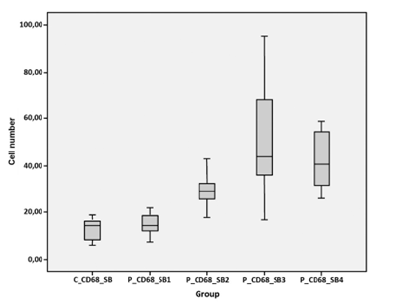
White matter:We observed the same results as those for GFAP. Groups 2, 3 and 4 showed significant differences with p=0,008, p<0,001 and p<0,001 respectively. The curve is parallel to those above, but the average of the second group (more than 2 hours of survival) is significantly higher than the average of the control group. The peak is reached in group 3 (with the survival period of several weeks); in group 4 a considerable decrease in the number of cells was observed, but anyway it was still significantly higher than in control group (Figure 5D). In sum, both markers have the same behavior in the white matter, but not in the gray matter
Figure 5D: The first box correspond with control group in white matter (C_CD68_SB). The next boxes show the behavior of cell density in the four experimental groups (P_CD68_SB 1 to 4). The graph is parallel to the others above, but the difference with controls is significant starting in group 2. The peak takes place in the third group as well; the mean of the fourth group continued to be significantly larger than the control group.
Discussion
The early changes that occur in the injured area may be explained mainly by direct mechanical forces. After survival time of hours or days ischemic and necrotic changes begin and get widespread all around [16]. One of the objectives of the present study was the design of a routine protocol useful in the daily work of the medical examiner. This is why we only took the samples from the injured area. In addition, other studies denmostrate that is in the pericontusional zone where immunohistochemical markers gets positive at earliest [17].
GFAP
In this study this characteristic protein of astrocytes was used to evaluate the evolution of the astrocytic activity from a morphological perspective. We observed morphological changes in activated astrocytes, which become rounded and bigger and have a higher proportion of cytoplasm in relation to the nucleus (hypertrophy). We also observed the increase in the number of cells per microscopic field (20x) (hyperplasia). Another remarkable morphological aspect is that the astrocytes foot processes to the BBB get thicker, and this structure becomes asymmetric as part of the inflammatory response, prompting functional disturbances, which allows the macrophages to reach neuronal parenchyma from bloodstream [12]. In the group for which the death of the patient took place immediately, there was no astrocytic reaction at all. Frequently hemorrhagic areas with morphologically normal astrocytes were observed and BBB had no alterations either. The hypertrophy of the astrocytes begins after two hours of trauma, while hyperplasia does not appear until 16 to 20 hours postinjury. These results are consistent with those obtained by Trautz et al. [17] Only one case with a shorter period of survival (30 minutes) showed both, hypertrophy and hyperplasia, maybe due to previous neurological insults that were not documented in its clinical file. When the time of survival increases, the astrocytic reaction spreads and it reaches non injured regions, far away from the impact zone. At 16 hours we can see migrated macrophages around vessels and that the BBB had been disrupted; the BBB sometimes is thicker and sometimes is completely destroyed.
Hypertrophy and hyperplasia become stronger and more spread, reaching their peak of expression between the 5th and the 17th day. From this time the scar begins to consolidate, retracting the tissue around vessels and making possible to distinguish necrotic from not injured tissue. All these results are consistent with those from Neri et al. [18] where the most intensity of immunopositivity was detected 14 days after trauma [18]. In cases where survival period was 30 days or more, astrocytes and BBB in non injured tissue has recovered their normal morphology and there is an organized scar around hyaline material, which is progressively replaced by astrocytic tissue. Regarding the statistical analysis of cell density in the gray matter, there was not significant difference in the central trend of groups 1, 2 and 4 in comparison to the control group. Anyway, the average of each group was very different from the average of the control group, but due to the small sample the standard error was so big that the difference seems to be mathematically not significant. All this means that these results are promising but further studies with a bigger sample should be carried out. In the white matter we obtained significant differences in groups 2 and 3, and in the 4th group the average was almost significantly different, but due to the small size of the sample the standard deviation is too large. Probably if the sample increases, the differences would be significant in the groups 1 and 4. Bye et al. [19] established that starting from the 4th hour, and for 2 weeks, the cellular precursors from the subventricular zone differentiate into distinct cellular lineages. This study, however didn´t have long term results. On the other hand, Geddes et al. [20] found GFAP positive results after the 5th day of evolution, with a peak on the 8th day and a geographical distribution around axonal bulb. Our results are similar to those obtained by Bye et al [19], but the point of maximum expression was the same as the one obtained by Geddes et al. [20] and Tashykov et al. [21]. Nevertheless, the most similar results that we have found in literature are those from Ohemichem et al. [16], who observed first morphological positive results (hypertrophy) for GFAP at 2,4 hours and hyperplasia starting at 24 hours. Moreover they established the peak to occur between 24 hours and 10 days after injury. Regarding the scar formation, we observed it from the 17th day. Our data differs from those of Geddes et al. [20] who described that this process begins after three months of evolution, The reason of these differences may lay in the strength of trauma. Our cases were severe traumas with SAH, whereas their cases were mild traumas without hemorrhage. On the other hand, Wang et al. [22] observed that GFAP expression and cellular density decrease since the 12th hour after trauma and the difference with our results lies in the area considered. They studied distant areas from direct trauma, trying to distinguish the secondary injury due to the increase of ICP and ischemia while ignoring the traumatic injured zone, which is precisely our area of study. Other authors Brooks et al. [23] demonstrated the persistence of elevated GFAP expression 90 days after injury, but the goals of their study were the changes in the brain after multiple mild traumatic injury, whereas our object of study is severe traumatic brain injury. Once more, they observed changes in distal areas from the injured zone. One phenomenon we cannot ignore is that in cases of repetitive trauma, there are multiple microvascular injuries which need to be repaired [24,25].
This means that there are multiple scar foci which increase the count of GFAP positive cells in this type of studies, but the present one focused in one severe injured area and did not include the scar formation in the count. This is not possible in cases with widespread microinjuries. In fact, Petraglia et al. [26], observed a resolution of acute astrocytic response 1 month post injury (even though they were multiple injuries), but if the repetitive injury went on, there was a reactivation of astrocytic activity six months later. This is why we think that a repetitive mild traumatic injury is not comparable to a severe injury, not clinically, nor histopathologically Our morphological data about BBB are similar to the functional ones obtained by Glushakova et al. [26], who found BBB disruption early and having a peak of GFAP staining at 24 hours postinjury. This point in time matches up with the moment of worse morphological conditions of BBB in this study. Functionally, the IgG staining begins to decrease one week after injury. Morphologically, in the group of survival time up to 30 days, there is a reparative hypertrophy in order to recover its normal function.
CD68
CD68 allow us to recognize the features of the inflammatory process: activation of microglia and migration of macrophages to the injured zone, although sometimes it was not possible to distinguish one from the other. Oehmichem et al. [27] and Geddes et al. [20] also had the same issue when they tried to differentiate the patterns of expression of different immunohistochemical markers (CD68 included), in case of diffuse axonal injury. Given the presence of resident microglia in physiological conditions, mainly in white matter, we applied a quantitative method to diagnose microgliosis. Oppenheimer et al. [28] studied how microglia gets around the axonal bulbs using classic techniques. Nevertheless, with immunohistochemistry this phenomenon is more difficult to observe, this is why it is more useful to determine the diffuse increase of inflammatory cells (activated microglia and macrophages) in parenchyma. An important consideration is that the only presence of macrophages in the brain tissue is a sign of inflammation because this cellular lineage is not present in this tissue in physiological conditions. In the present
study macrophages were found between 30 minutes and 2 hours after injury around vessels, but as time passes by, they spread all around the parenchyma, making it difficult to distinguish them from activated microglia. A significant increase of microglial cells was seen from the first 30 minutes, above all in the gray matter. In cases with a longer period of survival, microgliosis was also accompanied with more or less infiltrated macrophages. Besides, it was also observed from the 12th hour a higher expression of CD68 positive microglial cells. The peak of microgliosis was established on the 17th day in the white matter and on the 20th day in the gray matter. After that its presence decreases, but it does not reach the basal levels in any case, even months after injury. Given that there are few cases with a survival period longer than a year, it is not possible to find out when CD68 expression returns to normal range. What we can state is that after seven months diffuse microgliosis is still present. Nevertheless, Petraglia et al. [24] only observed a persistent microglial response in cases of multiple trauma, not in cases of unique injury. Johnson et al. [29] and Ramlackhansingh et al. [30] i.e., also agree with its persistence during months or years. The reason of these discrepancies may lay in the intensity of injury. The statistical analysis of the central trend of the number of these cells in the experimental groups in contrast with the control group, shows significant differences in the gray matter only in the third group, although in the second group the results were similar to those for GFAP [31]. Anyway, it is clear that it maximum expression takes place after weeks post injury. In the white matter, the differences are significant in the three last groups and the peak of expression is reached after weeks. Then it slightly decreases for months, but it never returns to the basal line. These results agree with those obtained by Oehmichem et al. [27], Gentleman et al. [32] and [18]. In these studies, they established that in severe brain injury CD 68 expression increases from the third hour, with a peak on the 10th day, lasting for over one year. On the other side, in the white matter it is not seen until the 12th hour. Gentelman et al. [30] established the first moment of expression of activated microglia in distant regions from the injury area between the second and the third day. Both of them agree that its expression last longer than a year in every location of the brain.
Smith et al. [15] observed that regionally there was no relationship between the activation of microglia and the neuronal injury. We did not focus our attention on the geographical location of microglia, but in those cases that astrocytes showed aggregation around the injury foci, a higher number of microglial cells in the same zones were found, what means that the statement of Smiths et al. [15] seems to be valid. Our results are similar to those of Oehmichem et al. [27], although the penumbra period is reduced to 30 minutes in this study. A stronger expression is observed in white matter 12 hours postinjury in comparison to that found by Oehmichem et al. [27] and Walter et al. [32] The differences between our results and those of Oehmichem et al are difficult to explain, because both studies are about severe brain injury with intracranial associated hemorrhage. And we detected at the first time of expression to be much earlier than theirs, but our peak of expression was much later. It is possible that these differences could be due to differences in the techniques used, for example the clone of antibody (we used PGM1) or the use of Envision versus ABC as detection system.
Conclusion
In spite of general recommendation of gather a wide sample of every encephalic structure in case of traumatic brain injury, studying samples from the contusion area with different markers is enough to observe chronological changes after head trauma, although it is generally recommended to make that extensive sampling. Studying the contusion area reproduces real work conditions and do not need special training or equipment, which allows to gather samples even in adverse conditions. In addition, limiting the assessment to the contusion area is simpler and has a higher confidence level in forensic diagnosis, because the changes in this area are more obvious and significant because this point is the “ground zero” from which the damage becomes widespread. We have established chronological evolutionary changes in the behavior of microglia and astrocytes after injury among which are especially relevant those observed in the first 30 minutes (perivascular macrophages) and at 2 hours (necrosis of neurons, hypertrophy of astrocytes and macrophages in parenchyma). These findings reduce significantly the penumbra period in traumatic brain injury dating Specifically GFAP shows astrocytic hypertrophy from the first 2 hours. BBB suffers changes in parallel. Hyperplasia takes place from the 16th hour reaching its peak between the 5th and the 17th day. CD 68(PGM1 clone) allows us to see the first perivascular macrophages between the first 30 minutes and 2 hours. In addition microgliosis begins in the gray matter in the same 30 minutes, whereas in the white matter cannot be seen until the 12th hour. Their peak of expression takes place on the 17th day and the 20th day respectively. All these data reinforce the conclusion obtained in the first part or our study. The penumbra period has been reduced, being possible to see the first changes from the first 30 minutes, and a detailed observation of all these markers (NF, β-APP, CD 68 and GFAP) could be a first approximation to injury dating, even though further research might be carried out to establish how far in time these findings can be extended.
Conflict of interest and Source of Funding
The authors declare that they have no conflict of interest or source of funding.
References
- Romero MA, Blanco JM, Gallego R (2018) Dating of traumatic brain injury in forensic cases using immunohistochemical markers (I): Neurofilaments and β-Amyloid Precursor Protein. Am J Forensic Med Pathol 39(3): 201-207.
- Morganti-Kossmann MC, Satgunaseelan L, Bye N (2007) Modulation of immune response by head injury. Injury Int J Care Injured 38(12): 1392-1400.
- Graham DI, Smith C, Reichard R (2004) Trials and tribulations of using Beta-amyloid precursor protein immuno histochemistry to evaluate traumatic brain injury in adults. Forensic Sci Int 146: 89-96.
- Li DR, Zhang F, Wang Y, Tan XH, Qiao DF, et al (2012) Quantitative analysis of GFAP and S100 protein- immunopositive astrocytes to investigate the severity of traumatic brain injury. Leg Med 14(2): 84-92.
- Papa l, Silvestri S, Brophy GM, Giordano P, Falk JL, et al. (2014) GFAP out-performs S100β in detecting traumatic intracranial lesions on computed tomography in trauma patients with mild traumatic brain injury and those with extracranial lesions. J Neurotrauma 31(22): 1815-1822.
- Kaya SS, Mahmood A, Li Y, Yavuz E, Göksel M, et al. (1999) Apoptosis and expression of p53 response proteins and cyclin D1 after cortical impact in rat brain. Brain Res 818(1): 23-33.
- Tashlykov V, Katz Y, Volkov A, Gazit V, Schreiber S, et al. (2007) Minimal traumatic brain injury induce apoptotic cell death in mice. J Mol Neurosci 37(1): 16-24.
- Vanezis P, Chan KK, Scholtz CL (1997) White matter damage following accute head injury. Forensic Sci Int 35(1): 1-10.
- Zhao J, Wang B, Huang T, Guo X, Yang Z, et al. (2019) Glial response in early stages of traumatic brain injury. Neurosci Lett 708: 134335.
- Perry VH, Nicoll JA, Holmes C (2010) Microglía in neurodegenerative disease. Nat Rev Neurol 6(4): 193-201.
- Cao T, Thomas TC, Ziebell JM, Pauly JR, Lifshitz J, et al. (2012) Mophological and genetic activation of microglia after diffuse traumatic brain injury in the rat. Neuroscience 225: 65-75.
- Ronchao S, Shudong Y, Zhiyi Z (2012) Pathological and immunohistochemical study of lethal primary brain stem injury. Diagn Pathol 7: 54.
- Siman R, Toraskar N, Dang A, McNeil E, McGarvey M, et al. (2009) A panel of neuron-enriched proteins as markers for traumatic brain injury in humans. J Neurotrauma 26(11): 1867-1877.
- Weber M, Scherf N, Kahl T, Braumann U, Scheibe P, et al. (2013) Quantitative analysis of astrogliosis in drug-dependent humans. Brain Res 1500: 72-87.
- Smith C, Gentlemean SM, Leclercq PD, Murray LS, Griffin WST, et al. (2013) The neuroinflammatory response in humans after traumatic brain injury. Neuropathol Appl Neurobiol 39(6): 654-666.
- Oehmichen M, Walter T, Meissner C (2003) Time course of cortical hemorrhages after closed traumatic brain injury: statistical analysis of posttraumatic hismorphological alterations. J Neurotrauma 20(1): 87-103.
- Trautz F, Franke H, Bonhert S, Hammer N, Müller W, et al. (2019) Survival-time dependent increase in neuronal IL- 6 and astroglial GFAP expression in fatally injured human brain tissue. Sci Rep 9(1): 11771.
- Neri M, Frati A, Turillazi E, Cantatore S, Cipolloni L, et al. (2018) Immunohistochemical evaluation of Aquoporin-4 and its correlation with CD68, IBA-1; HIF-1α, GFAP, and CD15 expressions in fatal traumatic brain injury. Int J Mol Sci 19(11): 3544.
- Bye N, Carron S, Han X, Agyapomaa D, Yun Ng S, et al. (2011) Neurogenesis and glial proliferation are stimulated following diffuse traumatic brain injury in adult rats. J Neurosci Res 89(7): 986-1000.
- Geddes JF, Volwes GH, Beer TW (1997) The diagnosis of diffuse axonal injury: implications for forensic practice. Neuropathol Appl Neurobiol 23(4): 339-347.
- Tashlykov V, Katz Y, Gazit V, Zohar O, Schreiber S, et al. (2007) Apoptotic changes in the cortex and hippocampus following minimal brain trauma in mice. Brain Res 1130(1): 197-205.
- Wang Q, Ishikawa T, Michiue T, Zhu BL, Guan DW, et al. (2012) Quantitative immunohistochemical analysis of human brain basic fibroblast growth factor, glial fibrillary acidic protein and single stranded DNA expressions following traumatic brain injury. Forensic Sci Int 221(1-3): 142-151.
- Brooks DM, Patel SA, Wohlgehagen ED, Semmens EO, Pearce A, et al. (2017) Multiple mild traumatic brain injury in the rat produces persistent pathological alterations in the brain. Exp Neurol 297: 62-72.
- Olczak M, Niderla-Bielinska J, Kwiatkowska M, Samojłowicz D, Tarka S, et al. (2017) Tau protein (MAPT) as a possible biochemical marker of traumatic brain injury in postmortem examination. Forensic Sci Int 280: 1-7.
- Glushakova OY, Johnson D, Hayes RL (2014) Delayed increases in microvascular pathology after experimental traumatic brain injury are associated with prolonged inflammation, blood-brain barrier disruption, and progressive white matter damage. J Neurotrauma 31(13): 1180-1193.
- Petraglia AL, Plog BA, Dayawansa S, Dashnaw ML, Czerniecka K, et al. (2014) The pathophysiology underlying repetitive mild traumatic brain injury in a novel mouse model of chronic traumatic encephalopathy. Surg Neurol Int 5: 184.
- Oehmichem M, Theuerkauf I, Meissner C (1999) Is traumatic Axonal Injury (AI) associated with an early microglial activation? Application of a double-labeling technique for simultaneous detection of microglia and AI. Acta Neuropathol 97(5): 491-494.
- Oppenheimer DR (1968) Macroscopic lesions in the brain following head injury. J Neurol Neurosurg Psychiatry 31(4): 299-306.
- Johnson VE, Stewart JE, Begbie FD, Finn D Begbie, Trojanowski JQ, et al. (2013) Inflammation and white matter degeneration persist for years after a single traumatic brain injury. Brain 136(1): 28-42.
- Ramlackhansingh AF, Brooks DJ, Greenwood RJ, Bose SK, Turkheimer FE, et al. (2011) Inflammation and trauma: microglial activation and traumatic brain injury. Ann Neurol 70(3): 374-383.
- Gentelman SM, Leclerq PD, Moyes L, Graham DI, Smith C, et al. (2004) Long-term intracerebral inflammatory response after traumatic brain injury. Forensic Sci Int 146(2-3): 97-104.
- Walter T, Meissner C, Oehmichen M (2011) Pathomorphological staging of subdural hemorrhages: Statistical analysis of posttraumatic histomorphological alterations. Leg Med 11: S56-S62.
© 2022 Romero Tirado MA. This is an open access article distributed under the terms of the Creative Commons Attribution License , which permits unrestricted use, distribution, and build upon your work non-commercially.
 a Creative Commons Attribution 4.0 International License. Based on a work at www.crimsonpublishers.com.
Best viewed in


.jpg)


 Editorial Board Registrations
 Submit your Article
 Refer a Friend
 Advertise With Us
.jpg)


.jpg)


.bmp)
.jpg)
.png)
.jpg)


.jpg)


.png)

.png)


.png)


